Note
Access to this page requires authorization. You can try signing in or changing directories.
Access to this page requires authorization. You can try changing directories.
Switch services using the Version drop-down list. Learn more about navigation.
Applies to: ✅ Microsoft Fabric ✅ Azure Data Explorer ✅ Azure Monitor ✅ Microsoft Sentinel
Graph semantics in Kusto enables you to model and query data as interconnected networks, making it intuitive to analyze complex relationships like organizational hierarchies, social networks, and attack paths. Unlike traditional relational queries that rely on joins, graphs use direct relationships between entities to traverse connections efficiently.
In this tutorial, you:
- Create a transient graph using the make-graph operator
- Query graphs to find relationships using graph-match
- Build persistent graph models for reusable analysis
- Compare transient versus persistent graph approaches
- Create a transient graph using the make-graph operator
- Query graphs to find relationships using graph-match
- Compare transient versus persistent graph approaches
If you don't have an Azure Data Explorer cluster, create a free cluster before you begin.
Prerequisites
- A Microsoft account or Microsoft Entra user identity to sign in to the help cluster
- A Fabric workspace with a Microsoft Fabric-enabled capacity
Access your query environment
Open the Azure Data Explorer Web UI to access the help cluster for this tutorial.
Navigate to your Microsoft Fabric workspace and open a KQL database to run the queries.
Navigate to the advanced hunting page to start querying Microsoft Sentinel data.
Navigate to Logs or to a Log Analytics workspace in the Azure portal to start querying Azure Monitor data.
Create a transient graph with organizational data
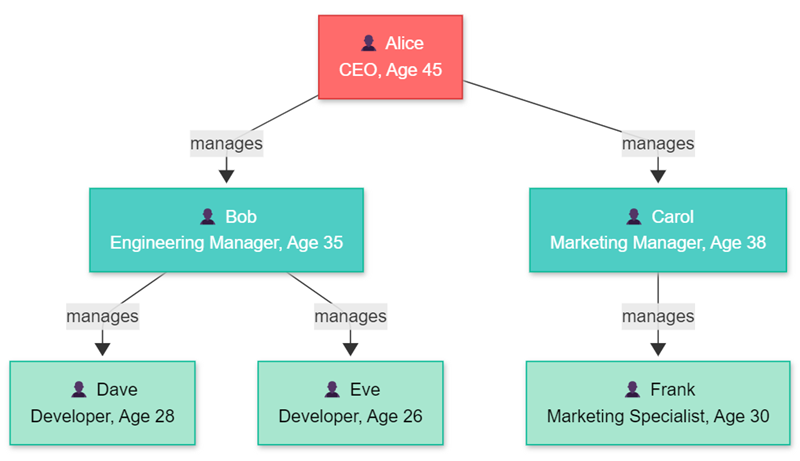
Create your first graph using sample organizational data. Transient graphs are created dynamically during query execution using the make-graph operator, which makes them ideal for ad-hoc analysis and exploration.
You'll work with a simple company structure where employees report to managers. This organizational hierarchy provides an intuitive example for understanding graph relationships:
Create the organizational graph structure using employee and reporting relationship data:
// Create sample employee data
let employees = datatable(name:string, role:string, age:long)
[
  "Alice", "CEO", 45,
  "Bob", "Engineering Manager", 35,
  "Carol", "Marketing Manager", 38,
  "Dave", "Developer", 28,
  "Eve", "Developer", 26,
  "Frank", "Marketing Specialist", 30
];
// Create reporting relationships
let reports = datatable(employee:string, manager:string)
[
  "Bob", "Alice",
  "Carol", "Alice",
  "Dave", "Bob",
  "Eve", "Bob",
  "Frank", "Carol"
];
// Build the graph and explore it
reports
| make-graph employee --> manager with employees on name
| graph-to-table nodes
Output
| name | role | age |
|---|---|---|
| Alice | CEO | 45 |
| Bob | Engineering Manager | 35 |
| Carol | Marketing Manager | 38 |
| Dave | Developer | 28 |
| Eve | Developer | 26 |
| Frank | Marketing Specialist | 30 |
Query relationships with graph-match patterns
Use the graph-match operator to find specific patterns in your organizational graph. The graph-match operator searches for relationships and connections within the graph structure.
Find all employees who directly report to Alice by matching the immediate reporting relationship pattern:
let employees = datatable(name:string, role:string, age:long)
[
  "Alice", "CEO", 45,
  "Bob", "Engineering Manager", 35,
  "Carol", "Marketing Manager", 38,
  "Dave", "Developer", 28,
  "Eve", "Developer", 26,
  "Frank", "Marketing Specialist", 30
];
let reports = datatable(employee:string, manager:string)
[
  "Bob", "Alice",
  "Carol", "Alice",
  "Dave", "Bob",
  "Eve", "Bob",
  "Frank", "Carol"
];
reports
| make-graph employee --> manager with employees on name
| graph-match (alice)<-[reports]-(employee)
  where alice.name == "Alice"
  project employee = employee.name, role = employee.role, age = employee.age
Direct reports output
| employee | role | age |
|---|---|---|
| Bob | Engineering Manager | 35 |
| Carol | Marketing Manager | 38 |
Next, find all employees in Alice's entire organization, including indirect reports, using variable length edges with *1..3 to traverse multiple levels of the hierarchy:
let employees = datatable(name:string, role:string, age:long)
[
  "Alice", "CEO", 45,
  "Bob", "Engineering Manager", 35,
  "Carol", "Marketing Manager", 38,
  "Dave", "Developer", 28,
  "Eve", "Developer", 26,
  "Frank", "Marketing Specialist", 30
];
let reports = datatable(employee:string, manager:string)
[
  "Bob", "Alice",
  "Carol", "Alice",
  "Dave", "Bob",
  "Eve", "Bob",
  "Frank", "Carol"
];
reports
| make-graph employee --> manager with employees on name
| graph-match (alice)<-[reports*1..3]-(employee)
  where alice.name == "Alice"
  project employee = employee.name, role = employee.role, reportingLevels = array_length(reports)
All organization members output
| employee | role | reportingLevels |
|---|---|---|
| Bob | Engineering Manager | 1 |
| Carol | Marketing Manager | 1 |
| Dave | Developer | 2 |
| Eve | Developer | 2 |
| Frank | Marketing Specialist | 2 |
Create a persistent graph model
Note
This feature is currently in public preview. Functionality and syntax are subject to change before General Availability.
Persistent graphs are stored in the database and can be queried repeatedly without rebuilding the graph structure. Create the same organizational structure as a persistent graph for better performance and reusability.
Create functions that return your sample data, and then define a graph model structure:
// Create a function that returns employee data
.create function Employees() {
    datatable(name: string, role: string, age: long)
    [
        "Alice", "CEO", 45,
        "Bob", "Engineering Manager", 35,
        "Carol", "Marketing Manager", 38,
        "Dave", "Developer", 28,
        "Eve", "Developer", 26,
        "Frank", "Marketing Specialist", 30
    ]
}

// Create a function that returns reporting relationships
.create function Reports() {
    datatable(employee: string, manager: string)
    [
        "Bob", "Alice",
        "Carol", "Alice",
        "Dave", "Bob",
        "Eve", "Bob",
        "Frank", "Carol"
    ]
}
Define the graph model with node and edge schemas:
.create-or-alter graph_model OrganizationGraph ```
{
    "Schema": {
        "Nodes": {
            "Employee": {
                "name": "string",
                "role": "string",
                "age": "long"
            }
        },
        "Edges": {
            "ReportsTo": {
            }
        }
    },
    "Definition": {
        "Steps": [
            {
                "Kind": "AddNodes",
                "Query": "Employees()",
                "NodeIdColumn": "name",
                "Labels": ["Employee"]
            },
            {
                "Kind": "AddEdges",
                "Query": "Reports()",
                "SourceColumn": "employee",
                "TargetColumn": "manager",
                "Labels": ["ReportsTo"]
            }
        ]
    }
}
```
Create a graph snapshot to materialize the model into a queryable structure:
.make graph_snapshot OrganizationGraph_v1 from OrganizationGraph
Query your persistent graph
Query the persistent graph using the same patterns as transient graphs. Find all employees who report to Alice:
graph("OrganizationGraph")
| graph-match (alice)<-[reports]-(employee)
  where alice.name == "Alice"
  project employee = employee.name, role = employee.role, age = employee.age
Find all employees in Alice's organization, including indirect reports:
graph("OrganizationGraph")
| graph-match (alice)<-[reports*1..3]-(employee)
  where alice.name == "Alice"
  project employee = employee.name, role = employee.role, reportingLevels = array_length(reports)
Query a specific snapshot version if needed:
graph("OrganizationGraph", "OrganizationGraph_v1")
| graph-match (alice)<-[reports*1..3]-(employee)
  where alice.name == "Alice"
  project employee = employee.name, role = employee.role
Compare transient and persistent graphs
Understanding when to use each approach helps you choose the right method for your analysis needs:
| Aspect | Transient Graphs | Persistent Graphs |
|---|---|---|
| Creation | make-graph operator during query |
.create-or-alter graph_model + .make graph_snapshot |
| Storage | In-memory during query execution | Stored in database |
| Reusability | Must rebuild for each query | Query repeatedly without rebuilding |
| Performance | Good for smaller datasets | Optimized for large, complex graphs |
| Use cases | Ad-hoc analysis, exploration | Production analytics, repeated queries |
| Memory limits | Limited by node memory | Handles larger datasets |
Clean up resources
If you don't plan to continue using the persistent graph models, delete them with the following commands:
Drop the graph model:
.drop graph_model OrganizationGraphDrop the helper functions:
.drop function Employees
.drop function Reports
The transient graphs are automatically cleaned up when the query completes, so no additional cleanup is needed for those examples.
Next steps
Now that you understand the basics of graph semantics in Kusto, advance to more complex scenarios and optimizations:
You can also explore these related articles:
- Graph operators reference - Complete guide to all available graph operators
- Graph model management - Deep dive into persistent graph models
- Graph shortest paths - Find optimal paths between entities
- Advanced graph queries - Complex analysis patterns and use cases
- Graph operators reference - Complete guide to all available graph operators
- Graph shortest paths - Find optimal paths between entities
- Advanced graph queries - Complex analysis patterns and use cases