Note
Access to this page requires authorization. You can try signing in or changing directories.
Access to this page requires authorization. You can try changing directories.
These are the latest features in the Stable release of Microsoft Edge DevTools.
View objects retained by event handlers in the Memory tool
In the Memory tool, to identify heap snapshot objects that are retained by event handlers, in the Filter dropdown list, use the new Objects retained by event handlers list item.
For example:
Go to To do app in a new tab or window.
Right-click the webpage, and then select Inspect.
DevTools opens.
Select the Memory (
 ) tool.
Click the Take snapshot button.
In the Filter dropdown list, instead of All objects, select Objects retained by event handlers:
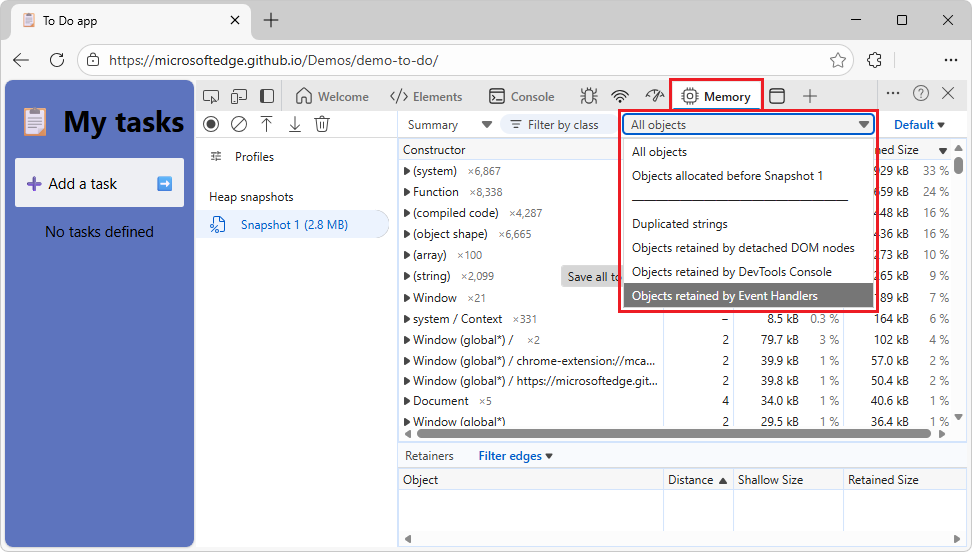
The list of objects in the table becomes shorter.
The Objects retained by event handlers filter makes it easier to debug memory leaks that are related to event listeners, such as when a component calls addEventListener, but doesn't call removeEventListener afterwards.
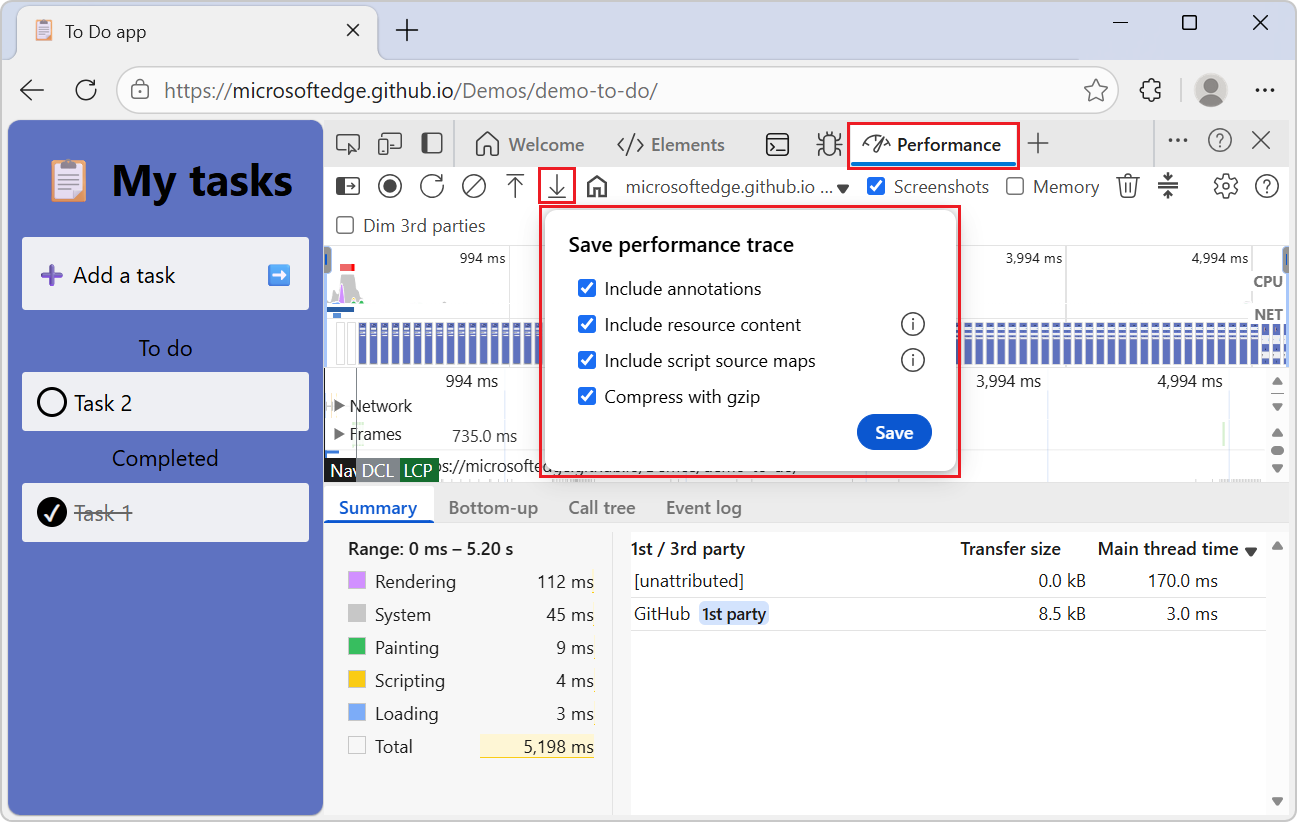
Updated performance trace export options
When you export a performance trace, you can choose to include:
- Annotations.
- Resource content (HTML, CSS, and JavaScript content).
- Script source maps.
You can also choose whether the trace file is compressed.
Exporting a trace that includes this additional data is useful when sharing traces with others for debugging.
See also:
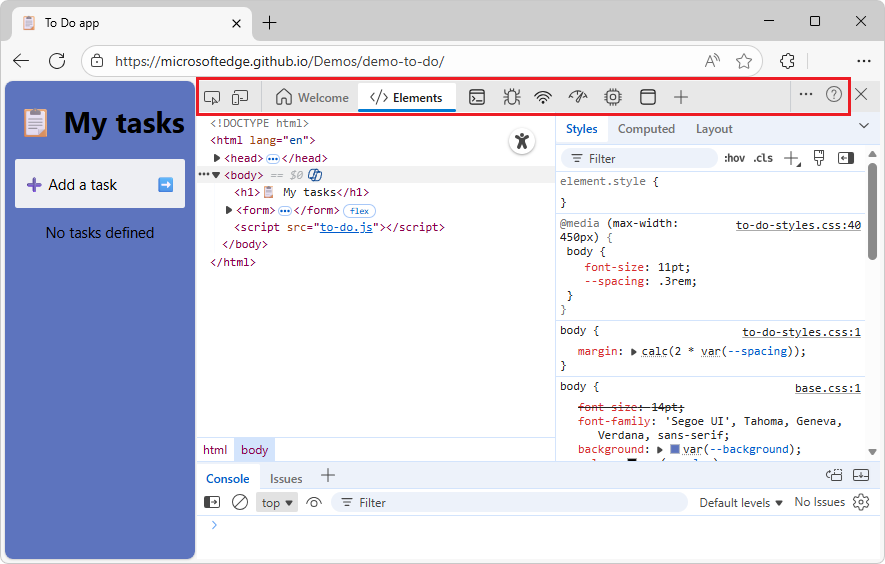
Activity Bar always displays horizontally
Upcoming change:
Starting with Microsoft Edge 144, the Activity Bar will always be displayed horizontally, at the top of the DevTools window. Displaying the Activity Bar vertically will no longer be supported.
Announcements from the Chromium project
Microsoft Edge 143 also includes the following updates from the Chromium project: