Customize a report with your own Power BI workspace
You can use your own custom Power BI workspace and leverage a higher capacity to analyze processes with a lot more data. You're also able to customize the look and feel of the report.
Set up your workspace
You need to set up your Power BI workspace to connect it to the process mining capability and then customize it. The following sections in this article walk you through how to set up your workspace.
Connect your Power BI workspace to the process mining capability
Sign in to the Azure portal.
Search for azure active directory in the search bar and select Microsoft Entra ID.
Under Manage, select Users.
Select User settings and review the App registrations selection.
- If App registrations is Yes, any user can register the process mining capability as an app.
- If App registrations is No, only admins can register apps. If you're an admin, you can choose to turn this on to allow others to register the process mining capability as an app.
On the Windows taskbar, select Search.
Type powershell, and then select Run as Administrator.
Install Azure tools
If you haven't done this yet, install the Azure tools.
On the Administrator: Windows PowerShell screen, type Install-Module AzureAD, and then select Enter.
When prompted to confirm installation, enter Y, and then select Enter.
Connect your Azure account by typing Connect-AzureAD, and then sign in.
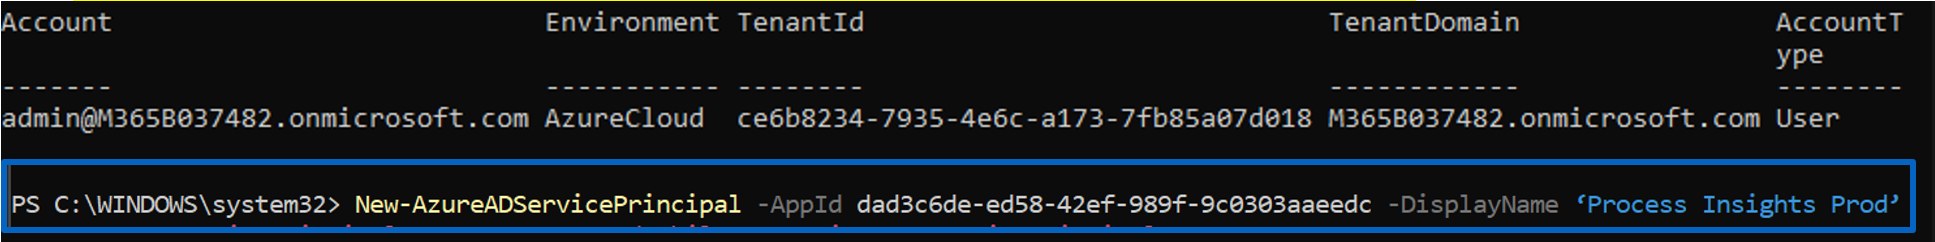
Validate that you're signed in.
Register the process mining service principal by typing this command:
New-AzureADServicePrincipal -AppId dad3c6de-ed58-42ef-989f-9c0303aaeedc -DisplayName ‘Process Insights Prod’
Sign in to Microsoft Power BI.
Select the ellipsis (...) > Settings > Admin portal.
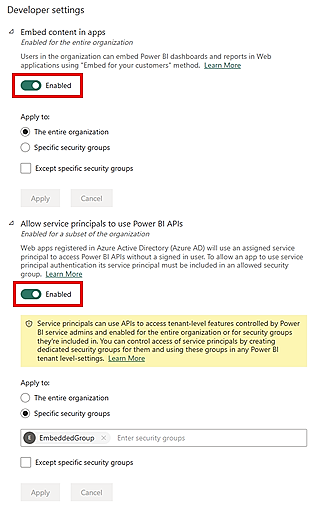
Scroll down to Developer settings and do the following steps:
- Expand the dropdown menu for Embed content in apps and enable it by toggling the slider.
- Expand the dropdown menu for Allow service principals to use Power BI APIs and enable it by toggling the slider.
Return to the Power BI home page.
Create your own custom Power BI workspace
Now that you've connected your Power BI workspace to the process mining capability and installed the Microsoft Azure tools, you can create your own custom Power BI workspace.
On the left panel, select Workspaces > Create a Workspace.
In Advanced Options, select a premium Power BI license. (We recommend a premium per capacity license.)
Select Apply.
In the created workspace, select Manage access.
Select Add people or groups.
Select Search for, and then add Process Insights Prod.
Assign it admin access.
Important
It's required that the service principal gets added as an admin. If you skip this step, the feature won't work.
Load your process analytics in Power BI
Load your process analytics in Power BI to start customizing your report.
After analyzing a process, go to the process Details page by selecting the name of the process in the breadcrumbs.
On the Details card, select Edit.
In the Power BI Workspace (optional) dropdown menu, select a workspace of your choice.
If you select a workspace, give the report a unique name in the required Report name field.
We recommend that you use a unique name. If you use a name of a report that already exists, the process mining capability overwrites the existing report of another process. This could lead to loss of custom reports and composite datasets of that process. After refreshing the process, if you decide to change the report name, you'll need to publish a new report.
You might then toggle the Update report when refreshing data option between on and off.
If the toggle is on, a new report is published in Power BI and is embedded in the analytics page of the process mining capability. If the toggle is off after refreshing the data, the existing report isn't updated in the process mining capability.
Customize reports in Power BI workspace
With the powerful integration of the process mining capability with Power BI, you can customize your process reports in an attached Power BI workspace. In this example, you perform a simple customization of the Power BI report to include a card that holds or tracks one of the analytic measures.
To be able to do this, make sure you've completed these steps in this article:
After completing these steps, return to the analytics page of your process in the process mining capability.
Refresh and reanalyze the process by selecting Refresh.
Select Open in Power BI. If you don't see this button, make sure you've completed the steps in the Load your process analytics in Power BI section in this article.
You're redirected to a Power BI web screen that shows you a report of your process.
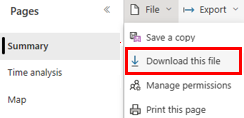
Begin customizing your report by downloading it to your local machine. To do this, select File > Download this file.
Select the A copy of your report with a live connection to data online (.pbix) radio button. The report is downloaded with live connection.
Open the downloaded report in Power BI Desktop. Ensure you have the latest Power BI Desktop version.
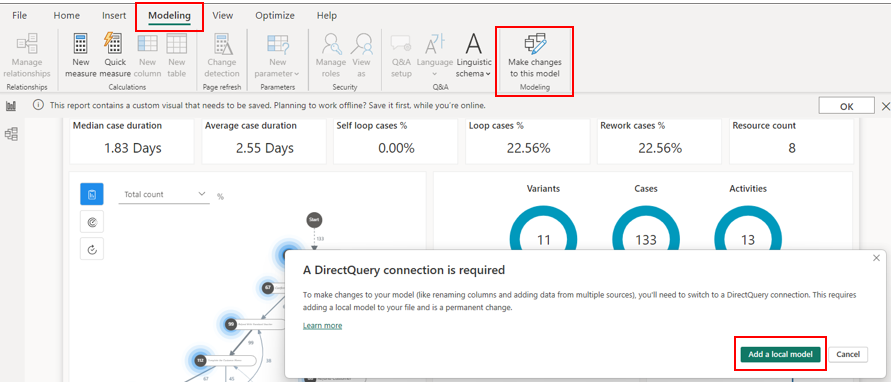
Go to the Modeling tab and select Make changes to this model. You might need to have the Contributor role to be able to see that option in the Modeling tab.
Select Add a local model.
Select the tables that you'd like to include in the local model. We recommend that you keep the default selection.
Select Submit.
The local model is created. Now you can make changes to existing visuals, or add a new data source to the report.
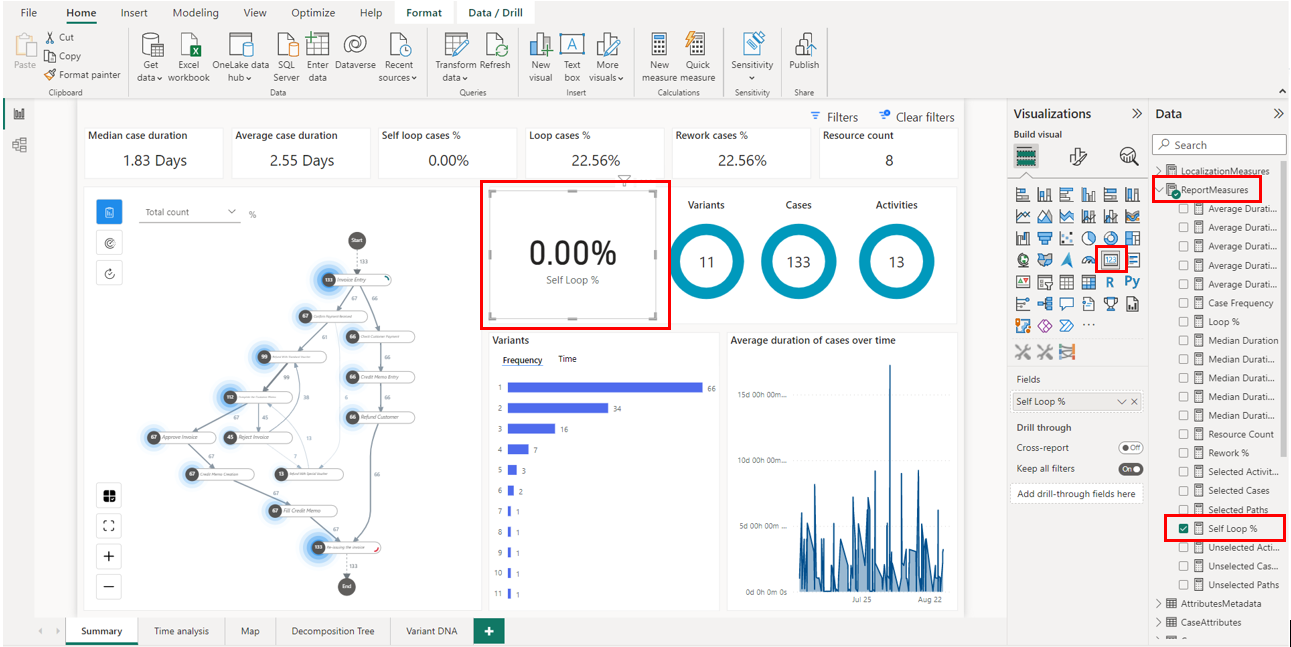
Move the cards that hold the donuts (blue circles) for the Variants, Cases, and Activities metrics to the right by selecting and dragging each card.
On the Visualizations pane, select the card element.
A new card appears. Resize it, and then drag it to the left of the Variants donut (blue circle).
On the Data pane, expand ReportMeasures and select Self Loop %.
On the command bar, select Save.
In your process, you don’t have any self loops, so you should see 0.00% in that card.
Save the report.
From the Home tab, select Publish.
Select your workspace, and choose Select to publish the report to the Power BI service.
After the report has been successfully published, you can open it from the pop-out window.
You've successfully customized your Power BI workspace. Every time you refresh your process and reopen your Power BI report, your metrics and customizations are updated. Try out Power BI and customize your reports to learn how they can help you analyze your process effectively.
Once this step is done, you see the report in your Power BI workspace with the report name that you entered. You can edit and save it. Your report is updated with the changes that you made with Power BI.
If you encounter issues or error messages, go to Issues with your own Power BI workspace.
See also
Feedback
Coming soon: Throughout 2024 we will be phasing out GitHub Issues as the feedback mechanism for content and replacing it with a new feedback system. For more information see: https://aka.ms/ContentUserFeedback.
Submit and view feedback for