See related content in the Power BI service
APPLIES TO: ![]() Power BI service for business users
Power BI service for business users ![]() Power BI service for designers & developers
Power BI service for designers & developers ![]() Power BI Desktop
Power BI Desktop ![]() Requires Pro or Premium license
Requires Pro or Premium license
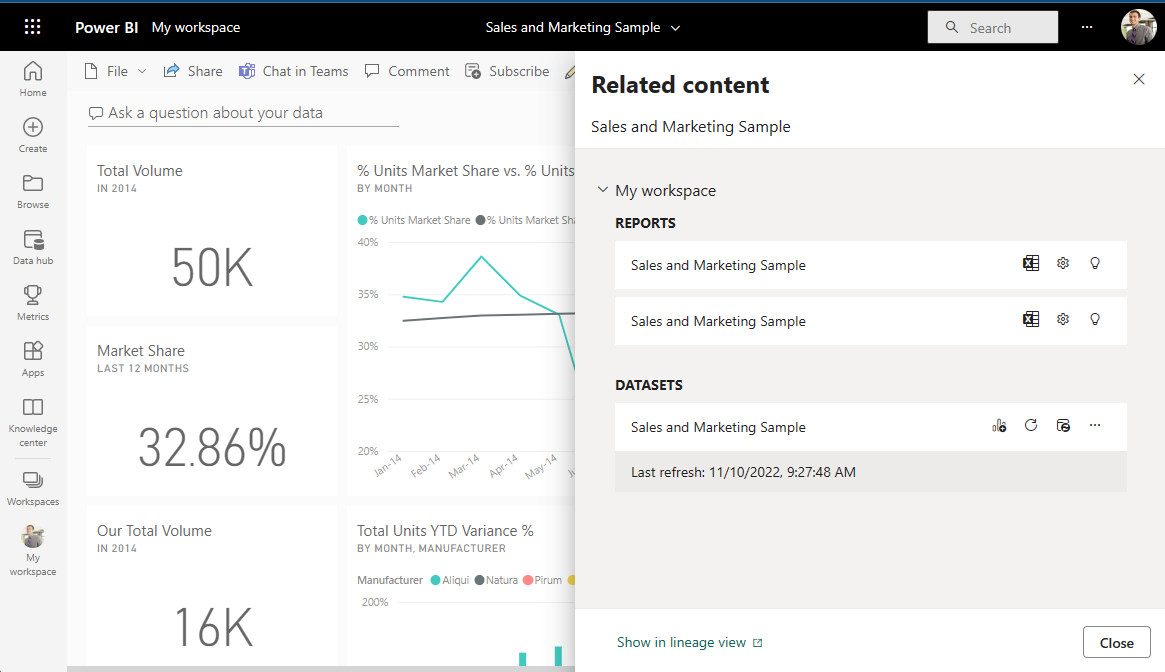
The Related content pane shows you how your Power BI service content -- dashboards, reports, and semantic models -- are interconnected. The Related content pane is also a launching pad for taking action. From here you can do things like open a dashboard, open a report, generate insights, analyze the data in Excel, and more.
In the Power BI service, reports are built on semantic models, report visuals are pinned to dashboards, and dashboard visuals link back to reports. But how do you know which dashboards are hosting visuals from your Marketing report? And how do you locate those dashboards? Is your Procurement dashboard using visuals from more than one semantic model? If so, what are they named and how can you open and edit them? Is your HR semantic model being used in any reports or dashboards at all? Or, can it be moved without causing any broken links? Questions like these can be answered on the Related content pane. Not only does the pane display the related content, it also allows you to take action on the content and easily navigate between the related content.
Note
The related content feature does not work for streaming semantic models.
See related content for a dashboard or report
In the following video, watch Will view related content for a dashboard. Then follow the step-by-step instructions after the video to try it out yourself with the Sales and Marketing Sample.
Note
This video might use earlier versions of Power BI Desktop or the Power BI service.
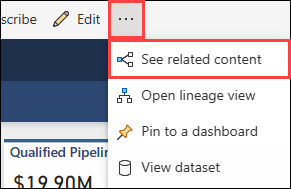
With a dashboard or report open, select More options (...) in the menu bar, and choose See related content from the dropdown.
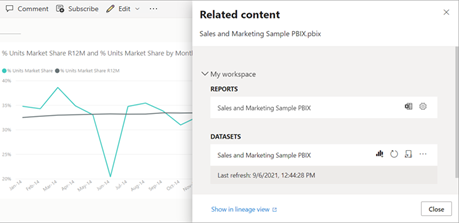
The Related content pane opens. For a dashboard, it shows all the reports that have visualizations pinned to the dashboard and their associated semantic models. For this dashboard, there are visualizations pinned from only one report and that report is based on only one semantic model. If you look at the image at the beginning of this article, you'll see related content for a dashboard that has visualizations pinned from two reports, and one semantic model.
From here, you can take direct action on the related content, depending on your permissions. For example, select a report or dashboard name to open it. For a listed report, select an icon to open and edit the settings for the report, get insights, and more. For a semantic model, review the last refresh date and time, analyze in Excel, get insights, refresh, and more.
Considerations and limitations
- If you don't see "See related", look for the icon instead
 . Select the icon to open the Related content pane.
 - To open related content for a report, you need to be in Reading view.
- The related content feature doesn't work for streaming datasets.