Exercise - Collect and analyze telemetry data
In this exercise scenario, you have been asked to collect telemetry data from the Cost Estimator application. You have decided to use Application Insights to collect and analyze the telemetry data.
Tasks
The tasks that you'll complete in this exercise are:
Add trace that will track viewed jobs.
Add trace that will track jobs from validation errors.
Objectives
The objectives of this exercise are to show you how to:
Create an Application Insights app in Azure.
Connect a canvas app to Application Insights.
Add traces to your application.
Query trace logs.
Prerequisites
Make sure that you meet the following prerequisites before beginning the exercise:
An environment with Microsoft Dataverse installed
A Microsoft Azure subscription: Azure - Sign up
Exercise 1: Import a solution
In this exercise, you'll import a solution into your environment. This solution contains a working canvas application. You'll modify it later to add tracing to certain user actions and then analyze the results.
Task: Import a solution
In this task, you'll import a solution into your environment.
You'll need to download the zip file to complete this exercise. Select download once the link opens.
Go to Power Apps maker portal and select the environment that you want to use for this lab.
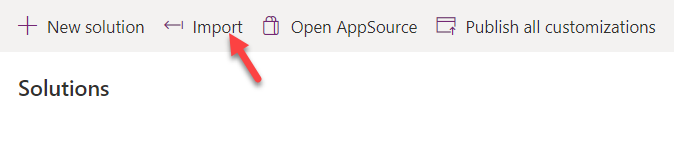
Select Solutions > Import.
Select Browse.
Select the ContosoCostEstimator_1_0_0_1.zip solution, and then select Open.
Select Next.
Select Import and then wait for the solution importing to complete.

Exercise 2: Set up the app
In this exercise, you'll set up the app for Application Insights. If you have an active Azure subscription that is associated with your lab user, follow the steps in this section. If you don't have an active Azure subscription, you'll be prompted to add it while following these steps. The free Azure subscription that is offered will be enough for you to complete this lab.
Task: Create an Application Insights app
In this task, you'll create an Application Insights app in Microsoft Azure, which requires an active Azure subscription. If you don't have an Azure subscription, you can sign up.
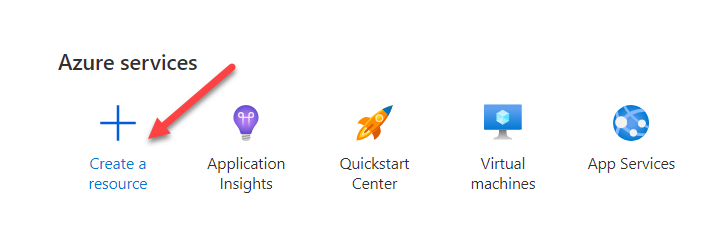
Go to the Microsoft Azure portal and select Create a resource.
Search for and select Application Insights.
Select Create.
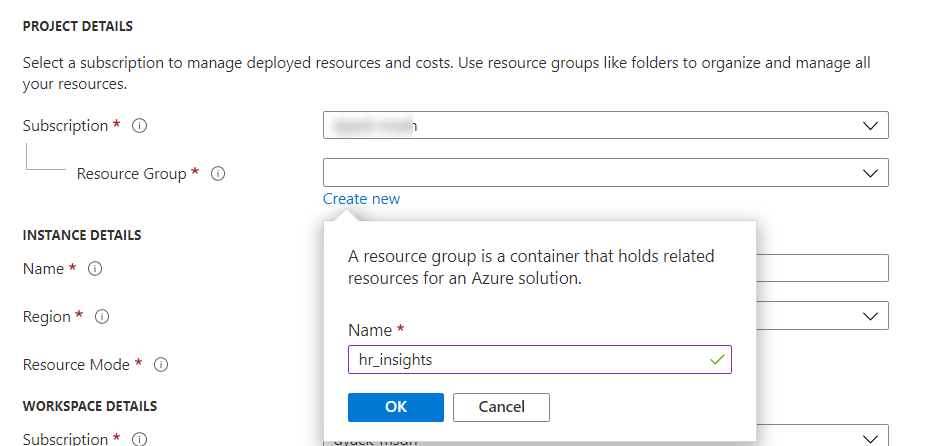
Select your subscription and then select Create new under the Resource Group dropdown list.
Enter fl_insights for Name and then select OK. Replace fl with your initials.
Enter Insights_Lab for Name, select your Region, and then select Review + create.
Select Create and then wait for the resource to be created.
Select Go to resource.
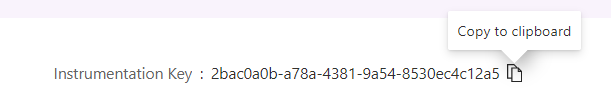
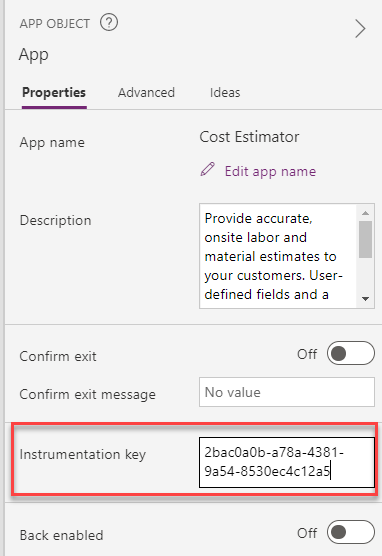
Copy the Instrumentation Key.
Go to the Power Apps maker portal and select the environment that you're using for this lab.
Select Solutions and then select to open the Contoso Cost estimator solution that you imported.
Select to open the Cost Estimator application. The application should open in app studio.
Select App, go to the Properties pane, and then paste the instrumentation key that you copied from the Instrumentation Key field.
Select the Save icon.
Select the Publish icon.
Select Publish this version and then wait for the publishing to complete.
Select the back button.
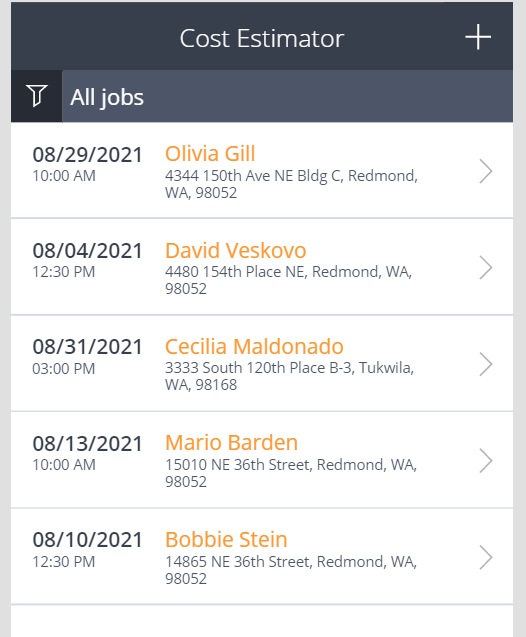
Select Play.
Make sure that the app loads the data.
Close the preview.
Don't navigate away from this page.


Exercise 3: Edit and add trace
In this exercise, you'll add trace to the application by modifying formulas that are already part of the working app from Power Apps.
Task: Add trace
In this task, you'll add trace to the application.
Expand OpenJobsPage.
Expand JobsListGallery and then select icon2.
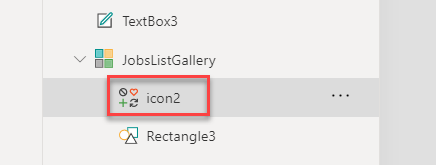
Append the OnSelect value of icon2 with the following formula. This trace will track which jobs are being viewed.
;Trace("Job Viewed",TraceSeverity.Information,{JobId:ThisItem.JobId, JobName:ThisItem.JobName})
Select NewJob page from the Tree view.
Select the Save job button.
Go to the formula bar, select OnSelect, and then expand the formula bar.
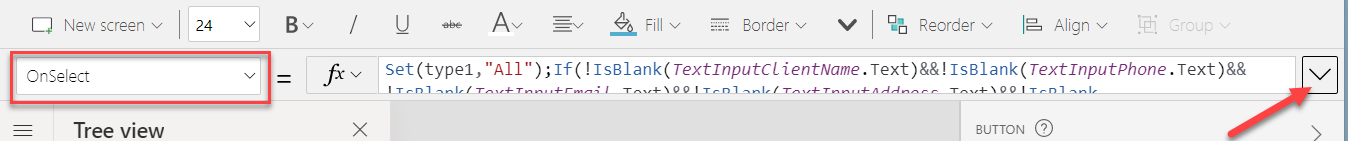
Select Format text.
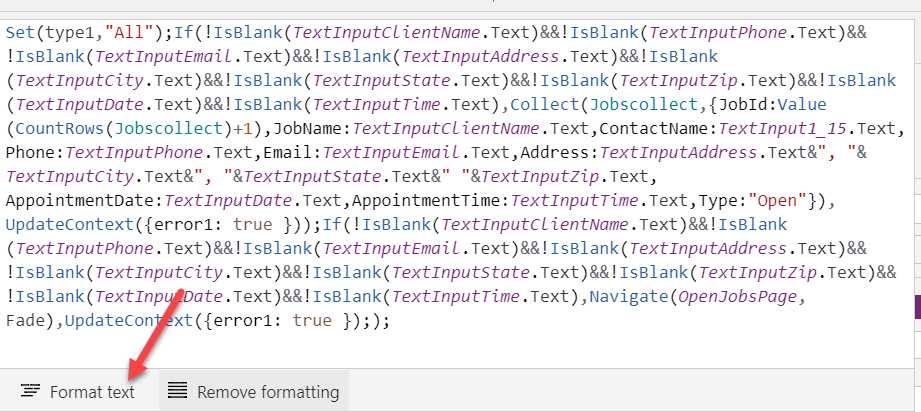
Scroll down and locate UpdateContext. Two occurrences should be shown.
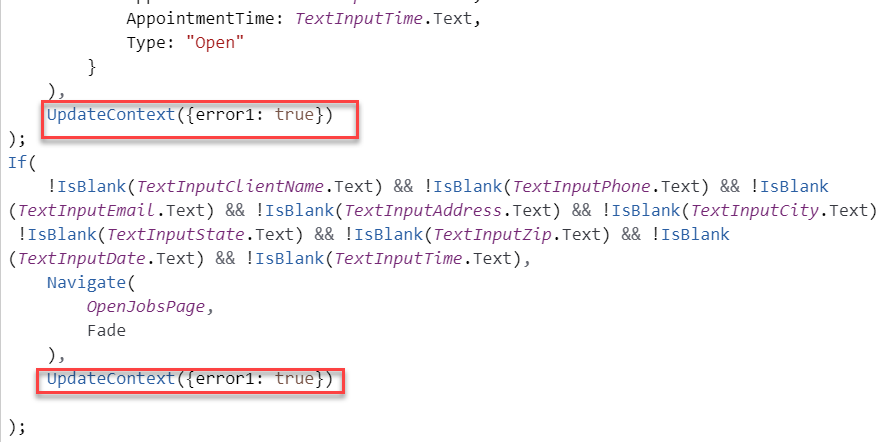
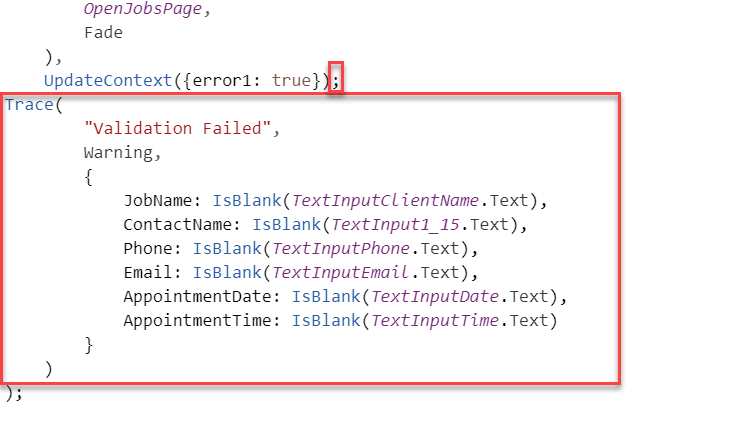
Add the following formula after the first UpdateContext occurrence.
 ;
 Trace(
         "Validation Failed",
         TraceSeverity.Warning,
         {
             JobName: IsBlank(TextInputClientName.Text),
             ContactName: IsBlank(TextInput1_15.Text),
             Phone: IsBlank(TextInputPhone.Text),
             Email: IsBlank(TextInputEmail.Text),
             AppointmentDate: IsBlank(TextInputDate.Text),
             AppointmentTime: IsBlank(TextInputTime.Text)
         }
     )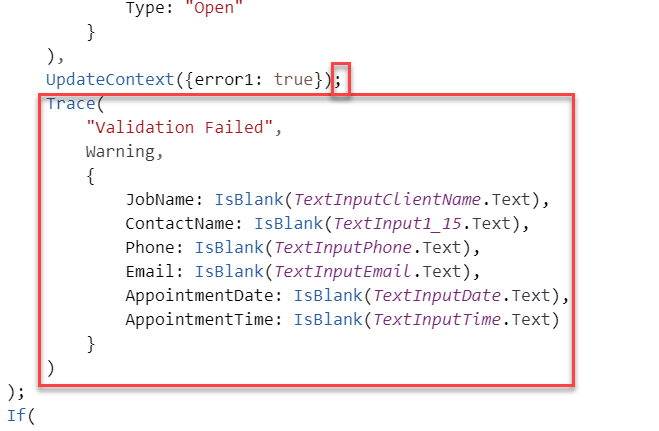
Go to the second UpdateContext occurrence and add the same formula.
Select the Save icon.
Select the Publish icon.
Select Publish this version and then wait for the publishing to complete.
Close the app studio browser window or tab.


Exercise 4: Run the published app
In this exercise, you'll run the published application, which will trigger the tracing that you added. Additionally, it will give you data to analyze in the steps that follow.
Task: Run the application
In this task, you'll run the application that you published.
Go to the Power Apps maker portal and make sure that you are in the correct environment.
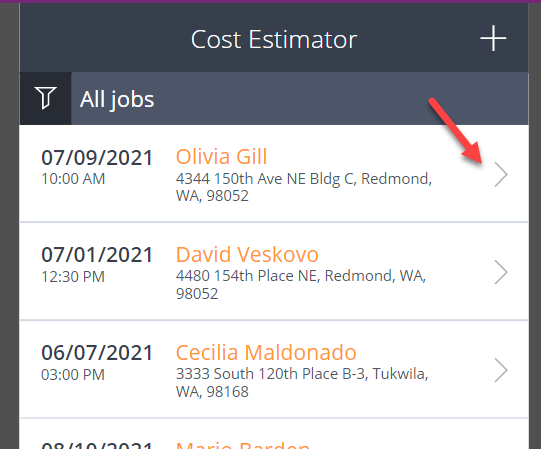
Select Apps and then select to launch the Cost Estimator application.
Select to open a job.
Select the back button.
Open another job and then select the back button again.
Open a few more jobs.
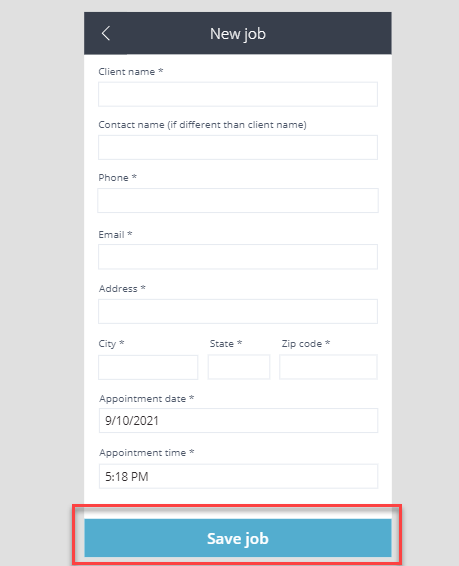
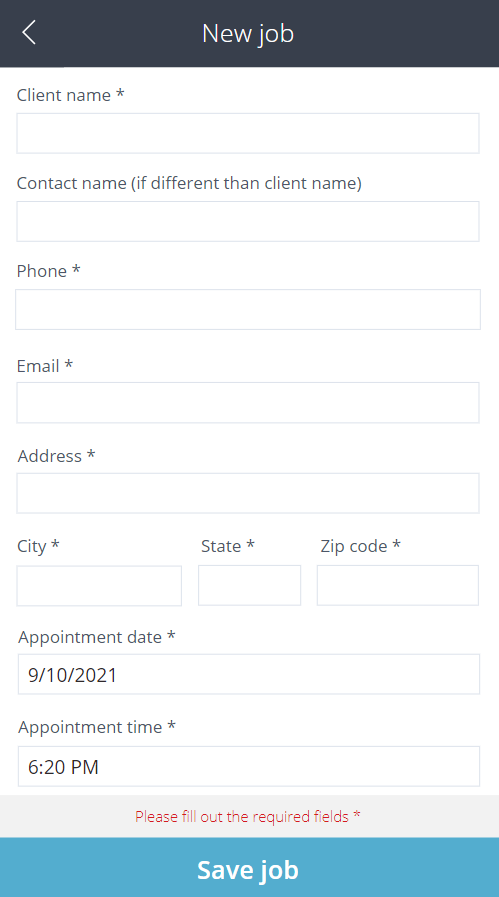
Select the plus (+) icon to add a job.
Select Save job without providing data, which will give you data to analyze where the user didn't follow the expected data entry path.
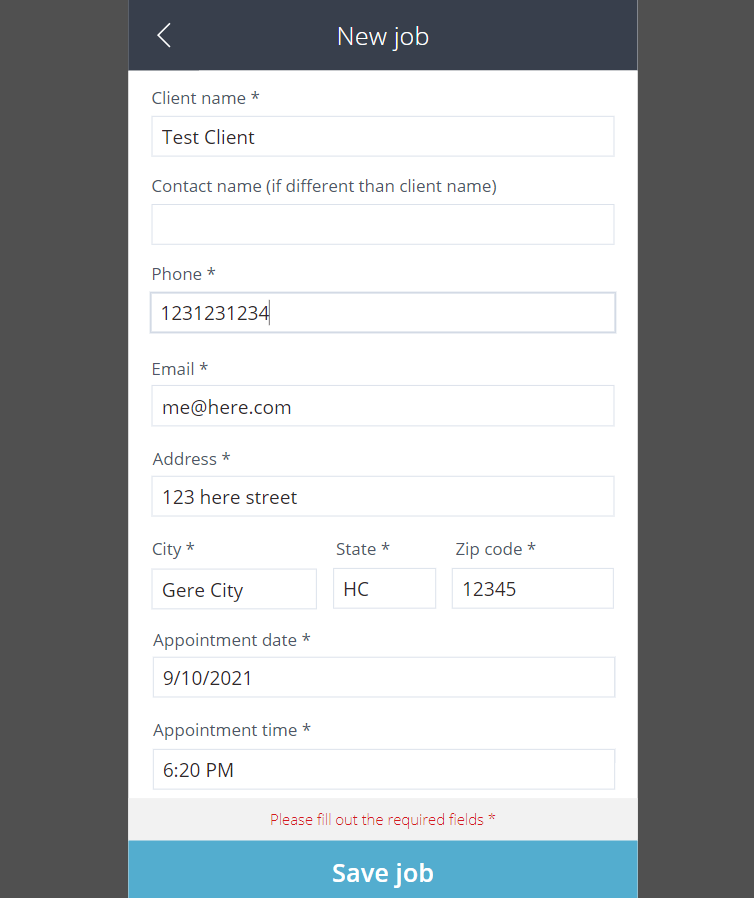
Provide a Client name and then select Save job.
Provide an Email and then select Save job.
Provide an Address and then select Save job.
Provide City and State information and then select Save job.
Provide Zip code and Phone information and then select Save job.
The job should be saved.
Create another job, but this time, provide a contact name and then leave some of the required fields empty.


Exercise 5: View Application Insights
In this exercise, you'll view Application Insights.
Task: View Application Insights
In this task, you view Application Insights.
Go to the Microsoft Azure portal and make sure that you are in the correct environment.
Select to open the Insights_Lab resource that you created.
Scroll down to the Usage section and select Users.
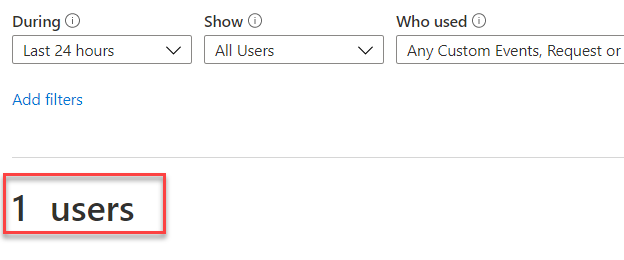
At least one user should display. If at least one user doesn't show, edit the app again, make sure that you provided the correct Instrumentation key, and then publish it again.
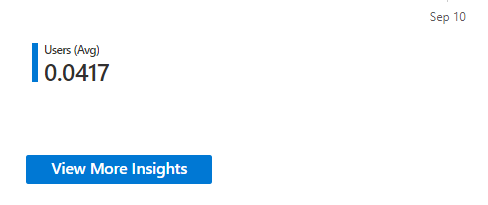
From the chart, scroll down and select View more insights in the lower left of the chart.
At least five events should show. If at least five events don't show, then return to Exercise 4 and complete it again. Wait for five minutes before continuing.
Scroll down and select View user timeline.
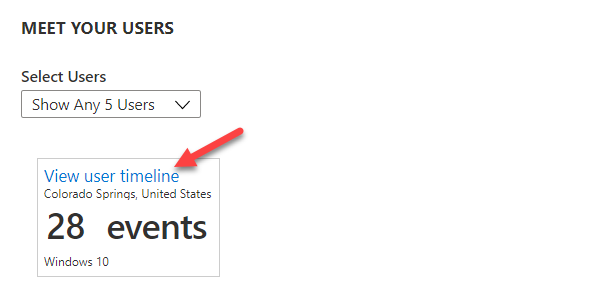
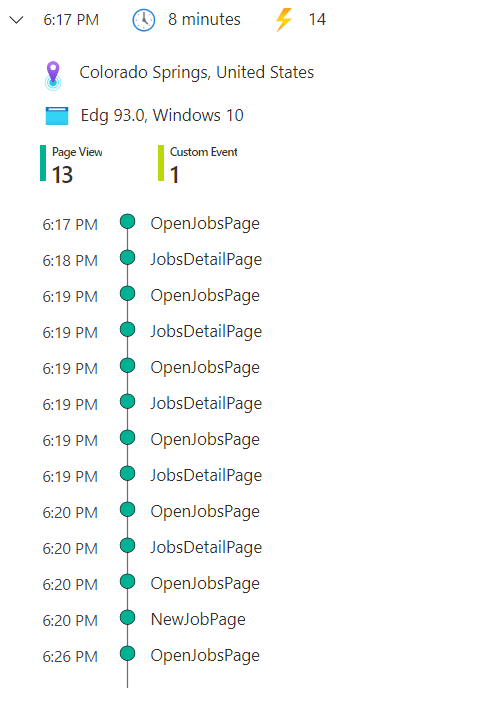
Information about the use location and events should display. Select to expand the session.
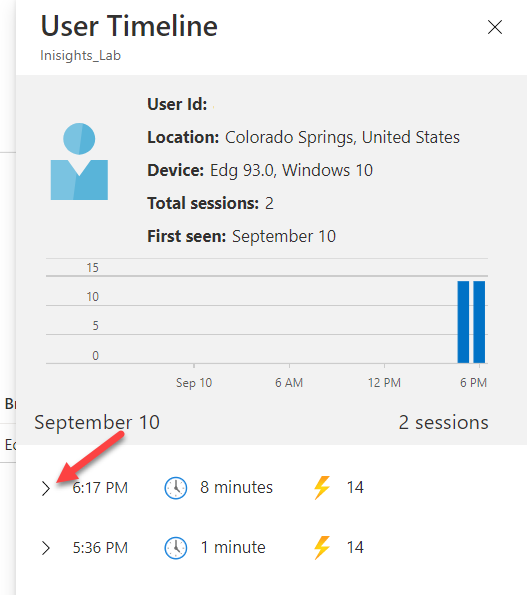
View the listed events.
Go to the Monitoring section and select Logs.
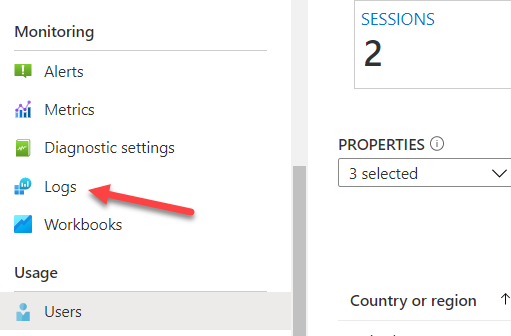
Close the Queries pop-up window.
Don't navigate away from this page.


Exercise 6: Query the logs
In this exercise, you'll query the logs.
Task: Query the logs
In this task, you'll query the logs.
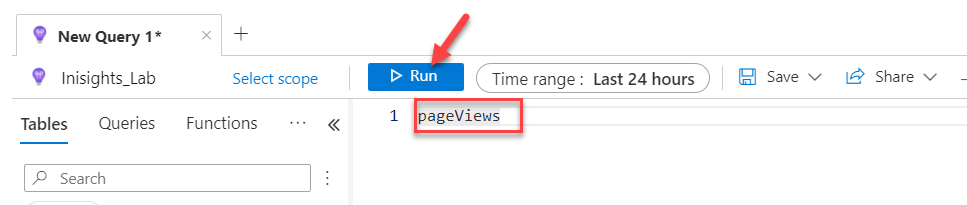
Type pageViews and then select Run.
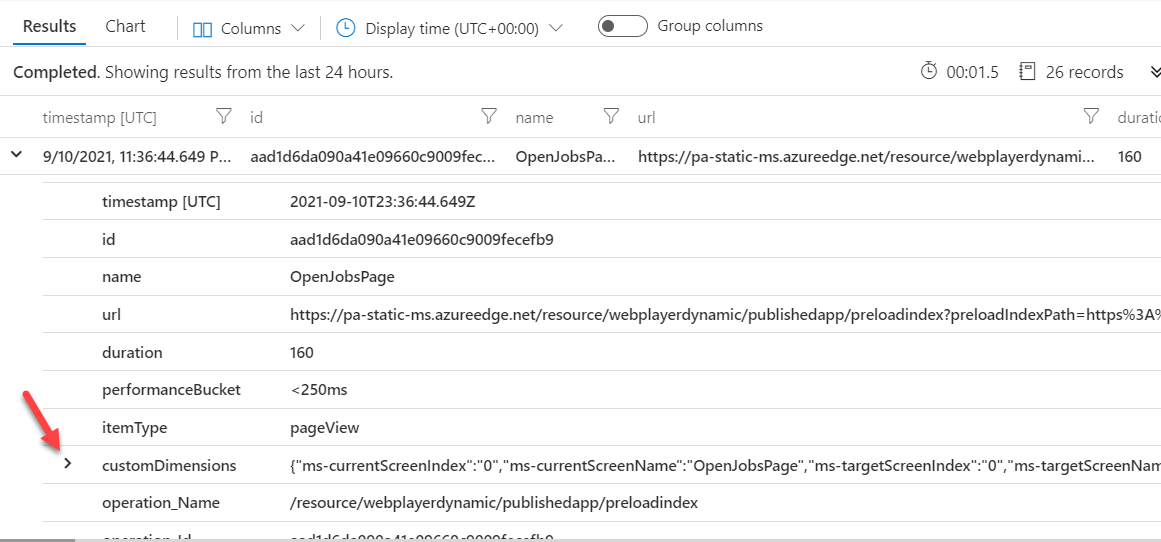
Go to the Results tab.
Traces should display. Scroll up/down and left/right to view what was traced.
Expand one of the results and then select to expand customDimensions.
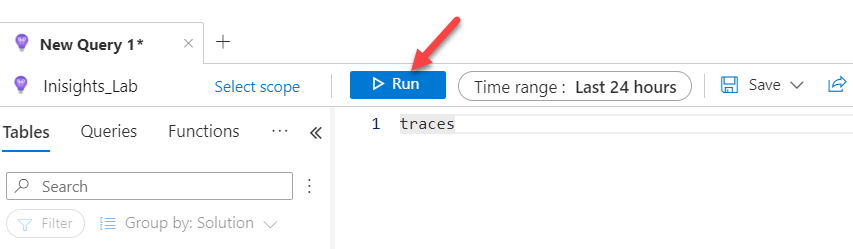
Change the query to traces and then select Run again.
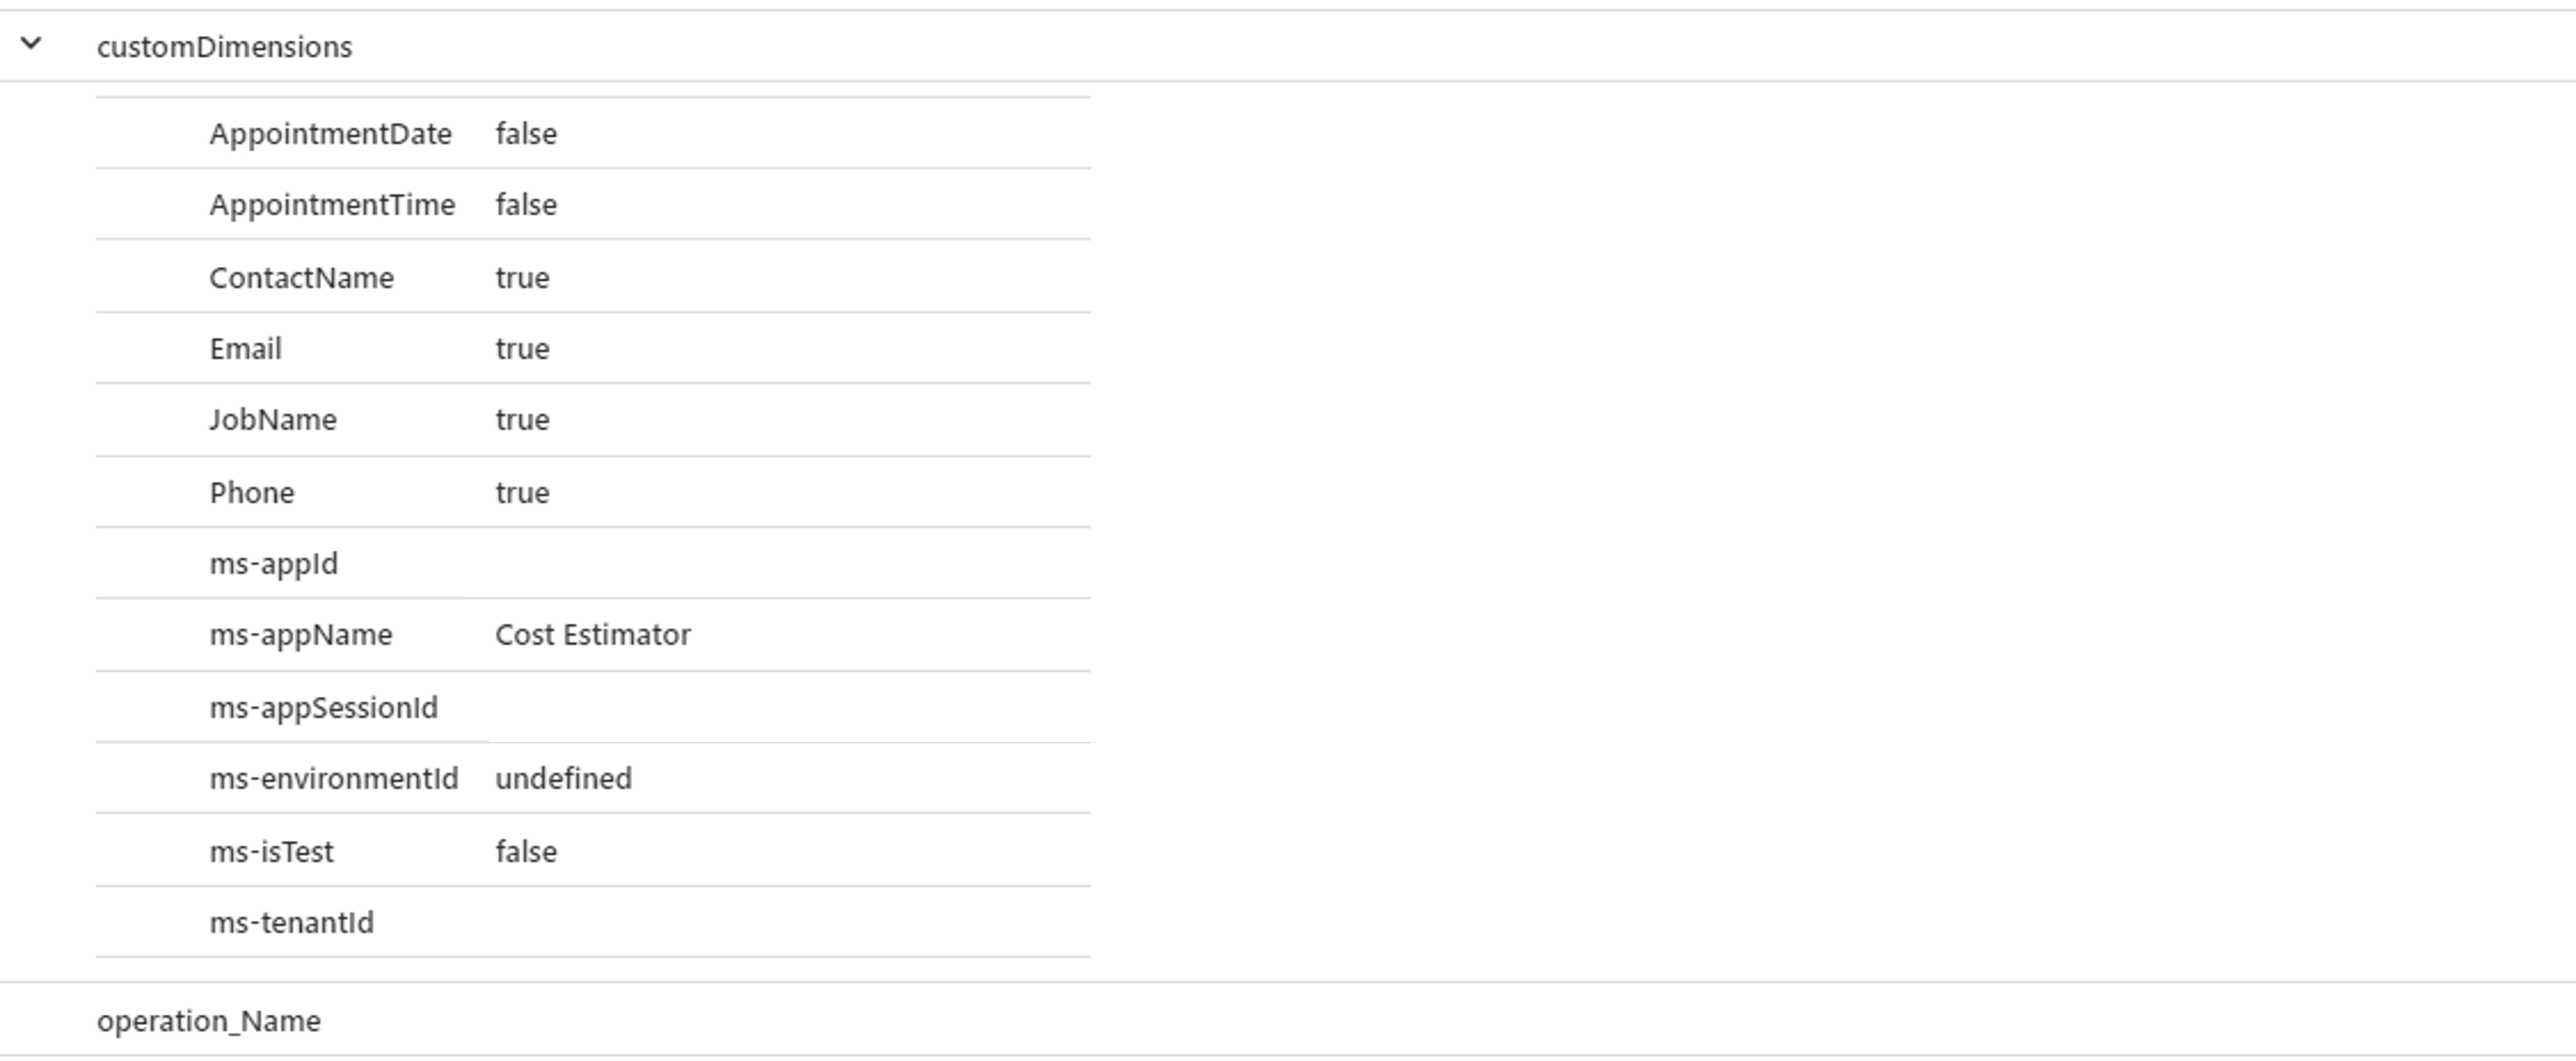
Expand one of the results and then select to expand customDimensions.
Filter for validation logs. Replace the query with the following query logic and then select Run.
 traces
 | where message =="Validation Failed"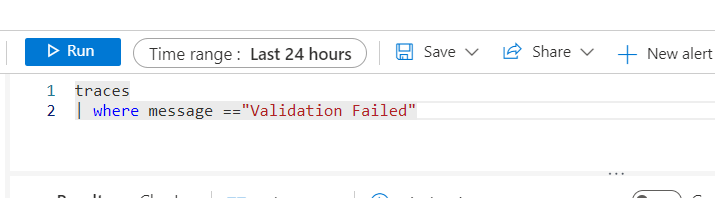
Expand one of the results and then select to expand customDimensions.
Query for jobs without a contact name. Paste the following query and then select Run.
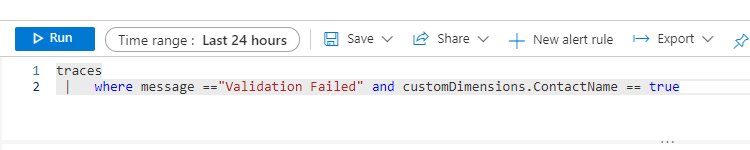
You should get traces with no contact name.


