Simplify data summary, analysis, and visual insights
This unit shows ways that Copilot in Excel can be used to aid you with data summary, analysis, and visual insights. It discusses the prerequisites of using Copilot in Excel, and steps you through common prompts that can be used to increase your productivity.
Before you start
Copilot in Excel requires that your data is formatted in a particular way. Once you configure your data either as a table, or as a supported range, Copilot can get insights, generate formulas for new columns, and highlight, sort, and filter your data.
Important
Copilot only works on files that are stored on OneDrive or SharePoint. If you can't select the Copilot button in the ribbon, try saving the file to the cloud first.
Format data as a table
You can choose either to create a table or to convert a range of cells into a table if you have a data range.
Select the cell or the range in the data.
Select Home > Format as Table.
In the Format as Table dialog box, select the checkbox next to My table as headers if you want the first row of the range to be the header row.
Select OK.
Keep data as a supported range
If you prefer to keep your data in a range and not convert it to a table, it must meet all of the following requirements:
- Only one header row
- Headers are only on columns, not on rows
- Headers are unique; no duplicate headers
- No blank headers
- Data is formatted in a consistent way
- No subtotals
- No empty rows or columns
- No merged cells
Sort, filter, and highlight key data in Excel
Copilot in Excel allows you to easily highlight, sort, and filter your tables so that key information is easy to find. Suggested prompts guide you, or you can create your own prompts to achieve a higher level of specificity in your results.
How to sort, filter, and highlight using Copilot in Excel
Open Excel.
Open a workbook stored on OneDrive or SharePoint.
Select Copilot on the ribbon to open the Copilot pane.
Highlight key data points by entering a prompt such as:
- Bold the top 10 values in the Profit column.
- Highlight the highest values in Units Sold in yellow.
- Identify and highlight any expenses that exceed the budget in this financial statement
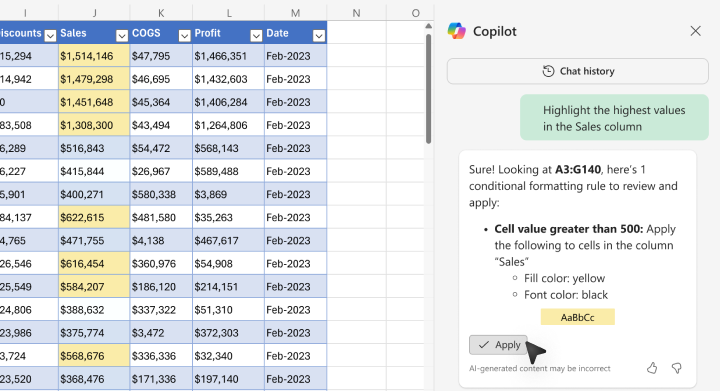
Copilot reviews your content and shows you the formatting rule to review and apply.
Select Apply.
Sort your data by entering a prompt such as:
Sort the engagement rate from smallest to largest.
Filter to show items that are due next week.
Sort the project tasks by due date, from earliest to latest.
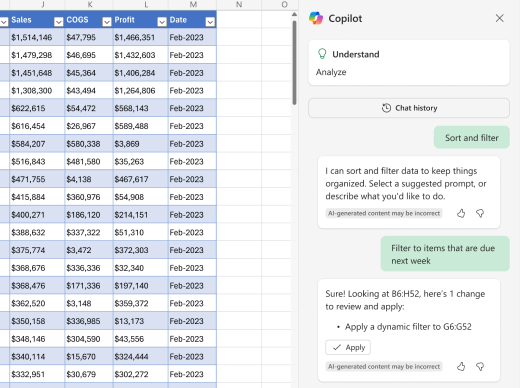
Select Apply to accept Copilot's changes.
Using Copilot in Excel to highlight and sort data makes your work easier and more efficient. It quickly spots and highlights important data points, saving you the hassle of manually going through everything. Plus, it keeps your data organized accurately, reducing the chances of mistakes. Highlighting key info helps you focus on what really matters, making it easier to make smart decisions. Sorting data in a meaningful way, like by revenue or due dates, helps you see trends and patterns clearly, which is helpful for creating reports and presentations. You can customize how you highlight and sort data to fit your needs, making your workflow smoother and your data analysis more effective.