SQL Server Reporting Services
A SQL Server technology that supports the creation, management, and delivery of both traditional, paper-oriented reports and interactive, web-based reports.
3,063 questions
This browser is no longer supported.
Upgrade to Microsoft Edge to take advantage of the latest features, security updates, and technical support.
' cx='32' cy='32' r='32' /%3E%3Ctext x='50%25' y='55%25' dominant-baseline='middle' text-anchor='middle' fill='%23FFF' %3EA%3C/text%3E%3C/svg%3E)
H!, I was trying to combine 2 Matrix report in SSRS but the out come result is not what I want. I need to header columns to be fix even there are not data for those particular dates. attached image shows what I am trying to do and the what is the out put and I am trying to get out of it. Hope someone can help me.
Same been posted in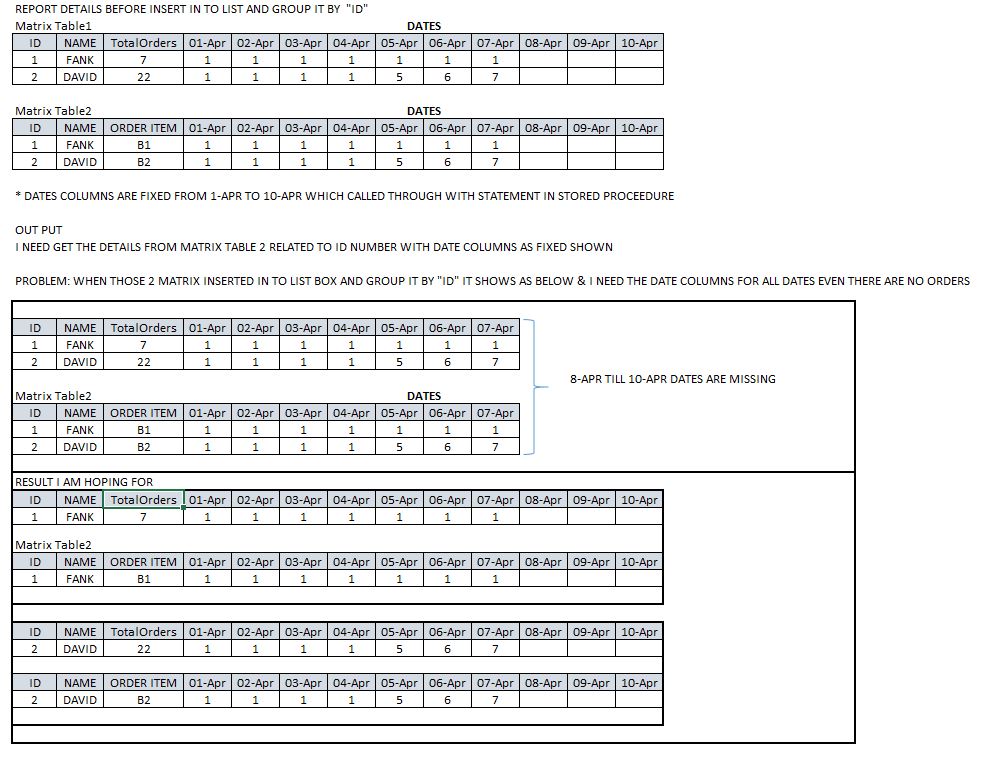
Thanks
' cx='32' cy='32' r='32' /%3E%3Ctext x='50%25' y='55%25' dominant-baseline='middle' text-anchor='middle' fill='%23FFF' %3EA%3C/text%3E%3C/svg%3E)
Hi @Arrow
Has your issue been resolved?
If you have any questions, please feel free to let me know.
If the answer is helpful, please click "Accept Answer" and upvote it.
Best regards,
Aniya
Hi @Arrow
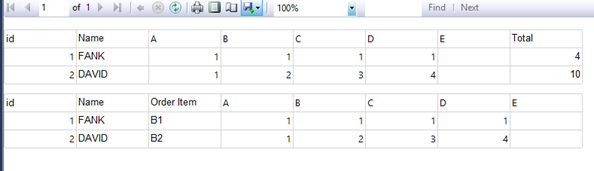
I did a test. These are the two matrices created by DataSet1.
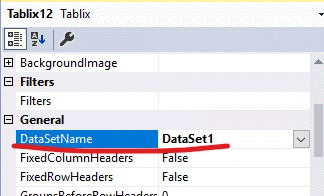
Then add a List to the report and drag and drop the two matrices into the List. Mouse click to select List to display tablix properties of list, select DataSetName as DataSet1.
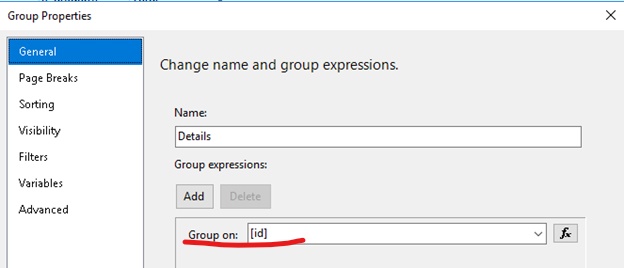
Then select List, in the row groups pane below, right-click Details to display the Details row property, and add [id] as the grouping by.
Preview:

Best regards,
Aniya
Dear Aniya,
Thank you for the reply.
Actually I am trying to get the required dates as headers using "With Statement" as below with 2 Parameters Passed
WITH PayrollMonth(PRM)AS
( SELECT CAST(@LTSFrom as DATETIME)
UNION ALL SELECT PRM + 1
FROM PayrollMonth
WHERE PRM < @LTSTo)
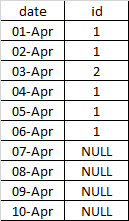
the issue is all dates will appear between 2 parameter dates but the issue is, for those dates with no data "id" column shows as "NULL" when execute the Stored Procedure. So when I group it by "id" dates are not getting displayed for those "id"s which appeared as null. Like below
Thanks again
Hi @Arrow
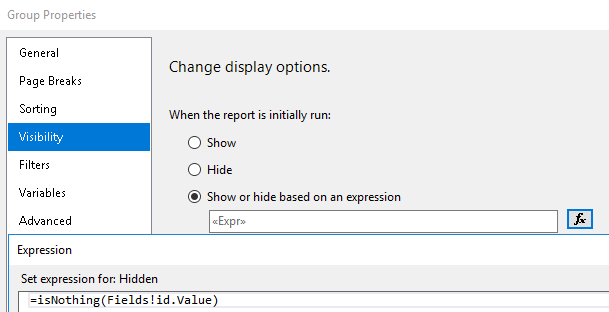
Do you mean you want to remove those data rows where the id value is NULL? Then I think you can try using the visibility property of details of the list, setting an expression to hide the data id to NULL.
I'm sorry if I misunderstood your request, but please explain in more detail what your data is and what results you want.
Best regards,
Aniya