Azure Synapse Analytics
An Azure analytics service that brings together data integration, enterprise data warehousing, and big data analytics. Previously known as Azure SQL Data Warehouse.
5,378 questions
This browser is no longer supported.
Upgrade to Microsoft Edge to take advantage of the latest features, security updates, and technical support.
' cx='32' cy='32' r='32' /%3E%3Ctext x='50%25' y='55%25' dominant-baseline='middle' text-anchor='middle' fill='%23FFF' %3EVM%3C/text%3E%3C/svg%3E)
Actly i was trying to find if there is any monitor tab which can help me to find How many notebooks are used in pipeline and with how much vcores
so basically
Pipeline name, Notebook used, vcores
something like this
' cx='32' cy='32' r='32' /%3E%3Ctext x='50%25' y='55%25' dominant-baseline='middle' text-anchor='middle' fill='%23FFF' %3EMM%3C/text%3E%3C/svg%3E)
Hello @V Mishra, Devendranath ,
We haven’t heard from you on the last response and was just checking back to see if you have a resolution yet. In case if you have any resolution please do share that same with the community as it can be helpful to others . Otherwise, will respond back with the more details and we will try to help .
Thanks
Martin
Sorry for late reply,
Actually I was looking for any report which can give me List of Pipeline names with notebook used and also how many vcores are used in it.
Hello and welcome to Microsoft Q&A anonymous user
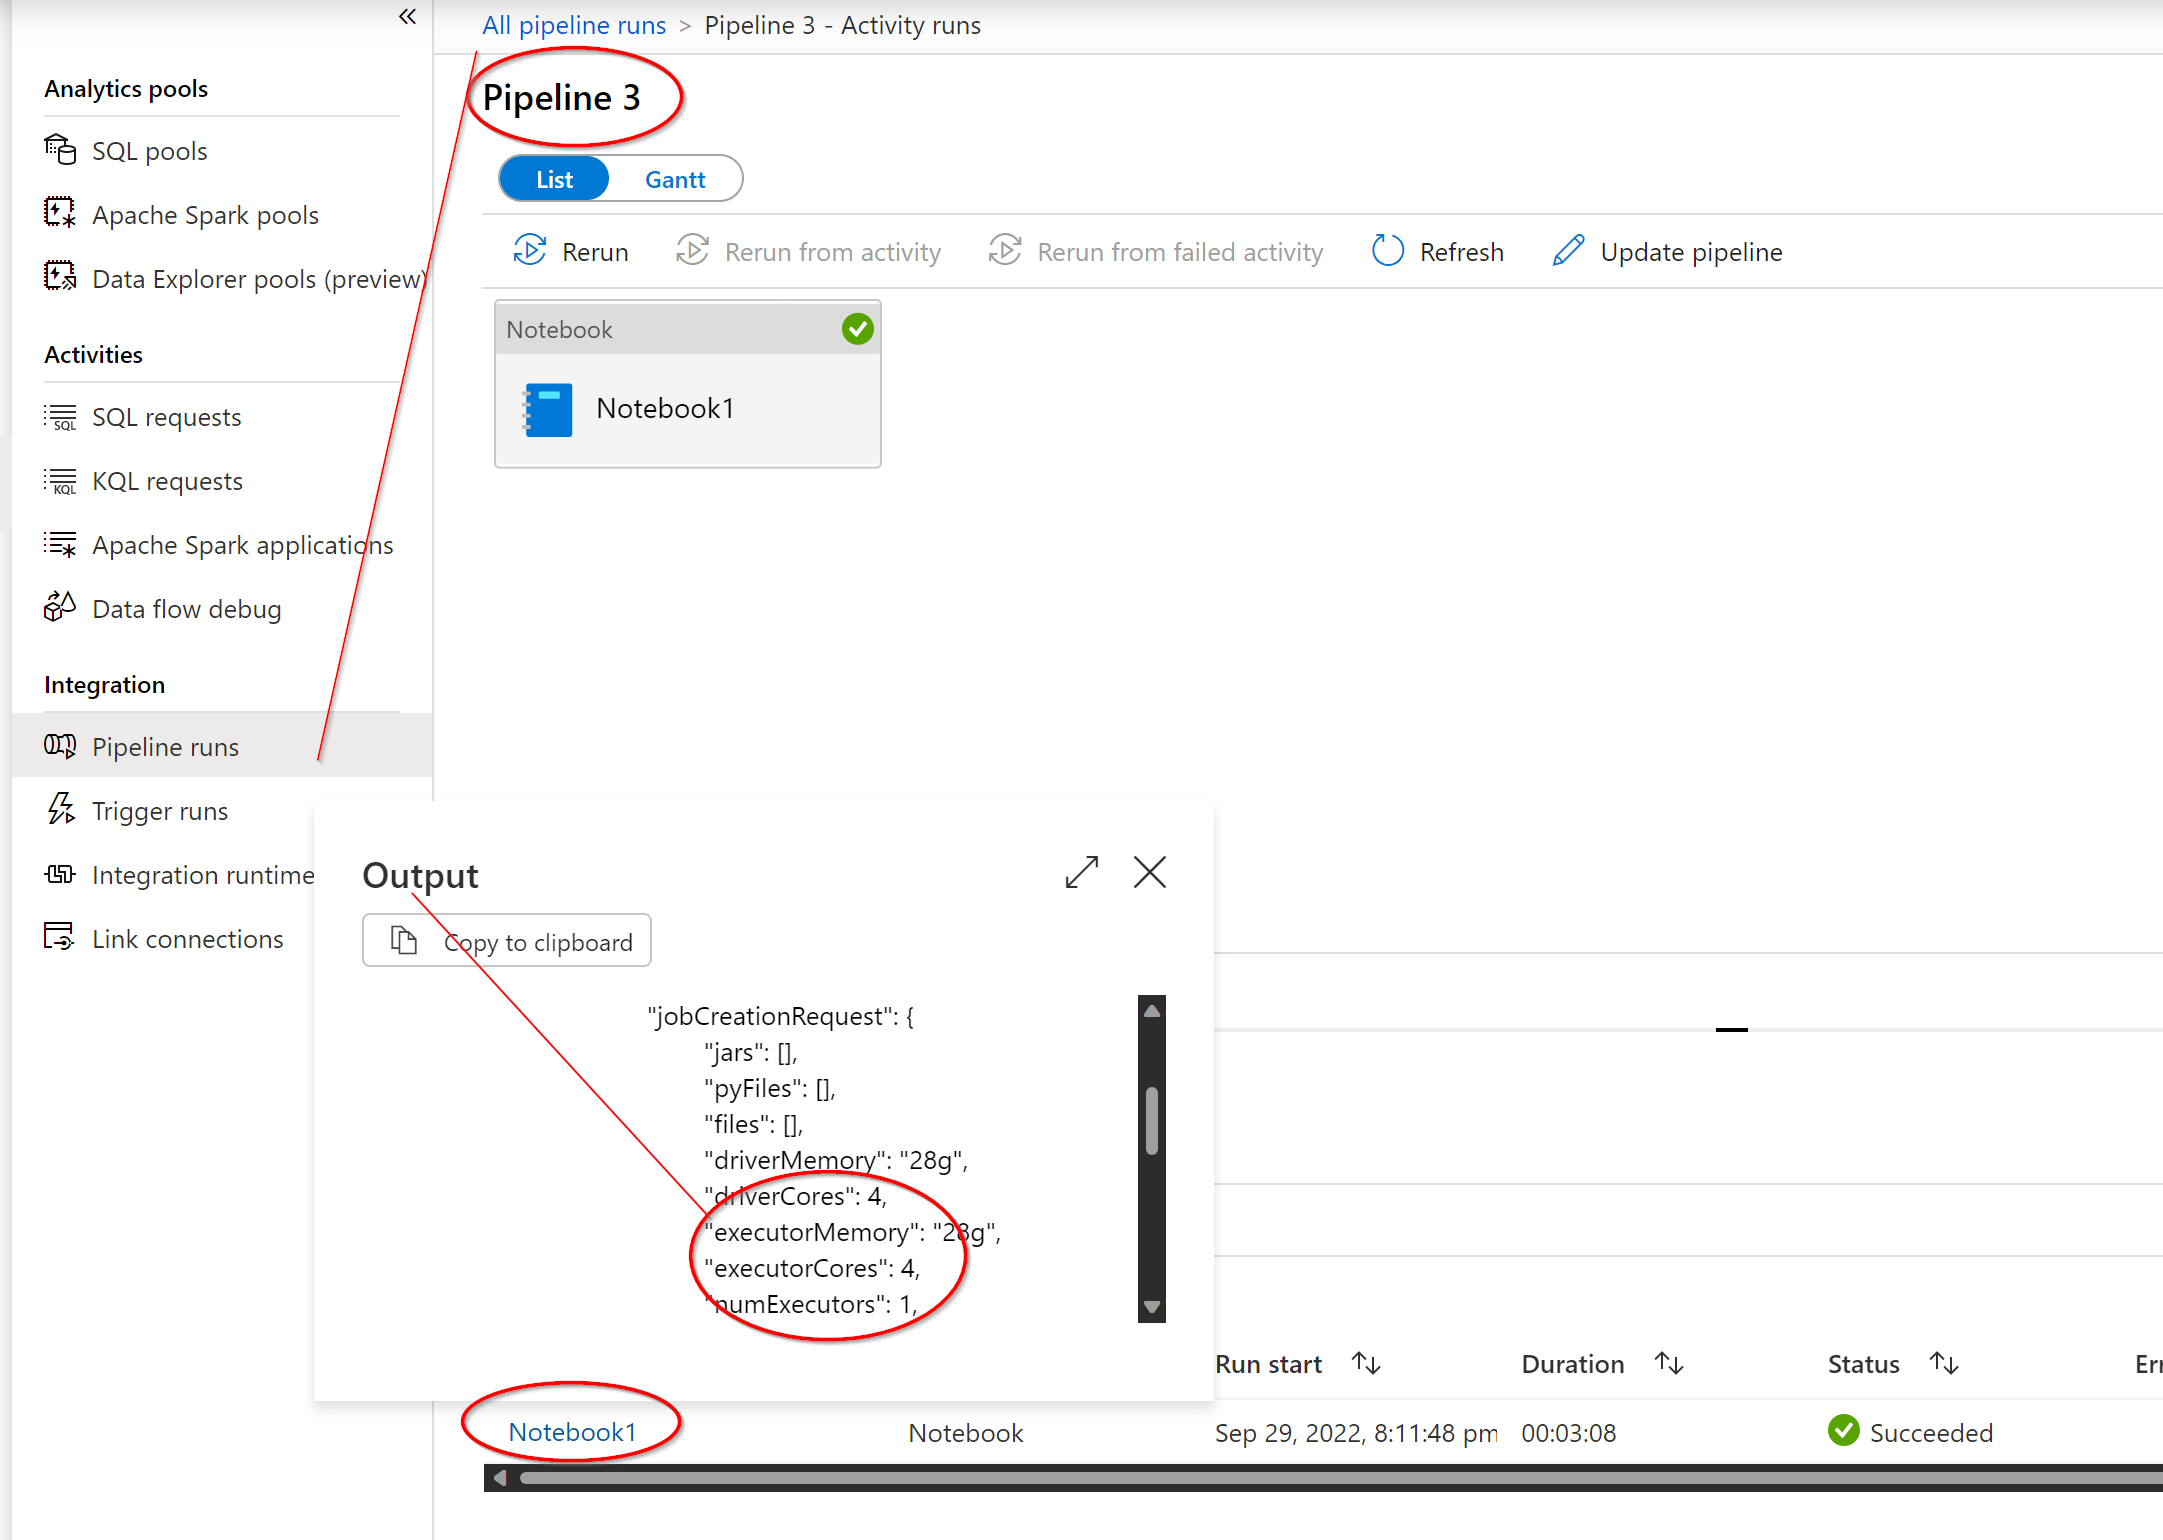
If you are asking whether the Azure Synapse Studio's monitoring tab has all those aligned and easily readable in a single display, not exactly the way you are looking for. I can find them all in one screen, but only 1 run at a time:
If you are asking about generating a report from the diagnostic logs collected by Azure Monitor, it should be possible to make a query for this. I expect it will need a couple joins.
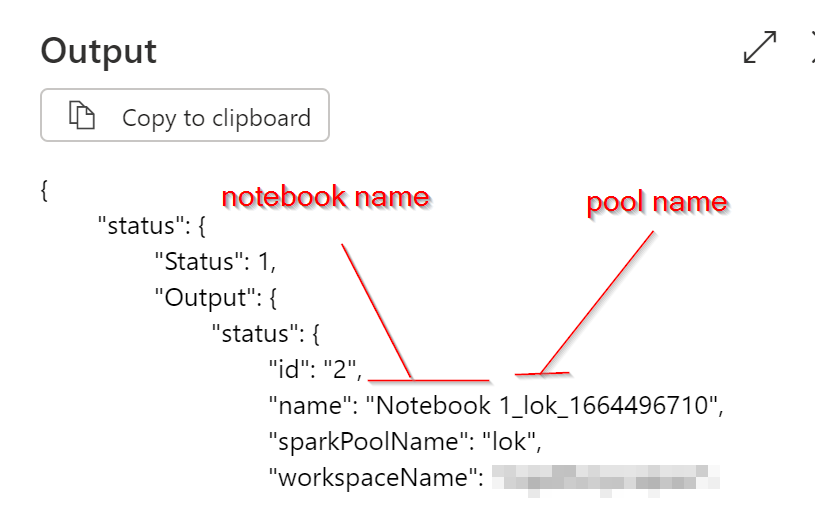
On further thought, I note that the activity output contains the notebook name as part of the name. It also contains the pool name, and the pool helps define vcore range. This name corresponds to the Application name in the monitoring "Apache Spark Application" page. However, this page doesn't include pipeline name.
Given that activity runs belong to pipeline runs, this still leaves the issue of getting all the pipelines which use spark activities.
Ideally, I'd want to start in the Spark Application page and work backwards from that, because this lists all the spark jobs. The problematic point with this, is I don't see an easy link backwards. Yes, the application id does appear in the activity output, but the activity id is not in the spark application. The "submitter" is not the pipeline run id, it is something closer to a user id.
Hmmm...