hi
Use the charts inside Visual Studio.
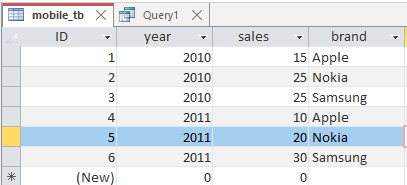
database ms access .
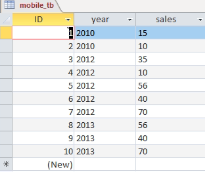
My problem now is if the years are not specified and repeated inside the years column.
And the sales column for each year gives more than one value within the year because the calculation is based on certain periods, months, or extended periods, and not on the basis of the year as a whole.
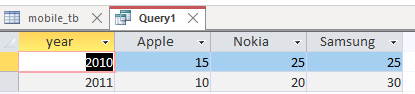
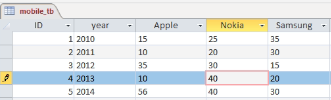
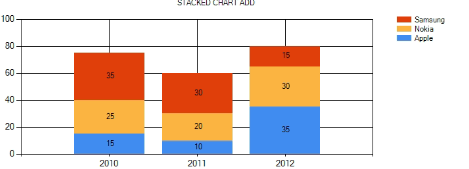
What I want is to create chart and dynamic Series,StackedColumn for the years that will not be repeated, as the years 2010-2012-2013
The addition of columns is appropriate for all sales within one year, where 2010 there are two sales, so they are visible in the column for the year 2010
. 2012 There are four sales that are displayed within the same column in a dynamic manner according to different sales
I designed this chart and it worked for me.
database
chart
code
  OleDbConnection conn = new OleDbConnection(ConfigurationManager.ConnectionStrings["Test"].ToString());
            conn.Open();
            string query = "SELECT * FROM mobile_tb ";
            OleDbCommand cmd = new OleDbCommand(query, conn);

            DataTable dt = new DataTable();
            dt.Load(cmd.ExecuteReader());
            conn.Close();


            if (dt != null && dt.Rows.Count > 0)
            {

                for (int i = 0; i < dt.Rows.Count; i++)
                {

                    chart1.Series["Apple"].Points.Add(new DataPoint(i, dt.Rows[i]["Apple"].ToString().Trim()));
                    chart1.Series["Nokia"].Points.Add(new DataPoint(i, dt.Rows[i]["Nokia"].ToString().Trim()));
                    chart1.Series["Samsung"].Points.Add(new DataPoint(i, dt.Rows[i]["Samsung"].ToString().Trim()));
                    chart1.Series[0].Points[i].AxisLabel = dt.Rows[i]["year"].ToString().Trim();

                }

            }
my
' cx='32' cy='32' r='32' /%3E%3Ctext x='50%25' y='55%25' dominant-baseline='middle' text-anchor='middle' fill='%23FFF' %3EAS%3C/text%3E%3C/svg%3E)
' cx='32' cy='32' r='32' /%3E%3Ctext x='50%25' y='55%25' dominant-baseline='middle' text-anchor='middle' fill='%23FFF' %3EA%3C/text%3E%3C/svg%3E)