how to attach debugger to node.js inspector with visualstudio 2019 as in visual studio code with launch.js ?

jan jansen 1 Reputation point
2020-08-24T09:42:38.703+00:00

i want to debug a node application on a iot device homey, i can attach the debugger to chrome inspector in visual studio code with launch.js but how is that done in vs 2019. you can attach to a process but which is it ? thera a numerous chrome processes on mu computer.

Visual Studio Debugging
Visual Studio: A family of Microsoft suites of integrated development tools for building applications for Windows, the web and mobile devices.Debugging: The act or process of detecting, locating, and correcting logical or syntactical errors in a program or malfunctions in hardware. In hardware contexts, the term troubleshoot is the term more frequently used, especially if the problem is major.
1,002 questions
{count} votes

1 answer

Sort by: Most helpful
  1. Dylan Zhu-MSFT 6,421 Reputation points
    2020-08-25T03:31:30.517+00:00

    Hi janjansen-4378,

    The list of attached processes is from the windows task manager. You could check them under "Detials".
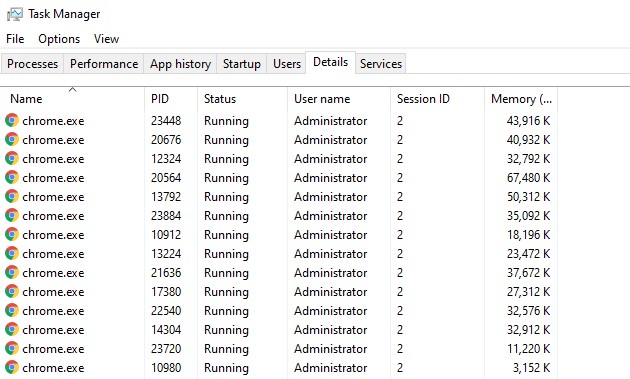
    19967-annotation-2020-08-25-1031624.jpg

    To distinguish them, you could add other columns to get more details.
    20052-annotation-2020-08-25-10316242.jpg

    Generally, we would select the browser instance with title to debug in visual studio, which is like this:
    20082-annotation-2020-08-25-103162242.jpg

    By the way, since the workarounds about debugging node.js are different in visual studio and visual studio code. We suggest you could read this document: Debug a JavaScript or TypeScript app in Visual Studio, which can help you debug node.js project in visual studio.

    Best Regards,
    Dylan

    0 comments No comments

Your answer

Answers can be marked as Accepted Answers by the question author, which helps users to know the answer solved the author's problem.