Hi @Hema Ramachandran ,
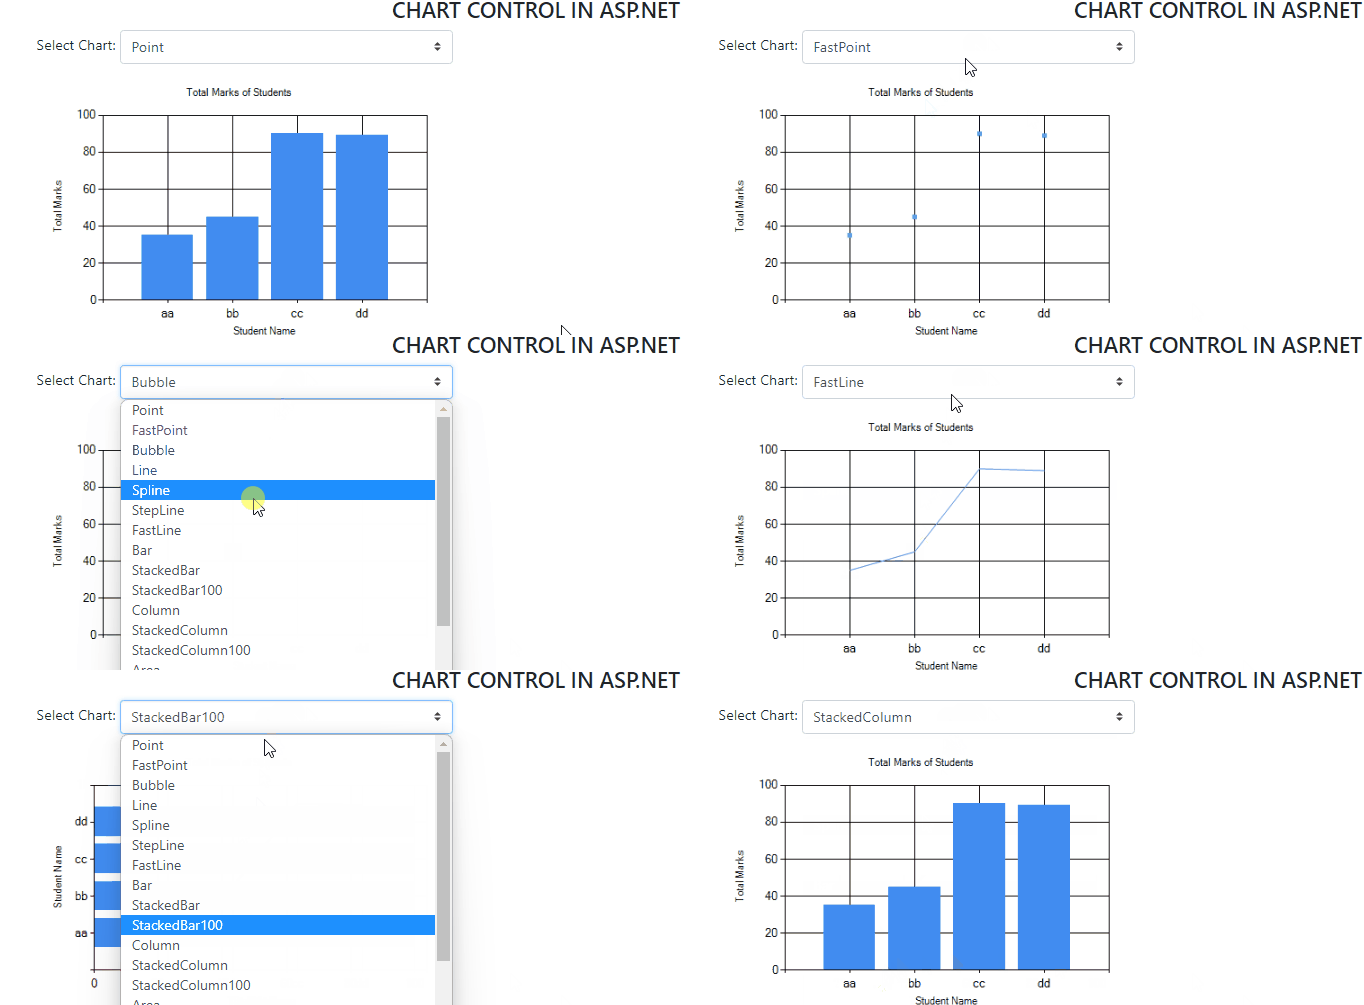
I checked your code and your description, I think you should want the effect of the following example, I added a comment to the code, I hope it can help you understand better.
Double click on webconfig file and database connect. Write the following line of code.
<connectionStrings>
  <add name="DBCS" connectionString="***"/>
</connectionStrings>
Create database table:
CREATE TABLE [dbo].[StudentMarks](
    [ID] [int] IDENTITY(1,1) NOT NULL,
    [StudentName] [nvarchar](50) NULL,
    [TotalMarks] [int] NULL,
 CONSTRAINT [PK_StudentMarks] PRIMARY KEY CLUSTERED
(
    [ID] ASC
)WITH (PAD_INDEX = OFF, STATISTICS_NORECOMPUTE = OFF, IGNORE_DUP_KEY = OFF, ALLOW_ROW_LOCKS = ON, ALLOW_PAGE_LOCKS = ON) ON [PRIMARY]
) ON [PRIMARY]

GO
CREATE PROCEDURE spGetStudentMarks
AS
BEGIN
SELECT StudentName,TotalMarks from [dbo].[StudentMarks]
END
front code
   <div class="container py-4">
                <h4 class="text-uppercase text-center">Chart Control in asp.net</h4>
                <div class="form-group">
                    <label>Select Chart:</label>
                    <asp:DropDownList ID="ddlChart" AutoPostBack="true" runat="server" CssClass="custom-select col-md-4" OnSelectedIndexChanged="ddlChart_SelectedIndexChanged"></asp:DropDownList>
                </div>
                <asp:Chart ID="Chart1" runat="server" Width="450">
                    <Titles>
                        <asp:Title Text="Total Marks of Students"></asp:Title>
                    </Titles>
                    <Series>
                        <asp:Series Name="Series1" ChartArea="ChartArea1"></asp:Series>
                    </Series>
                    <ChartAreas>
                        <asp:ChartArea Name="ChartArea1">
                            <AxisX Title="Student Name"></AxisX>
                            <AxisY Title="Total Marks"></AxisY>
                        </asp:ChartArea>
                    </ChartAreas>
                </asp:Chart>
            </div>
code behind
Imports System.Data.SqlClient
Imports System.Web.UI.DataVisualization.Charting

Public Class WebForm2
    Inherits System.Web.UI.Page

    Protected Sub Page_Load(ByVal sender As Object, ByVal e As System.EventArgs) Handles Me.Load
        If Not IsPostBack Then
            GetChartData()
            GetChartTypes()
        End If
    End Sub
    Private Sub GetChartTypes()
        For Each chartType As Integer In [Enum].GetValues(GetType(SeriesChartType))
            Dim li As ListItem = New ListItem([Enum].GetName(GetType(SeriesChartType), chartType), chartType.ToString())
            ddlChart.Items.Add(li)
        Next
    End Sub
    Private Sub GetChartData()
        Dim CS As String = ConfigurationManager.ConnectionStrings("DBCS").ConnectionString

        Using con As SqlConnection = New SqlConnection(CS)
            Dim cmd As SqlCommand = New SqlCommand("spGetStudentMarks", con)
            cmd.CommandType = CommandType.StoredProcedure
            con.Open()
            Dim rdr As SqlDataReader = cmd.ExecuteReader()
            'Retrieve the Series to which we want to add DataPoints
            Dim series As Series = Chart1.Series("Series1")
            'Loop thru each Student record
            While rdr.Read()
                'Add X And Y values using AddXY() method
                series.Points.AddXY(rdr("StudentName").ToString(), rdr("TotalMarks"))
            End While
        End Using
    End Sub
    Protected Sub ddlChart_SelectedIndexChanged(ByVal sender As Object, ByVal e As EventArgs)
        'Call Get ChartData() method when the user select a different chart type
        GetChartData()
        Me.Chart1.Series("Series1").ChartType = CType([Enum].Parse(GetType(SeriesChartType), ddlChart.SelectedValue), SeriesChartType)
    End Sub
End Class

Best regards,
Lan Huang
If the answer is the right solution, please click "Accept Answer" and kindly upvote it. If you have extra questions about this answer, please click "Comment".
Note: Please follow the steps in our documentation to enable e-mail notifications if you want to receive the related email notification for this thread.