How to Capture a WinRM Trace
When working with Microsoft Support you may be asked to capture traces to assist with issue resolution. Below are two methods for capturing WinRM traces. Following a reboot these will need to be set up again. The GUI setup is simple. The logman method allows a template with pre-populated settings to be imported. Choose the method that suits you.
Method 1 using GUI
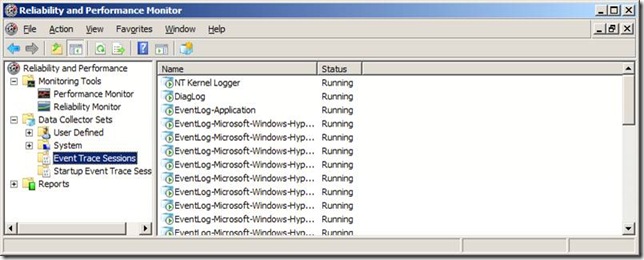
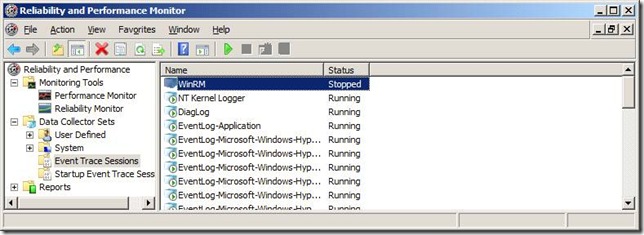
1. Open Perfmon and navigate to Event Trace Sessions. In your case you will run this from a non-core box and connect to the core box first.
2. Right click Event Trace Sessions and choose New Data Collector Set.
3. Name it WinRM, select “Create manually” and click Next
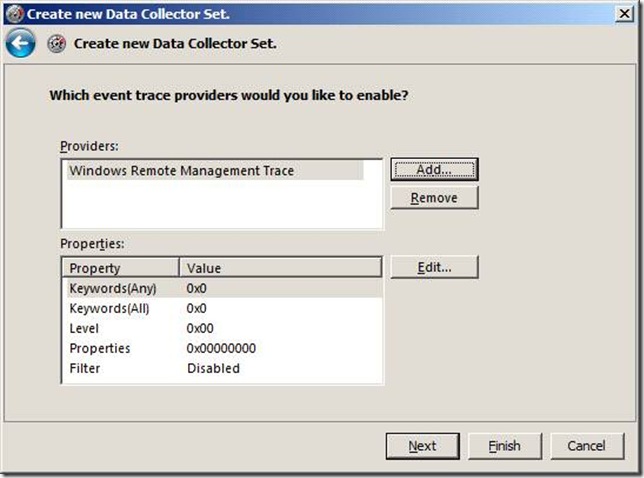
4. Click “Add” when prompted “Which event trace providers would you like to enable?”
5. Select “Windows Remote Management Trace”.
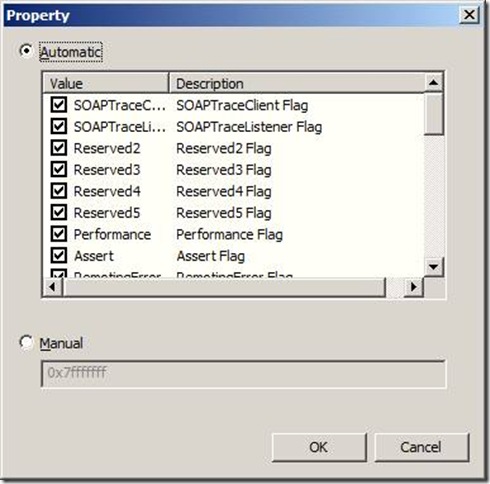
6. Select the Keywords(Any) Property and choose edit.
7. Add the desired values. I selected all of them and clicked OK.
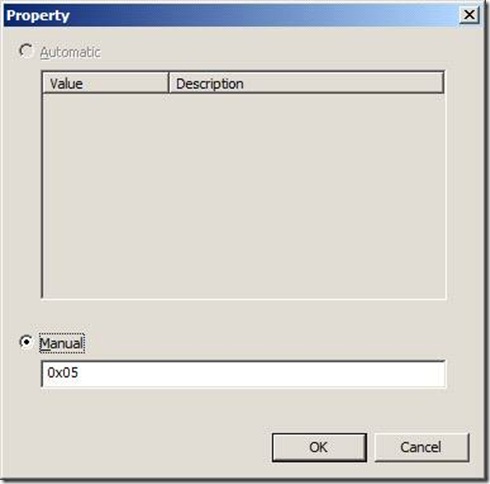
8. Select Level and then Edit.
9. Select the Manual option, change the value to 0x05, and click OK.
10. Click Next.
11. Change the Root Directory to the destination location for the trace log.
12. Click Finish (Repeat process for both client and server)
13. Start the trace by selecting WinRM and choosing Start (on client and server)
14. Reproduce the issue.
15. Stop the trace by selecting WinRM and choosing stop for both systems.
16. You will have a winrm.etl file in the location that was set in step 11.
Method 2 using LOGMAN
1. Rename the attached WinRMETL.txt file to WinRMETL.xml
2. Create a folder called “winrm” on the root of the C drive of the node that is having the Winrm problem, node 2 for example.
3. Copy the xml file to that folder and change into that folder
4. Enter “logman /import –n mytrace –xml c:\winrm\WinRMETL.xml” and press enter.
5. Enter “logman” and press enter and should see the “mytrace” as a Data Collector Set”
6. Repeat this for the client from where you will run the Winrm command.
7. On both systems Enter “logman start mytrace” to start the tracing.
8. On the client system enter the “winrm id -r:<targetname>
9. Stop trace by entering “logman stop mytrace” on both systems.
10. There will be a file created called winRM2.etl in the C:\winrm directory.
Comments
Anonymous
January 01, 2003
Can i use this to see the raw xml request and response SOAP messages sent by winrm?Anonymous
January 01, 2003
thank youAnonymous
January 01, 2003
How to get the WinRMETL.txt file.. its not attached. Also, what tool do i use to view the log file generated? I found some reference to MSSLogToText.exe, but could not find a link to download it.
