LiveKd for Virtual Machine Debugging
When Dave Solomon and I were writing the 3rd edition of the Windows Internals book series Inside Windows 2000 back in 1999, we pondered if there was a way to enable kernel debuggers like Windbg and Kd (part of the free Debugging Tools for Windows package that’s available in the Windows Platform SDK) to provide a local interactive view of a running system. Dave had introduced kernel debugger experiments in the 2nd edition, Inside Windows NT, that solidified the concepts presented by the book. For example, the chapter on memory management describes the page frame database, the data structure the system uses to keep track of the state of every page of physical memory, and an accompanying experiment shows how to view the actual data structure definition and contents of PFN entries on a running system using the kernel debugger. At the time, however, the only way to use Windbg and Kd to view kernel information was to attach a second computer with a serial “null modem” cable to the target system booted in debugging mode. The inconvenience of having to purchase an appropriate serial cable and configure two systems for kernel debugging meant that many readers skipped the experiments, but otherwise might have followed along and deepened their understanding if it was easier.
After giving it some thought, I realized that I could fool the debuggers into thinking that they were looking at a crash dump file by implementing a file system filter driver that presented a “virtual” crash dump file debuggers could open. Since a crash dump file is simply a file header followed by the contents of physical memory, the driver could satisfy reads of the virtual dump file with the contents of physical memory, which the driver could easily read from the \Device\Physical Memory section object the memory manager creates. A couple of weeks later, LiveKd was born. We expanded the number of kernel debugger experiments in the book and began using LiveKd in our live Windows Internals seminars and classes as well. LiveKd’s usage went beyond merely being an educational tool and over time became an integral part of IT pros and Microsoft support engineers troubleshooting toolkit. Microsoft even added local kernel debugging capability to Windows XP, but LiveKd can still do a few things that the native support can’t, like saving a copy of the system’s state to a dump file that can be examined on a different system and it works on Windows Vista/Server 2008 and higher without requiring the system to be booted in debug mode.
Virtual Machine Troubleshooting
The rise of virtualization has introduced a new scenario for live kernel debugging: troubleshooting virtual machines. While LiveKd works just as well inside a virtual machine as on a native installation, the ability to examine a running virtual machine without having to install and run LiveKd in the machine would add additional convenience and make it possible to troubleshoot virtual machines that are unresponsive or experiencing issues that would make it impossible to even launch LiveKd. Over the last few years I received requests from Microsoft support engineers for the feature and had started an initial investigation of the approach I’d take to add the support to LiveKd, but I hadn’t gotten around to finishing it.
Then a couple of months ago, I came across Matthieu Suiche’s LiveCloudKd tool, which enables Hyper-V virtual machine debugging and showed that there was general interest in the capability. We were so impressed that we invited Matthieu to speak about live kernel debugging and LiveCloudKd at this year’s BlueHat Security Briefings, held every year on Microsoft’s campus and taking place this week where I met him. Spurred on by LiveCloudKd, I decided it was time to finish the LiveKd enhancements and sent an email to Ken Johnson, formerly Skywing of Uninformed.org and now a developer in Microsoft’s security group (he had published articles revealing holes in 64-bit Windows “Patchguard” kernel tampering protection several times, so we hired him to help make Windows more secure), asking if he was interested in collaborating. Ken had previously contributed some code to LiveKd that enabled it to run on 64-bit Windows Vista and Windows 7 systems, so working with him was certain to speed the project – little did I know how much. He responded that he’d prototyped a tool for live virtual machine debugging a year before and thought he could incorporate it into LiveKd in a few days. Sure enough, a few days later and the beta of LiveKd 5.0 was finished, complete with the Hyper-V live debugging feature.
We picked this week to publish it to highlight Matthieu’s tool, which offers some capabilities not present in LiveKd. For example, just like it does for local machine debugging, LiveKd provides a read-only view of the target virtual machine, whereas LiveCloudKd lets you modify it as well.
LiveKd Hyper-V Debugging
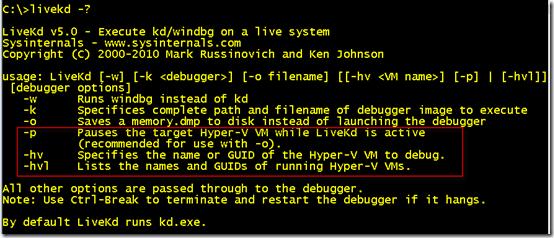
LiveKd’s Hyper-V support introduces three new command line switches, -p, -hv, and -hvl:
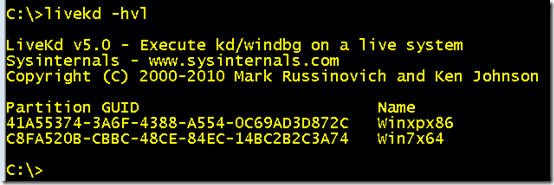
When you’re want to troubleshoot a virtual machine, use –hvl to list the names and IDs of the ones that are active:
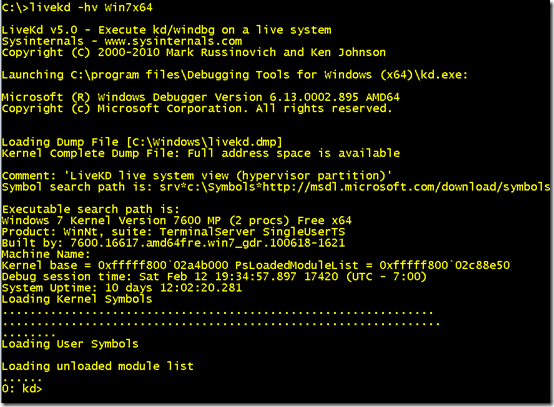
Next, use the -hv switch to specify the one you want to examine. You can use either the GUID or the virtual machine’s name, but it’s usually more convenient to use the name if it’s unique:
And that’s all there is to it. You can now perform the same commands as you can when using LiveKd on a native system, listing processes and threads, dumping memory, and generating crash dump files for later analysis.
The final switch, -p, pauses the virtual machine while LiveKd is connected. Normally, LiveKd reads pages of physical memory as they’re referenced by the debugger, which means that different pages can represent different points in time. That can lead to inconsistencies, for example, when you view a data structure on a page and then later one the structure references since second structure might have since been deleted. The pause option simply automates the Pause operation you can perform in the Hyper-V Virtual Machine management interface, giving you a frozen-in-time view of the virtual machine while you poke around.
Have fun debugging virtual machines and please share any troubleshooting success stories that make use of LiveKd’s new capabilities.
Comments
Anonymous
January 01, 2003
Great post ! Thanks for sharing this Mark.Anonymous
January 01, 2003
thanks! Can this work with WinDbg? What happens if the target hits a bugcheck? Are there advantages of LiveKd over setting up the virtual COM port on the target VM and connecting to that from the host?Anonymous
January 01, 2003
The Platform SDK is no more - it's the Windows SDK now. ;-)Anonymous
October 14, 2010
This a remarkable article which brings sweet memories of device driver writing in the late 1990's. The issue of requiring a second computer with a serial “null modem” cable to the target system booted in debugging mode was well known. We solved the problem back then by using SoftICE by NuMega. Remember them? NuMega no longer exists. So, when time came to develop a device driver for Windows XP several years ago, we resorted back to the venerable Windbg and Kd. The same issue of requiring a a second computer with a serial “null modem” cable was still there, but now we had... VMWare. Instead of 2 physical computers connected with a physical cable, we used to virtual machines connected with a "virtual null modem cable". Sweet. :)Anonymous
October 14, 2010
Looks very likely to Linux using gdb on /proc/kcore. Nice to have similar in windows nowAnonymous
October 19, 2010
Mark, any news on the 6th edition on Windows Internals? I remember saying something about expecting it very soon.Anonymous
October 19, 2010
@MSDNScreenName - LiveKD doesn't allow you to intercept control on a crash or set breakpoints - for that, you have to boot the target in debugging mode and configure and connect a host debugger. --David Solomon www.solsem.comAnonymous
October 29, 2010
Why did Mark skip blog-post(s) for September ? Ah, Mark was busy right ? Mark have the great useful posts by the way Thanks Mark!Anonymous
October 30, 2010
Ben only joked. Ben afraid Mark would be sad, so Ben post this to clarify!Anonymous
December 02, 2010
HI Mark Have a laptop machine. I play Gom player with my Music and notice when I stop the Music my performance climbs up. I suspect because it's due to Shared memory. Is there a way where it can be overcomed or a work around. I also noticed that Xp had a option where one could select "it's own memory Space". CAn it be done on Win 7 and if so what are the down sides.Anonymous
December 05, 2010
HI mark I'd like to talk about performance issues that I suspect are cause by Shared memory. Is there a work around... I'm interested in taking a look at maping or learning to map Memory to a program to avoid sharing conflicts. is it Possible? s404n1tn0cc@yahoo.com Sincerely s404 Best Wishes and Good Business


