Proof of Concept to test scalability of stream data processing in Azure.
Co-authors: Neeraj Joshi (Microsoft), Jason Short (Microsoft), Ercenk Keresteci (Full Scale 180, Inc.)
Introduction
The Developer Platform Evangelism team has been engaged with partners that have solutions on instrumentation requiring a very high rate of data ingestion. This Proof of Concept (PoC) is designed with proving the scalability of Windows Azure for processing the data.
Background
Currently all of the instrumentation solution providers typically have a solution like this:
· Each sensor capable recording data at specified time interval.
· Each unit (Secondary Instance) capable of capturing different sensor data streams
· Each central instance (Primary instance) capable of receiving data from 100s of Tier2 with over 1000 sensors with data streams
· Each tenant (or company) may have multiple Secondary tiers depending on factors like Geo locations, business partitioning etc.
Finally each Tier1 or Tenant needs to process the data streams and then do some business logic on top of those and store them in an accessible fashion for reporting. The output is most certainly grouped by the sensor tags. Reporting on that data will take place after that.
We have been asked whether Windows Azure is really capable of the current scale of on premise solutions. The next order is whether we can even support a multi-tenant solution with each tenant doing such operations.
We were able to deconstruct the PoC into three projects:
1. Ingestion: To test scalability to copy the data streams to Azure
2. Data Processing: Assume that data is there in input blobs and process in worker role and then index the data.
3. Reporting
An earlier PoC was completed to demonstrate the first part i.e. ingestion of data. This PoC is targeted specifically to demonstrate the rate of Data Processing.
PoC Setup & Architecture
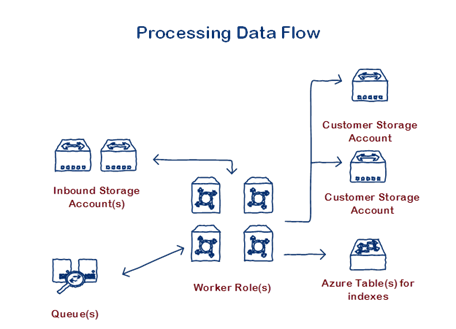
Diagram
Input
Storage Accounts
For the purposes of this PoC we will assume that the data is pre-generated in one storage account. We will have functionality to pull the data from multiple storage accounts should the need arise for more performance.
Conceptually this could also be used as an isolation boundary especially in cases of very large tenants who might want to own their own data in their own cloud subscription.
Datasets
Each dataset is a set of data potentially belonging to a tenant. In the current PoC the dataset is implemented as a container containing individual files.
Files
The input file contains the actual data. Each line will contain one data point namely the GUID representing the tagID, Timestamp and Value. Currently our input generator randomly generates an input file from 1MB to 4MB containing the specified amount of distinct tags.
Output
Output is stored in files on a per tag basis. To avoid contention we implemented a series of optimizations namely - For every tag, each thread on every instance will write a separate file. Total number of threads is optimally determined by the Task Parallel Library. Every line in the file will contain a timestamp and a value of that tag.
Note this is the most basic form of storing output data. There are many other ways of compressing the tag values especially for those that change infrequently.
Currently the files are stored in the same dataset they are being processed.
e.g. 05052013055816/302fbaac-0107-438a-84d9-252ea87ec34f-088d6f8e29084ac78464db1419c29044-DataMorph.Processing.Worker_IN_1-0.bin
Data Processing
Queues
Currently we have two queues datamorphworkqueue and datamorphprogressqueue.
The first queue indicates the total amount of work to be done and gets populated as soon as we start the run. The second queue is not necessary for processing logic. The web role we display the UI listens on this queue to post updates back to the browser using SignalR.
Worker Roles
1-n number of worker roles are spun up to process in the inbound data from the queue. The number of threads within each worker role is optimally determined by the Task Parallel Library (TPL).
Results
Metrics:
Before we talk about the numbers, here is our data collection mechanism.
Metric |
Calculation |
Total Processing Time |
T8 – T1 |
Read Time |
T3 – T2 |
Parse Time |
T5 – T4 |
Write Time |
T7 – T6 |
Increasing Instances (Constant Total Cores)
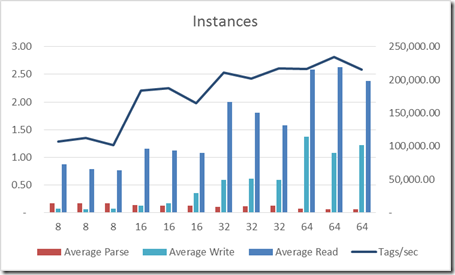
In this set of experiment, we kept the total number of cores constant at 64 and controlled for the number of instances.
Summary:
Performance goes up we increase the number of instances even though total cores remain the same.
Conversely, on an individual basis the average read and write times degrade as the instances increase. This could be because for the 8-core systems we are multiplexing the IO whereas for the single instance cases we have to setup/teardown the IO path more often. However, this time gets masked because of the asynchronous scale-out aspect of the workload and the fact that the Parse time has decreased significantly.
Increasing Roles & Total cores (Constant cores per Role)
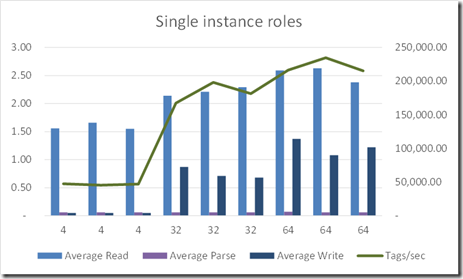
In this experiment we kept 1 core per instance and controlled for the total number of instances. Thus we increased the total number of cores to observe the performance.
Summary
The performance increases as we increase the total number of cores. However, the tags per sec do not increase linearly as the cores increase with total instances. The scale factor is significantly less than 2 (1.55) for 32 instances and 1.47 for 64 instances.
This can be attributed to the workload and the fact that we are doing very little work. So just adding roles and cores is increasing our Read & Write times while keeping the Parse Time constant.
Conclusion
Scale-out pattern works on Azure
Since the highest system on Azure is an 8-core box, the scale-up performance will hit a bottleneck very fast. The only way to achieve greater performance is through a scale-out architecture. The items below should be considered when designing an architectural pattern to process streaming data on Azure:
Avoid contention as much as possible
A key design factor into achieving scale out is avoiding contention. In our setup there is contention in three different places: reading the input, parsing the data and writing the output.
Input consists of read-only files and there is no contention in their processing by the Worker role.
Parsing the data is a specific business logic function which may or may not have contention. In our case, we assumed that the tag data read can be processed by the same thread without any other resource constraint.
Finally the key optimization is in writing the output. We specifically implemented some key assumptions which will avoid contention while writing the data:
· We create a file per tag per thread per instance of the worker role. So once the thread picks up the data from the input file, it will own the files related to the tags it processes. There is literally no contention.
· We also index the data in Azure Table so that we know which file contains which data point. Azure Table will only contain the file and the tag along with the timestamp.
Use Queues to optimize processing
Queues are used in this pattern to list the work that remains to be done. The worker roles will poll the queue and then process the input files based on the messages in the queue. The messages will be deleted by the worker role only after it has written to the output file.
In general, use one queue and multiple processors to achieve highest throughput is an efficient way to process multiple requests.
Asynchronous Processing
This loosely-coupled pattern helps with both contention and scale-out of resources. In our case the reading and writing are done by worker roles who are not dependent on each other as well as on the order of processing. They will process the work from the queue and update the queue
Resiliency
All of the data in Azure gets stored in at least 3 copies (For local redundant storage) and 6 copies across two datacenters (for Geo-Redundant storage). This assures that we will not lose either the input or output in event of a disaster.
If any role goes down, the message in the queue doesn’t get deleted and it will be picked up by the other instances as a part of the next batch of messages.
Further customization for optimizing a specific workload
Our current project was a Proof of Concept. For real applications there are multiple customizations which would need to be done to fit their specific requirements.
Batch Size
In our implementation we processed messages in batches of 10. This has a direct impact on memory as well as processing time for an instance. Too few batch sizes would increase the impact of the time to retrieve & process a message, and too large batch size would potentially starve other role instances.
Memory used
If the actual business logic in the worker role is dependent on memory, then the code will need to change to accommodate that. This could be implemented by reducing batch size, processing tags in a different way.
Tag compression and decompression
Our input data as well as the output data is the simplest implementation of streaming sensor data. Almost all of the available sensor data collection systems utilize some compression. The compression can be significant if the data doesn’t change that often. This can be leveraged to project an even higher number of tags per second.
Tenant prioritization
Currently we treat all tenants (represented as Datasets) equally. This could be easily modified to prioritize tenants or a set of tenants.


