Events
Power BI DataViz World Championships
14 Feb, 16 - 31 Mar, 16
With 4 chances to enter, you could win a conference package and make it to the LIVE Grand Finale in Las Vegas
Learn moreThis browser is no longer supported.
Upgrade to Microsoft Edge to take advantage of the latest features, security updates, and technical support.
Note
This isn't the latest version of this article. For the current release, see the .NET 9 version of this article.
Warning
This version of ASP.NET Core is no longer supported. For more information, see the .NET and .NET Core Support Policy. For the current release, see the .NET 9 version of this article.
Important
This information relates to a pre-release product that may be substantially modified before it's commercially released. Microsoft makes no warranties, express or implied, with respect to the information provided here.
For the current release, see the .NET 9 version of this article.
This article describes how to debug Blazor apps, including debugging Blazor WebAssembly apps with browser developer tools or an integrated development environment (IDE).
Blazor Web Apps can be debugged in Visual Studio or Visual Studio Code.
Blazor WebAssembly apps can be debugged:
Available scenarios for Blazor WebAssembly debugging include:
Unsupported scenarios include:
Blazor Server apps can be debugged in Visual Studio or Visual Studio Code.
Blazor WebAssembly apps can be debugged:
Unsupported scenarios for Blazor WebAssembly apps include:
Blazor Server apps can be debugged in Visual Studio or Visual Studio Code.
Blazor WebAssembly apps can be debugged:
Unsupported scenarios for Blazor WebAssembly apps include:
Program file and breakpoints in the OnInitialized{Async} lifecycle methods of components that are loaded by the first page requested from the app.This section explains the prerequisites for debugging.
The latest version of the following browsers:
Debugging requires the latest version of the following browsers:
Ensure that firewalls or proxies don't block communication with the debug proxy (NodeJS process). For more information, see the Firewall configuration section.
Note
Apple Safari on macOS isn't currently supported.
The latest version of Visual Studio or Visual Studio Code is required.
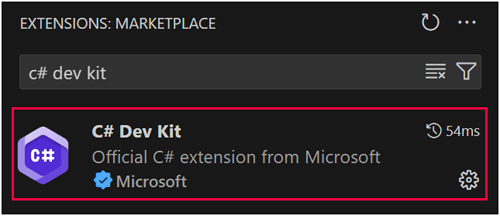
Visual Studio Code requires the C# Dev Kit for Visual Studio Code (Getting Started with C# in VS Code). In the Visual Studio Code Extensions Marketplace, filter the extension list with "c# dev kit" to locate the extension:
Installing the C# Dev Kit automatically installs the following additional extensions:
If you encounter warnings or errors, you can open an issue (microsoft/vscode-dotnettools GitHub repository) describing the problem.
The guidance in this subsection applies to client-side debugging.
Open the Properties/launchSettings.json file of the startup project. Confirm the presence of the following inspectUri property in each launch profile of the file's profiles node. If the following property isn't present, add it to each profile:
"inspectUri": "{wsProtocol}://{url.hostname}:{url.port}/_framework/debug/ws-proxy?browser={browserInspectUri}"
The inspectUri property:
The placeholder values for the WebSocket protocol (wsProtocol), host (url.hostname), port (url.port), and inspector URI on the launched browser (browserInspectUri) are provided by the framework.
Blazor Web Apps: Microsoft.AspNetCore.Components.WebAssembly.Server: References an internal package (Microsoft.NETCore.BrowserDebugHost.Transport) for assemblies that share the browser debug host.
Blazor Server: Microsoft.AspNetCore.Components.WebAssembly.Server: References an internal package (Microsoft.NETCore.BrowserDebugHost.Transport) for assemblies that share the browser debug host.
Standalone Blazor WebAssembly: Microsoft.AspNetCore.Components.WebAssembly.DevServer: Development server for use when building Blazor apps. Calls UseWebAssemblyDebugging internally to add middleware for debugging Blazor WebAssembly apps inside Chromium developer tools.
Hosted Blazor WebAssembly:
Microsoft.AspNetCore.Components.WebAssembly.DevServer: Development server for use when building Blazor apps. Calls UseWebAssemblyDebugging internally to add middleware for debugging Blazor WebAssembly apps inside Chromium developer tools.Microsoft.AspNetCore.Components.WebAssembly.Server: References an internal package (Microsoft.NETCore.BrowserDebugHost.Transport) for assemblies that share the browser debug host.Note
For guidance on adding packages to .NET apps, see the articles under Install and manage packages at Package consumption workflow (NuGet documentation). Confirm correct package versions at NuGet.org.
The example in this section assumes that you've created a Blazor Web App with an interactive render mode of Auto (Server and WebAssembly) and per-component interactivity location.
currentCount++; line in the Counter component (Pages/Counter.razor) of the client project (.Client).Counter page at /counter. Wait a few seconds for the debug proxy to load and run. Select the Click me button to hit the breakpoint.currentCount field in the Locals window.Breakpoints can also be hit in the server project in statically-rendered and interactively-rendered server-side components.
Weather component (Components/Pages/Weather.razor) and set a breakpoint anywhere in the OnInitializedAsync method.Weather page at /weather. Wait a few seconds for the debug proxy to load and run. Application execution stops at the breakpoint.Breakpoints are not hit during app startup before the debug proxy is running. This includes breakpoints in the Program file and breakpoints in the OnInitialized{Async} lifecycle methods of components that are loaded by the first page requested from the app.
currentCount++; line in the Counter component (Pages/Counter.razor).Counter page at /counter. Wait a few seconds for the debug proxy to load and run. Select the Click me button to hit the breakpoint.currentCount field in the Locals window.Breakpoints are not hit during app startup before the debug proxy is running. This includes breakpoints in the Program file and breakpoints in the OnInitialized{Async} lifecycle methods of components that are loaded by the first page requested from the app.
currentCount++; line in the Counter component (Pages/Counter.razor).Counter page at /counter. Wait a few seconds for the debug proxy to load and run. Select the Click me button to hit the breakpoint.currentCount field in the Locals window.Breakpoints are not hit during app startup before the debug proxy is running. This includes breakpoints in the Program file and breakpoints in the OnInitialized{Async} lifecycle methods of components that are loaded by the first page requested from the app.
With the Server project selected in Solution Explorer, press F5 to run the app in the debugger.
When debugging with a Chromium-based browser, such as Google Chrome or Microsoft Edge, a new browser window might open with a separate profile for the debugging session instead of opening a tab in an existing browser window with the user's profile. If debugging with the user's profile is a requirement, adopt one of the following approaches:
In the Client project, set a breakpoint on the currentCount++; line in the Counter component (Pages/Counter.razor).
In the browser, navigate to Counter page at /counter. Wait a few seconds for the debug proxy to load and run. Select the Click me button to hit the breakpoint.
In Visual Studio, inspect the value of the currentCount field in the Locals window.
Press F5 to continue execution.
You can also debug server code in the Server project:
Pages/FetchData.razor page in OnInitializedAsync.WeatherForecastController in the Get action method.Fetch Data page to hit the first breakpoint in the FetchData component just before it issues an HTTP request to the server.WeatherForecastController.Breakpoints are not hit during app startup before the debug proxy is running. This includes breakpoints in the Program file and breakpoints in the OnInitialized{Async} lifecycle methods of components that are loaded by the first page requested from the app.
To attach to a running Blazor app, open the .vscode/launch.json file and replace the {URL} placeholder with the URL where the app is running:
{
  "name": "Attach and Debug",
  "type": "blazorwasm",
  "request": "attach",
  "url": "{URL}"
}
The launch configuration options in the following table are supported for the blazorwasm debug type (.vscode/launch.json).
| Option | Description |
|---|---|
browser |
The browser to launch for the debugging session. Set to edge or chrome. Defaults to edge. |
cwd |
The working directory to launch the app under. |
request |
Use launch to launch and attach a debugging session to a Blazor WebAssembly app or attach to attach a debugging session to an already-running app. |
timeout |
The number of milliseconds to wait for the debugging session to attach. Defaults to 30,000 milliseconds (30 seconds). |
trace |
Used to generate logs from the JS debugger. Set to true to generate logs. |
url |
The URL to open in the browser when debugging. |
webRoot |
Specifies the absolute path of the web server. Should be set if an app is served from a sub-route. |
The additional options in the following table only apply to hosted Blazor WebAssembly apps.
| Option | Description |
|---|---|
env |
The environment variables to provide to the launched process. Only applicable if hosted is set to true. |
hosted |
Must be set to true if launching and debugging a hosted Blazor WebAssembly app. |
program |
A reference to the executable to run the server of the hosted app. Must be set if hosted is true. |
The guidance in this section applies debugging Blazor WebAssembly apps in:
Run the app in a command shell with dotnet watch (or dotnet run).
Launch a browser and navigate to the app's URL.
Start remote debugging by pressing:
The browser must be running with remote debugging enabled, which isn't the default. If remote debugging is disabled, an Unable to find debuggable browser tab error page is rendered with instructions for launching the browser with the debugging port open. Follow the instructions for your browser.
After following the instructions to enable remote debugging, the app opens in a new browser window. Start remote debugging by pressing the HotKey combination in the new browser window:
A new window developer tools browser tab opens showing a ghosted image of the app.
Note
If you followed the instructions to open a new browser tab with remote debugging enabled, you can close the original browser window, leaving the second window open with the first tab running the app and the second tab running the debugger.
After a moment, the Sources tab shows a list of the app's .NET assemblies and pages.
Open the file:// node. In component code (.razor files) and C# code files (.cs), breakpoints that you set are hit when code executes in the app's browser tab (the initial tab opened after starting remote debugging). After a breakpoint is hit, single-step (F10) through the code or resume (F8) code execution normally in the debugging tab.
For Chromium-based browser debugging, Blazor provides a debugging proxy that implements the Chrome DevTools Protocol and augments the protocol with .NET-specific information. When debugging keyboard shortcut is pressed, Blazor points the Chrome DevTools at the proxy. The proxy connects to the browser window you're seeking to debug (hence the need to enable remote debugging).
The guidance in this section applies debugging Blazor WebAssembly apps in Firefox running on Windows.
Debugging a Blazor WebAssembly app with Firefox requires configuring the browser for remote debugging and connecting to the browser using the browser developer tools through the .NET WebAssembly debugging proxy.
Note
Debugging in Firefox from Visual Studio isn't supported at this time.
To debug a Blazor WebAssembly app in Firefox during development:
about:config in a new browser tab. Read and dismiss the warning that appears.devtools.debugger.remote-enabled by setting its value to True.devtools.chrome.enabled by setting its value to True.devtools.debugger.prompt-connection by setting its value to False.dotnet watch (or dotnet run).about:debugging in a new browser tab. Leave this tab open.Debugger tab, open the app source file you wish to debug under the file:// node and set a breakpoint. For example, set a breakpoint on the currentCount++; line in the IncrementCount method of the Counter component (Pages/Counter.razor).Counter component page (/counter) in the app's browser tab and select the counter button to hit the breakpoint.The debugger doesn't break on unhandled exceptions because Blazor catches exceptions that are unhandled by developer code.
To break on unhandled exceptions:
Browser source maps allow the browser to map compiled files back to their original source files and are commonly used for client-side debugging. However, Blazor doesn't currently map C# directly to JavaScript/WASM. Instead, Blazor does IL interpretation within the browser, so source maps aren't relevant.
If a firewall blocks communication with the debug proxy, create a firewall exception rule that permits communication between the browser and the NodeJS process.
Warning
Modification of a firewall configuration must be made with care to avoid creating security vulnerabilities. Carefully apply security guidance, follow best security practices, and respect warnings issued by the firewall's manufacturer.
Permitting open communication with the NodeJS process:
If possible, only allow open communication with the NodeJS process on trusted or private networks.
For Windows Firewall configuration guidance, see Create an Inbound Program or Service Rule. For more information, see Windows Defender Firewall with Advanced Security and related articles in the Windows Firewall documentation set.
If you're running into errors, the following tips may help:
localStorage.clear() to remove any breakpoints.localhost is included in the proxy bypass settings. This can be done by setting the NO_PROXY environment variable in either:
launchSettings.json file for the project.NodeJS process). For more information, see the Firewall configuration section.The Blazor framework's debugging proxy doesn't launch instantly on app startup, so breakpoints in the OnInitialized{Async} lifecycle methods might not be hit. We recommend adding a delay at the start of the method body to give the debug proxy some time to launch before the breakpoint is hit. You can include the delay based on an if compiler directive to ensure that the delay isn't present for a release build of the app.
protected override void OnInitialized()
{
#if DEBUG
    Thread.Sleep(10000);
#endif

    ...
}
protected override async Task OnInitializedAsync()
{
#if DEBUG
    await Task.Delay(10000);
#endif

    ...
}
If Visual Studio throws an exception that the debug adapter failed to launch mentioning that the timeout was reached, you can adjust the timeout with a Registry setting:
VsRegEdit.exe set "<VSInstallFolder>" HKCU JSDebugger\Options\Debugging "BlazorTimeoutInMilliseconds" dword {TIMEOUT}
The {TIMEOUT} placeholder in the preceding command is in milliseconds. For example, one minute is assigned as 60000.
ASP.NET Core feedback
ASP.NET Core is an open source project. Select a link to provide feedback:
Events
Power BI DataViz World Championships
14 Feb, 16 - 31 Mar, 16
With 4 chances to enter, you could win a conference package and make it to the LIVE Grand Finale in Las Vegas
Learn moreTraining
Module
Remotely debug ASP.NET Core apps hosted on Azure App Service using Visual Studio - Training
Hands-on training to deploy and remotely debug your ASP.NET Core apps on Azure App Service directly using Visual Studio 2022.
Documentation
ASP.NET Core Blazor render modes
Learn about Blazor render modes and how to apply them in Blazor Web Apps.
ASP.NET Core Blazor configuration
Learn about Blazor app configuration, including app settings, authentication, and logging configuration.
ASP.NET Core Blazor performance best practices
Tips for increasing performance in ASP.NET Core Blazor apps and avoiding common performance problems.