Build a real-time capable application
You can use Visual Studio, Visual Studio Code, or the command line (CLI) to develop and debug real-time capable applications (RTApps) in much the same way as high-level applications.
Prerequisites
- Connect your Azure Sphere device to your computer
- Install Azure Sphere
- Install the GNU Arm Embedded toolchain
- Set up the hardware to display output from the dedicated UART, if you haven't done so already
Enable development and debugging
Before you can build a sample application on your Azure Sphere device or develop new applications for it, you must enable development and debugging. By default, Azure Sphere devices are "locked"; that is, they do not allow applications under development to be loaded from a PC, and they do not allow debugging of applications. Preparing the device for debugging removes this restriction and loads software required for debugging and unlocks device capabilities .
To debug on the real-time cores, use the az sphere device enable-development command. This command configures the device to accept applications from a PC for debugging and assigns the device to the Development device group, which does not allow cloud application updates. During application development and debugging, you should leave the device in this group so that cloud application updates do not overwrite the application under development.
On Windows, you must add the --enable-rt-core-debugging parameter, which loads the debugging servers and required drivers for each type of core onto the device.
Log in to Azure Sphere if you haven't already done so:
az loginOpen a command-line interface using PowerShell or Windows Command Prompt with administrator privileges. The
--enable-rt-core-debuggingparameter requires administrator privilege because it installs USB drivers for the debugger.Enter the following command:
az sphere device enable-development --enable-rt-core-debugging --catalog <CatalogName> --resource-group <ResourceGroupName>Close the window after the command completes because administrator privilege is no longer required. As a best practice, you should always use the lowest privilege that can accomplish a task.
If the az sphere device enable-development command fails, see Troubleshoot Azure Sphere problems for help.
Enable development and debugging
Before you can build a sample application on your Azure Sphere device or develop new applications for it, you must enable development and debugging. By default, Azure Sphere devices are "locked"; that is, they do not allow applications under development to be loaded from a PC, and they do not allow debugging of applications. Preparing the device for debugging removes this restriction and loads software required for debugging and unlocks device capabilities as described in Device capabilities and communication.
To debug on the real-time cores, use the az sphere device enable-development command. This command configures the device to accept applications from a PC for debugging and assigns the device to the Development device group, which does not allow cloud application updates. During application development and debugging, you should leave the device in this group so that cloud application updates do not overwrite the application under development.
On Windows, you must add the --enable-rt-core-debugging parameter, which loads the debugging servers and required drivers for each type of core onto the device.
Log in to Azure if you haven't already done so:
az loginOpen a command-line interface using PowerShell, Windows Command Prompt, or Linux command shell with administrator privileges. The
--enable-rt-core-debuggingparameter requires administrator privilege because it installs USB drivers for the debugger.Enter the following command:
az sphere device enable-development --enable-rt-core-debuggingClose the window after the command completes because administrator privilege is no longer required. As a best practice, you should always use the lowest privilege that can accomplish a task.
If the az sphere device enable-development command fails with the following error message, see Troubleshoot Azure Sphere problems for help.
error: The device did not accept the device capability configuration. Please check the Azure Sphere OS on your device is up-to-date using 'az sphere device show-deployment-status'.
Build the RTApp using Visual Studio Code
To build an RTApp:
In Visual Studio Code, open the HelloWorld_RTApp_MT3620_BareMetal folder in your clone of the Azure Sphere samples repo. If you're prompted to select a kit, choose "Do not use a kit."
Press F5 to start the debugger. If the project has not previously been built, or if files have changed and rebuild is required, Visual Studio Code will build the project before debugging starts.
The connected terminal emulator should display output from the application. The program sends the following words at one-second intervals:
TickTockNote
Visual Studio Code provides Intellisense, but it won't automatically update when you modify CMakeLists.txt. You need to run the CMake: Delete Cache and Reconfigure command to refresh Intellisense. The CMake targets view can be found in the CMake extension view on the left bar.
Build the RTApp using Visual Studio
To build an RTApp:
In Visual Studio, select File > CMake and navigate to the folder that contains the sample.
If CMake generation does not start automatically, select the CMakeLists.txt file.
In Visual Studio, View > Output > Show output from: CMake output should show the messages
CMake generation started.andCMake generation finished.On the CMake menu (if present), select Build All. If the menu is not present, open Solution Explorer, right-click the CMakeLists.txt file, and select Build. The output location of the Azure Sphere application appears in the Output window.
Press F5 to deploy the application.
The connected terminal emulator should display output from the application. The program sends the following words at one-second intervals:
TickTockNote
Visual Studio provides Intellisense for Azure Sphere RTApps by gathering data from its CMake cache. Visual Studio updates the cache whenever the CMakeLists.txt or CMakeSettings.json file in the RTApp changes.
By default, Visual Studio uses the Folder view. If you prefer a logical view of the CMake project, you can change to the CMake Targets view. In Solution Explorer, select the folder toggle icon:
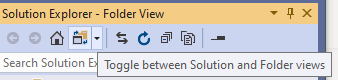
From the dropdown menu, select CMake Targets View.
The application might begin executing before OpenOCD makes a connection. As a result, breakpoints set early in the code might be missed. A simple workaround for this is to delay the start of the app until OpenOCD connects.
Insert the following code at the beginning of the application entry point RTCoreMain. This will cause the application to enter and remain in a
whileloop until variablefis set to true.volatile bool f = false; while (!f) { // empty. }Press F5 to start the app with debugging and then break into execution.
In the Locals debug pane, change the value of
ffrom zero to one.Step through the code as normal.
Build RTApp using the CLI
The instructions that follow assume you're using CMake. If you prefer to build on the command line without using CMake, you can determine the appropriate compiler and linker options by looking at the AzureSphereToolchainBase.cmake and AzureSphereRTCoreToolchain.cmake files, which are installed with the Azure Sphere SDK.
Open a command-line interface using PowerShell, Windows Command Prompt, or Linux command shell. Navigate to your project build directory.
From your project build directory, at the command prompt, run CMake with the following parameters:
cmake --preset <preset-name> <source-path>--preset <preset-name>The build configuration preset name as defined in CMakePresets.json.
--build <cmake-path>The binary directory that contains the CMake cache. For example, if you run CMake on an Azure Sphere sample, the build command would be
cmake --build out/ARM-Debug.<source-path>The path of the directory that contains the source files for the sample application. In the example, the Azure Sphere samples repository was downloaded to a directory called AzSphere.
CMake parameters are separated by spaces. The line continuation character (^ for Windows command line, \ for Linux command line, or ` for PowerShell) can be used for readability, but is not required.
The following examples show the CMake commands for the HelloWorld RTApp:
Run Ninja to build the application and create the image package file:
ninja -C out/ARM-DebugNinja places the resulting application and .imagepackage files in the specified directory.
You can also invoke Ninja through CMake with the following command:
cmake --build out/<binary-dir>Set
<binary-dir>to the binary directory that contains the CMake cache. For example, if you run CMake on an Azure Sphere sample, the build command would becmake --build out/ARM-Debug.Delete any applications that are already deployed to the device:
az sphere device sideload deleteDeploy the image package that Ninja created:
az sphere device sideload deploy --image-package <package-name>Get the component ID for the image:
az sphere image-package show --image-package <path-to-imagepackage>The command returns all the metadata for the image package. The component ID for the application appears in the Identity section for the Application Image Type. For example:
...
  "Identity": {
    "ComponentId": "<component-id>",
    "ImageId": "<image-id>",
    "ImageType": "Application"
  },
...
Determine which core your app is running on.
By default, the RTApp is deployed to the first available real-time core on the device; you cannot currently specify a particular core. To find out which core the application is running on, use the az sphere device app command to stop and then restart the application. Supply the component ID for the application in the commands. For example:
az sphere device app stop --component-id <component id>
<component id>: App state: stopped
az sphere device app start --component-id <component id> <component id> App state: running Core : Real-time 0The connected terminal emulator should display output from the application. The program sends the following words at one-second intervals:
TickTock
Log output from an RTApp
Each real-time core on the MT3620 has a dedicated UART that is intended for logging output. The real-time cores can also access the ISU UARTs. The MT3620 RDB exposes only the TX pin, which you can use to display log output from the application. Other hardware may expose this differently, or not at all. To see the log output, set up your hardware to display this output as described in the quickstart. The dedicated UART doesn't require the Uart application manifest requirement; however, it shouldn't be used for purposes other than logging output for an RTApp.
Develop with partner apps
When you load an application onto the Azure Sphere device, the Azure Sphere deployment tools by default delete all existing applications. To prevent this from happening when you develop applications that communicate with each other, you need to mark the applications as partners. When you deploy one of the applications, its partners will not be deleted. See Mark applications as partners for details.
Troubleshooting
If you encounter problems, see Troubleshooting real-time capable applications.
Additional resources
Additional drivers and samples for RTApps that target the M4 real-time cores on the MT3620 chip are available on GitHub from Azure Sphere partners:
Feedback
Coming soon: Throughout 2024 we will be phasing out GitHub Issues as the feedback mechanism for content and replacing it with a new feedback system. For more information see: https://aka.ms/ContentUserFeedback.
Submit and view feedback for