Add a reference layer
Reference layers enable the enhancement of spatial visualizations by overlaying a secondary spatial dataset on the map to provide more context. Power BI hosts this dataset in various formats, including:
- GeoJSON files with a
.jsonor.geojsonextension - WKT (Well-Known Text) files with a
.wktextension - KML (Keyhole Markup Language) files with a
.kmlextension - SHP (Shapefile) files with a
.shpextension - CSV (Comma-separated values) files with a
.csvextension. The Azure Maps Power BI visual parses the column containing WKT (Well-Known Text) strings from the sheet.
Add a spatial dataset as a reference layer
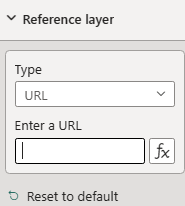
You have two options to add a spatial dataset as a reference layer. You can either reference a hosted file by providing the URL, or select a file to upload.
To upload a spatial dataset as a reference layer:
Navigate to the Format pane.
Expand the Reference Layer section.
Select File Upload from the Type drop-down list.
Select Browse. The file selection dialog opens, allowing you to choose a file with a
.json,.geojson,.wkt,.kml,.shp, or.csvextension.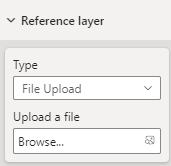
Once the file is added to the reference layer, the file name appears in the Browse field. An 'X' button is added that removes the data from the visual and deletes the associated file from Power BI when selected.
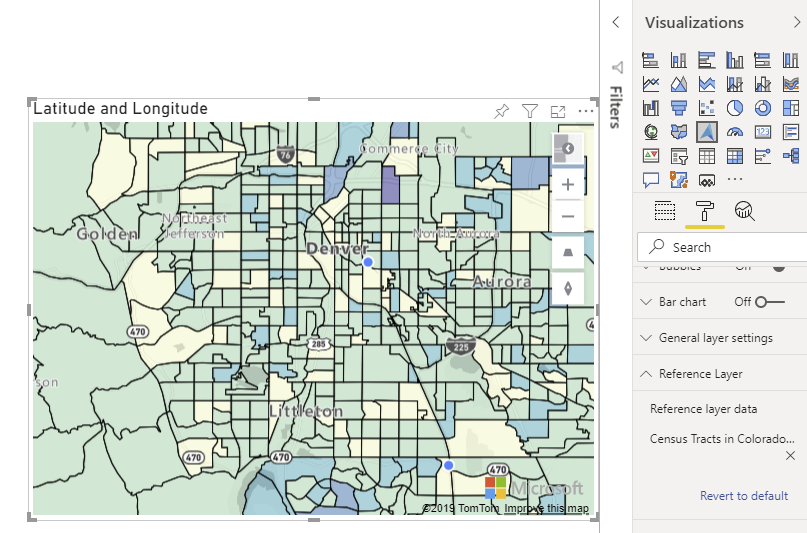
The following map displays 2016 census tracts for Colorado. The areas are colored, based on population, using the reference layer.
The following are all settings in the Format pane that are available in the Reference layer section.
| Setting | Description |
|---|---|
| Reference layer data | The data file to upload to the visual as another layer within the map. Selecting Browse shows a list of files with a .json, .geojson, .wkt, .kml, .shp, or .csv file extension that can be opened. |
Styling data in a reference layer
Properties can be added to each feature within the GeoJSON file to customize styling. This feature uses the simple data layer feature in the Azure Maps Web SDK. For more information, see this document on supported style properties. Custom icon images aren't supported within the Azure Maps Power BI visual as a security precaution.
The following are examples showing how to set a point features color property to red.
GeoJSON
{
    "type": "Feature",
    "geometry": {
        "type": "Point",
        "coordinates": [-122.13284, 47.63699]
    },
    "properties": {
        "color": "red"
    }
}
WKT
POINT(-122.13284 47.63699)
KML
<?xml version="1.0" encoding="UTF-8"?>
<kml xmlns="http://www.opengis.net/kml/2.2">
  <Placemark>
    <Point>
      <coordinates>-122.13284,47.63699</coordinates>
    </Point>
    <Style>
      <IconStyle>
        <color>ff0000ff</color> <!-- Red color in KML format (Alpha, Blue, Green, Red) -->
      </IconStyle>
    </Style>
  </Placemark>
</kml>
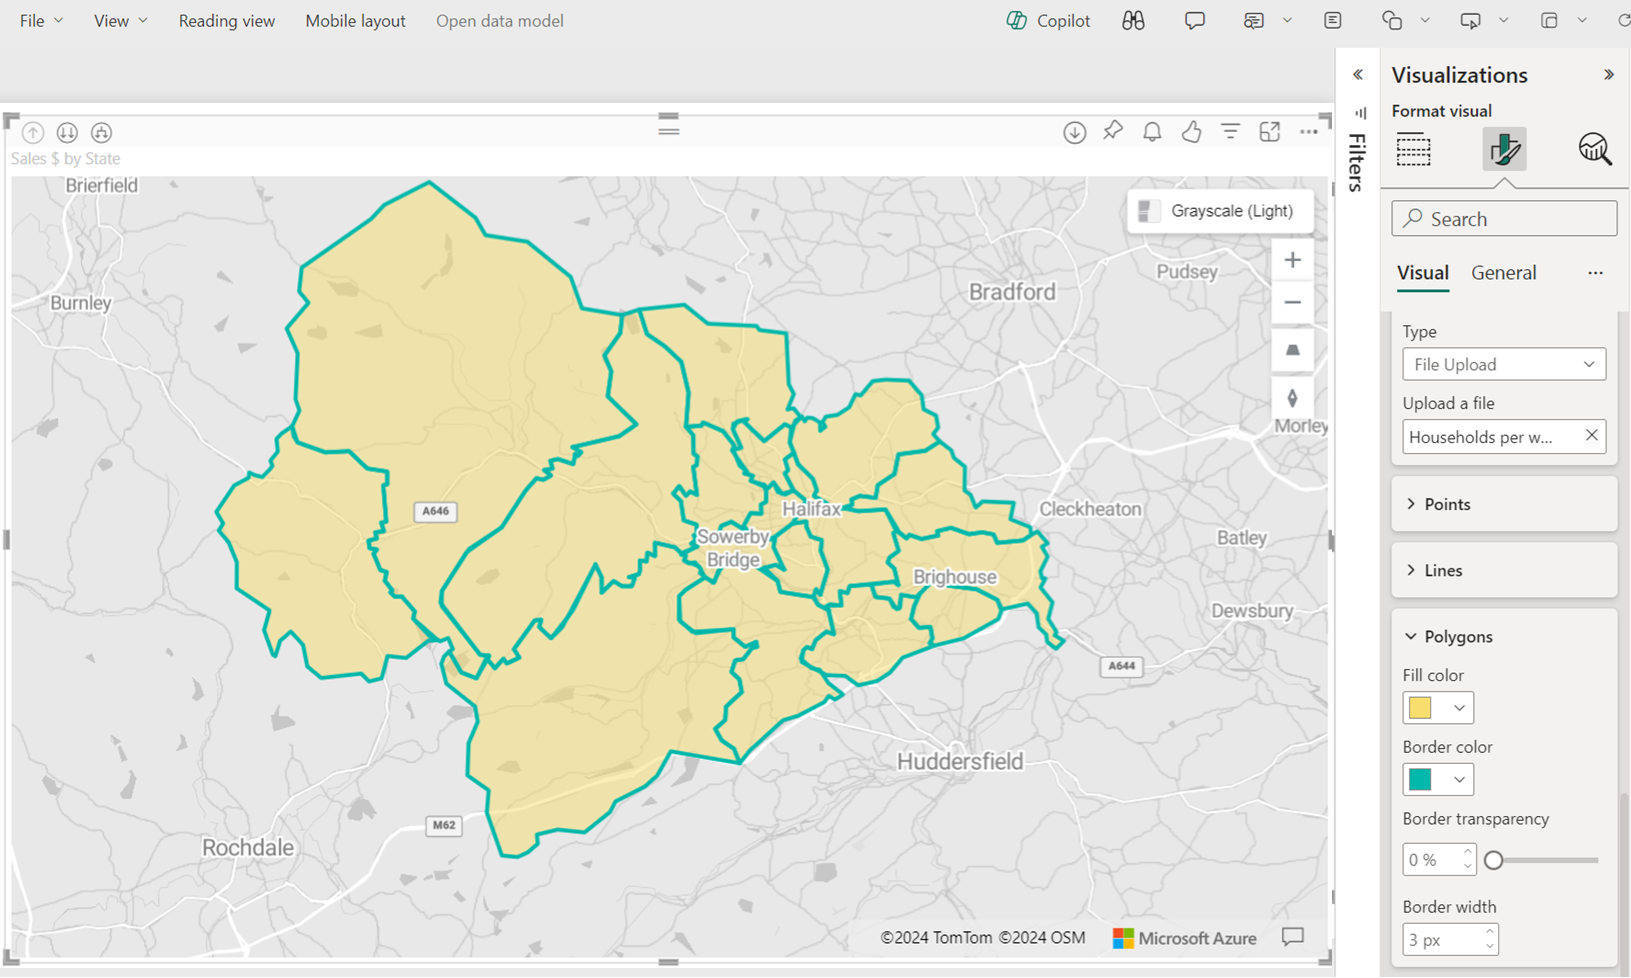
Custom style for reference layer via format pane
The Custom style for reference layer via format pane feature in Azure Maps enables you to personalize the appearance of reference layers. You can define the color, border width, and transparency of points, lines, and polygons directly in the Azure Maps Power BI visual interface, to enhance the visual clarity and impact of your geospatial data.
Enabling Custom Styles
To use the custom styling options for reference layers, follow these steps:
- Upload Geospatial Files: Start by uploading your supported geospatial files (GeoJSON, KML, WKT, CSV, or Shapefile) to Azure Maps as a reference layer.
- Access Format Settings: Navigate to the Reference Layer blade within the Azure Maps Power BI visual settings.
- Customize Styles: Use to adjust the appearance of your reference layer by setting the fill color, border color, border width, and transparency for points, lines, and polygons.
Note
If your geospatial files (GeoJSON, KML) include predefined style properties, Power BI will utilize those styles rather than the settings configured in the format pane. Make sure your files are styled according to your requirements before uploading if you intend to use custom properties defined within them.
Style Configuration
| Setting name | Description | Setting values |
|---|---|---|
| Fill Colors | Fill color of points and polygons. | Set colors for different data category or gradient for numeric data. |
| Border Color | The color of the points, lines, and polygons outline. | Color picker |
| Border width | The width of the border in pixels. Default: 3 px | Width 1-10 pixels |
| Border transparency | The transparency of the borders. Default: 0% | Transparency 0-100% |
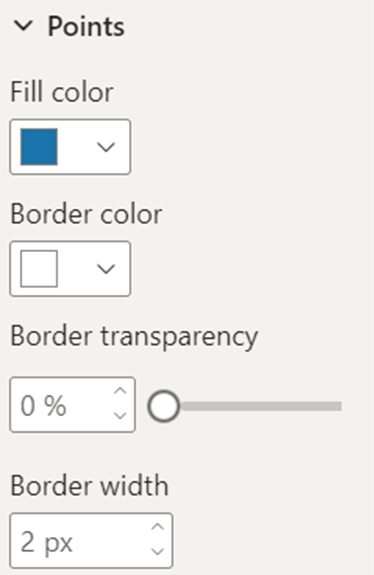
The Points section of the format visual pane:
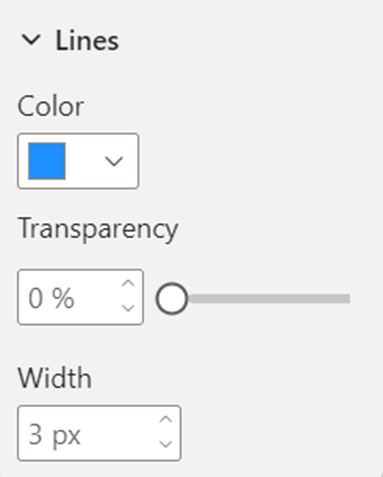
The Lines section of the format visual pane:
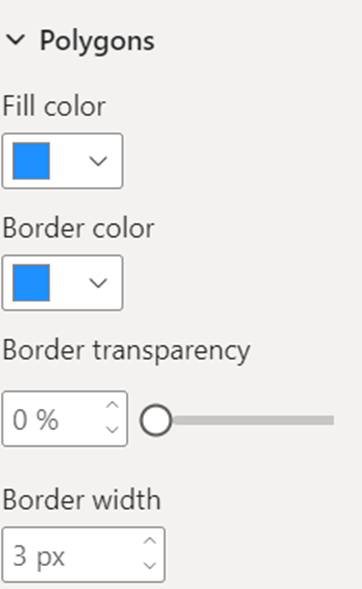
The polygons section of the format visual pane:
Next steps
Add more context to the map:
Feedback
Coming soon: Throughout 2024 we will be phasing out GitHub Issues as the feedback mechanism for content and replacing it with a new feedback system. For more information see: https://aka.ms/ContentUserFeedback.
Submit and view feedback for