Tutorial: Route electric vehicles by using Azure Notebooks (Python)
Azure Maps is a portfolio of geospatial service APIs that are natively integrated into Azure. These APIs enable developers, enterprises, and ISVs to develop location-aware apps, IoT, mobility, logistics, and asset tracking solutions.
The Azure Maps REST APIs can be called from languages such as Python and R to enable geospatial data analysis and machine learning scenarios. Azure Maps offers a robust set of routing APIs that allow users to calculate routes between several data points. The calculations are based on various conditions, such as vehicle type or reachable area.
In this tutorial, you walk help a driver whose electric vehicle battery is low. The driver needs to find the closest possible charging station from the vehicle's location.
In this tutorial, you will:
- Create and run a Jupyter Notebook file on Azure Notebooks in the cloud.
- Call Azure Maps REST APIs in Python.
- Search for a reachable range based on the electric vehicle's consumption model.
- Search for electric vehicle charging stations within the reachable range, or isochrone.
- Render the reachable range boundary and charging stations on a map.
- Find and visualize a route to the closest electric vehicle charging station based on drive time.
Prerequisites
Note
For more information on authentication in Azure Maps, see manage authentication in Azure Maps.
Create an Azure Notebooks project
To follow along with this tutorial, you need to create an Azure Notebooks project and download and run the Jupyter Notebook file. The Jupyter Notebook file contains Python code, which implements the scenario in this tutorial. To create an Azure Notebooks project and upload the Jupyter Notebook document to it, do the following steps:
Go to Azure Notebooks and sign in. For more information, see Quickstart: Sign in and set a user ID.
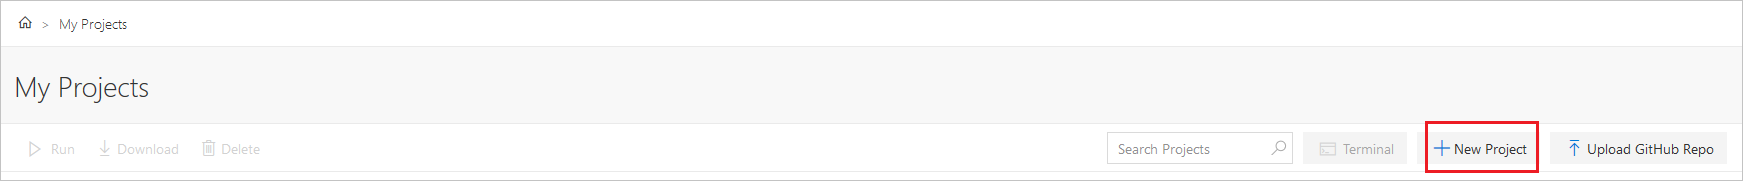
At the top of your public profile page, select My Projects.

On the My Projects page, select New Project.
In the Create New Project pane, enter a project name and project ID.
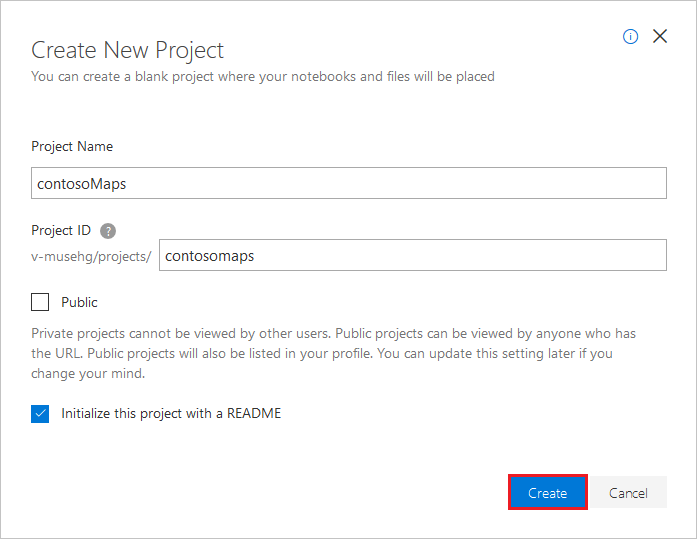
Select Create.
After your project is created, download this Jupyter Notebook document file from the Azure Maps Jupyter Notebook repository.
In the projects list on the My Projects page, select your project, and then select Upload to upload the Jupyter Notebook document file.
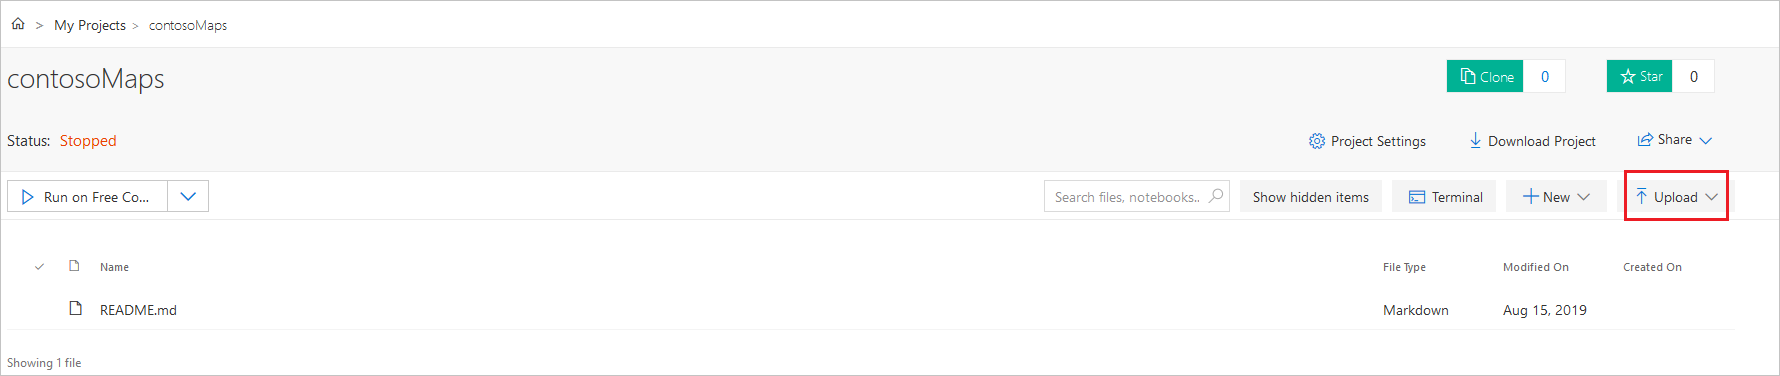
Upload the file from your computer, and then select Done.
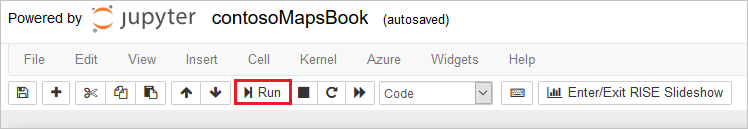
After the upload has finished successfully, your file is displayed on your project page. Double-click on the file to open it as a Jupyter Notebook.
Try to understand the functionality that's implemented in the Jupyter Notebook file. Run the code, in the Jupyter Notebook file, one cell at a time. You can run the code in each cell by selecting the Run button at the top of the Jupyter Notebook app.
Install project level packages
To run the code in Jupyter Notebook, install packages at the project level by doing the following steps:
Download the requirements.txt file from the Azure Maps Jupyter Notebook repository, and then upload it to your project.
On the project dashboard, select Project Settings.
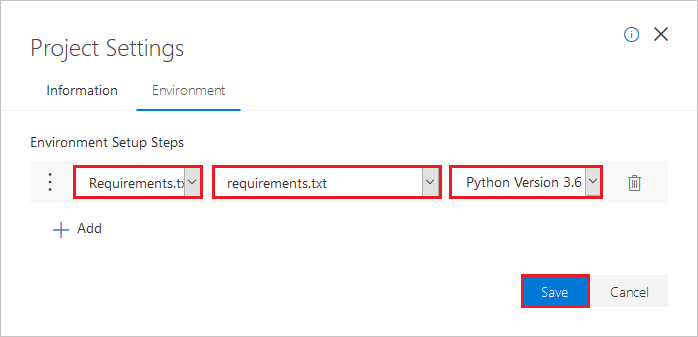
In the Project Settings pane, select the Environment tab, and then select Add.
Under Environment Setup Steps, do the following: a. In the first drop-down list, select Requirements.txt.
b. In the second drop-down list, select your requirements.txt file.
c. In the third drop-down list, select Python Version 3.6 as your version.Select Save.
Load the required modules and frameworks
To load all the required modules and frameworks, run the following script.
import time
import aiohttp
import urllib.parse
from IPython.display import Image, display
Request the reachable range boundary
A package delivery company has some electric vehicles in its fleet. During the day, electric vehicles need to be recharged without having to return to the warehouse. Every time the remaining charge drops to less than an hour, you search for a set of charging stations that are within a reachable range. Essentially, you search for a charging station when the battery is low on charge. And, you get the boundary information for that range of charging stations.
Because the company prefers to use routes that require a balance of economy and speed, the requested routeType is eco. The following script calls the Get Route Range API of the Azure Maps routing service. It uses parameters for the vehicle's consumption model. The script then parses the response to create a polygon object of the geojson format, which represents the car's maximum reachable range.
To determine the boundaries for the electric vehicle's reachable range, run the script in the following cell:
subscriptionKey = "Your Azure Maps key"
currentLocation = [34.028115,-118.5184279]
session = aiohttp.ClientSession()
# Parameters for the vehicle consumption model
travelMode = "car"
vehicleEngineType = "electric"
currentChargeInkWh=45
maxChargeInkWh=80
timeBudgetInSec=550
routeType="eco"
constantSpeedConsumptionInkWhPerHundredkm="50,8.2:130,21.3"
# Get boundaries for the electric vehicle's reachable range.
routeRangeResponse = await (await session.get("https://atlas.microsoft.com/route/range/json?subscription-key={}&api-version=1.0&query={}&travelMode={}&vehicleEngineType={}¤tChargeInkWh={}&maxChargeInkWh={}&timeBudgetInSec={}&routeType={}&constantSpeedConsumptionInkWhPerHundredkm={}"
.format(subscriptionKey,str(currentLocation[0])+","+str(currentLocation[1]),travelMode, vehicleEngineType, currentChargeInkWh, maxChargeInkWh, timeBudgetInSec, routeType, constantSpeedConsumptionInkWhPerHundredkm))).json()
polyBounds = routeRangeResponse["reachableRange"]["boundary"]
for i in range(len(polyBounds)):
coordList = list(polyBounds[i].values())
coordList[0], coordList[1] = coordList[1], coordList[0]
polyBounds[i] = coordList
polyBounds.pop()
polyBounds.append(polyBounds[0])
boundsData = {
"geometry": {
"type": "Polygon",
"coordinates":
[
polyBounds
]
}
}
Search for electric vehicle charging stations within the reachable range
After you've determined the reachable range (isochrone) for the electric vehicle, you can search for charging stations within that range.
The following script calls the Azure Maps Post Search Inside Geometry API. It searches for charging stations for electric vehicle, within the boundaries of the car's maximum reachable range. Then, the script parses the response to an array of reachable locations.
To search for electric vehicle charging stations within the reachable range, run the following script:
# Search for electric vehicle stations within reachable range.
searchPolyResponse = await (await session.post(url = "https://atlas.microsoft.com/search/geometry/json?subscription-key={}&api-version=1.0&query=electric vehicle station&idxSet=POI&limit=50".format(subscriptionKey), json = boundsData)).json()

reachableLocations = []
for loc in range(len(searchPolyResponse["results"])):
                location = list(searchPolyResponse["results"][loc]["position"].values())
                location[0], location[1] = location[1], location[0]
                reachableLocations.append(location)
Upload the reachable range and charging points
It's helpful to visualize the charging stations and the boundary for the maximum reachable range of the electric vehicle on a map. Follow the steps outlined in the How to create data registry article to upload the boundary data and charging stations data as geojson objects to your Azure storage account then register them in your Azure Maps account. Make sure to make a note of the unique identifier (udid) value, you will need it. The udid is how you reference the geojson objects you uploaded into your Azure storage account from your source code.
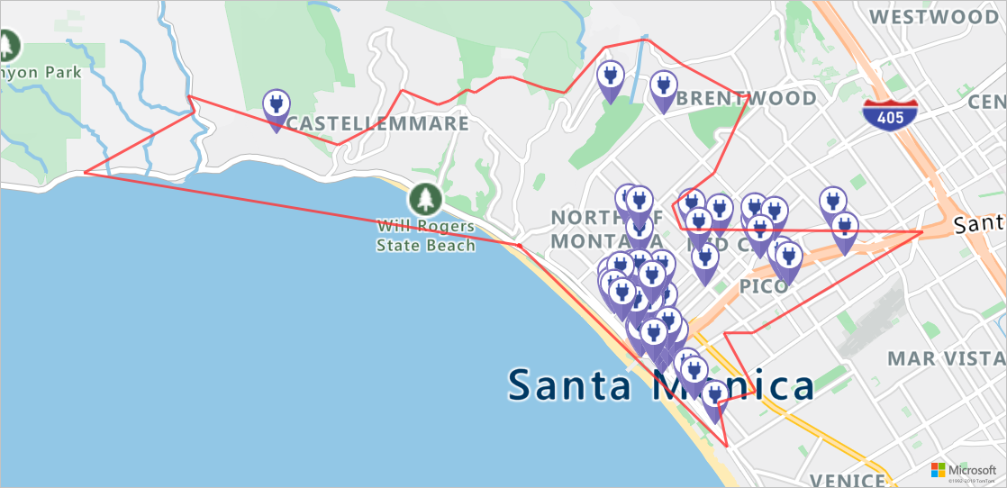
Render the charging stations and reachable range on a map
After you've uploaded the data to the Azure storage account, call the Azure Maps Get Map Image service. This service is used to render the charging points and maximum reachable boundary on the static map image by running the following script:
# Get boundaries for the bounding box.
def getBounds(polyBounds):
    maxLon = max(map(lambda x: x[0], polyBounds))
    minLon = min(map(lambda x: x[0], polyBounds))

    maxLat = max(map(lambda x: x[1], polyBounds))
    minLat = min(map(lambda x: x[1], polyBounds))

    # Buffer the bounding box by 10 percent to account for the pixel size of pins at the ends of the route.
    lonBuffer = (maxLon-minLon)*0.1
    minLon -= lonBuffer
    maxLon += lonBuffer

    latBuffer = (maxLat-minLat)*0.1
    minLat -= latBuffer
    maxLat += latBuffer

    return [minLon, maxLon, minLat, maxLat]

minLon, maxLon, minLat, maxLat = getBounds(polyBounds)

path = "lcff3333|lw3|la0.80|fa0.35||udid-{}".format(rangeUdid)
pins = "custom|an15 53||udid-{}||https://raw.githubusercontent.com/Azure-Samples/AzureMapsCodeSamples/master/AzureMapsCodeSamples/Common/images/icons/ev_pin.png".format(poiUdid)

encodedPins = urllib.parse.quote(pins, safe='')

# Render the range and electric vehicle charging points on the map.
staticMapResponse =  await session.get("https://atlas.microsoft.com/map/static/png?api-version=2022-08-01&subscription-key={}&pins={}&path={}&bbox={}&zoom=12".format(subscriptionKey,encodedPins,path,str(minLon)+", "+str(minLat)+", "+str(maxLon)+", "+str(maxLat)))

poiRangeMap = await staticMapResponse.content.read()

display(Image(poiRangeMap))
Find the optimal charging station
First, you want to determine all the potential charging stations within the reachable range. Then, you want to know which of them can be reached in a minimum amount of time.
The following script calls the Azure Maps Matrix Routing API. It returns the specified vehicle location, the travel time, and the distance to each charging station. The script in the next cell parses the response to locate the closest reachable charging station with respect to time.
To find the closest reachable charging station that can be reached in the least amount of time, run the script in the following cell:
locationData = {
            "origins": {
              "type": "MultiPoint",
              "coordinates": [[currentLocation[1],currentLocation[0]]]
            },
            "destinations": {
              "type": "MultiPoint",
              "coordinates": reachableLocations
            }
         }

# Get the travel time and distance to each specified charging station.
searchPolyRes = await (await session.post(url = "https://atlas.microsoft.com/route/matrix/json?subscription-key={}&api-version=1.0&routeType=shortest&waitForResults=true".format(subscriptionKey), json = locationData)).json()

distances = []
for dist in range(len(reachableLocations)):
    distances.append(searchPolyRes["matrix"][0][dist]["response"]["routeSummary"]["travelTimeInSeconds"])

minDistLoc = []
minDistIndex = distances.index(min(distances))
minDistLoc.extend([reachableLocations[minDistIndex][1], reachableLocations[minDistIndex][0]])
closestChargeLoc = ",".join(str(i) for i in minDistLoc)
Calculate the route to the closest charging station
Now that you've found the closest charging station, you can call the Get Route Directions API to request the detailed route from the electric vehicle's current location to the charging station.
To get the route to the charging station and to parse the response to create a geojson object that represents the route, run the script in the following cell:
# Get the route from the electric vehicle's current location to the closest charging station.
routeResponse = await (await session.get("https://atlas.microsoft.com/route/directions/json?subscription-key={}&api-version=1.0&query={}:{}".format(subscriptionKey, str(currentLocation[0])+","+str(currentLocation[1]), closestChargeLoc))).json()

route = []
for loc in range(len(routeResponse["routes"][0]["legs"][0]["points"])):
                location = list(routeResponse["routes"][0]["legs"][0]["points"][loc].values())
                location[0], location[1] = location[1], location[0]
                route.append(location)

routeData = {
         "type": "LineString",
         "coordinates": route
     }
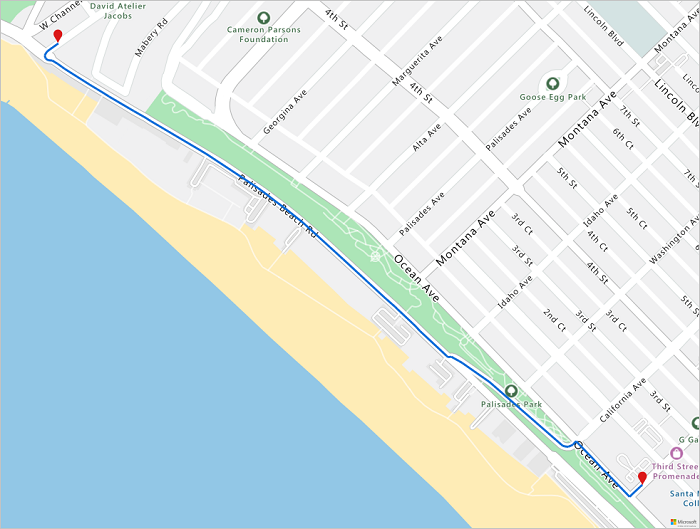
Visualize the route
To help visualize the route, follow the steps outlined in the How to create data registry article to upload the route data as a geojson object to your Azure storage account then register it in your Azure Maps account. Make sure to make a note of the unique identifier (udid) value, you will need it. The udid is how you reference the geojson objects you uploaded into your Azure storage account from your source code. Then, call the rendering service, Get Map Image API, to render the route on the map, and visualize it.
To get an image for the rendered route on the map, run the following script:
# Upload the route data to Azure Maps Data service .
routeUploadRequest = await session.post("https://atlas.microsoft.com/mapData?subscription-key={}&api-version=2.0&dataFormat=geojson".format(subscriptionKey), json = routeData)

udidRequestURI = routeUploadRequest.headers["Location"]+"&subscription-key={}".format(subscriptionKey)

while True:
    udidRequest = await (await session.get(udidRequestURI)).json()
    if 'udid' in udidRequest:
        break
    else:
        time.sleep(0.2)

udid = udidRequest["udid"]

destination = route[-1]

destination[1], destination[0] = destination[0], destination[1]

path = "lc0f6dd9|lw6||udid-{}".format(udid)
pins = "default|codb1818||{} {}|{} {}".format(str(currentLocation[1]),str(currentLocation[0]),destination[1],destination[0])


# Get boundaries for the bounding box.
minLat, maxLat = (float(destination[0]),currentLocation[0]) if float(destination[0])<currentLocation[0] else (currentLocation[0], float(destination[0]))
minLon, maxLon = (float(destination[1]),currentLocation[1]) if float(destination[1])<currentLocation[1] else (currentLocation[1], float(destination[1]))

# Buffer the bounding box by 10 percent to account for the pixel size of pins at the ends of the route.
lonBuffer = (maxLon-minLon)*0.1
minLon -= lonBuffer
maxLon += lonBuffer

latBuffer = (maxLat-minLat)*0.1
minLat -= latBuffer
maxLat += latBuffer

# Render the route on the map.
staticMapResponse = await session.get("https://atlas.microsoft.com/map/static/png?api-version=2022-08-01&subscription-key={}&&path={}&pins={}&bbox={}&zoom=16".format(subscriptionKey,path,pins,str(minLon)+", "+str(minLat)+", "+str(maxLon)+", "+str(maxLat)))

staticMapImage = await staticMapResponse.content.read()

await session.close()
display(Image(staticMapImage))
In this tutorial, you learned how to call Azure Maps REST APIs directly and visualize Azure Maps data by using Python.
To explore the Azure Maps APIs that are used in this tutorial, see:
- Get Route Range
- Post Search Inside Geometry
- Render - Get Map Image
- Post Route Matrix
- Get Route Directions
- Azure Maps REST APIs
Clean up resources
There are no resources that require cleanup.
Next steps
To learn more about Azure Notebooks, see
Feedback
Coming soon: Throughout 2024 we will be phasing out GitHub Issues as the feedback mechanism for content and replacing it with a new feedback system. For more information see: https://aka.ms/ContentUserFeedback.
Submit and view feedback for