Query logs from Container insights
Container insights collects performance metrics, inventory data, and health state information from container hosts and containers. The data is collected every three minutes and forwarded to the Log Analytics workspace in Azure Monitor where it's available for log queries using Log Analytics in Azure Monitor.
You can apply this data to scenarios that include migration planning, capacity analysis, discovery, and on-demand performance troubleshooting. Azure Monitor Logs can help you look for trends, diagnose bottlenecks, forecast, or correlate data that can help you determine whether the current cluster configuration is performing optimally.
For information on using these queries, see Using queries in Azure Monitor Log Analytics. For a complete tutorial on using Log Analytics to run queries and work with their results, see Log Analytics tutorial.
Important
The queries in this article depend on data collected by Container insights and stored in a Log Analytics workspace. If you've modified the default data collection settings, the queries might not return the expected results. Most notably, if you've disabled collection of performance data since you've enabled Prometheus metrics for the cluster, any queries using the Perf table won't return results.
See Configure data collection in Container insights using data collection rule for preset configurations including disabling performance data collection. See Configure data collection in Container insights using ConfigMap for further data collection options.
Open Log Analytics
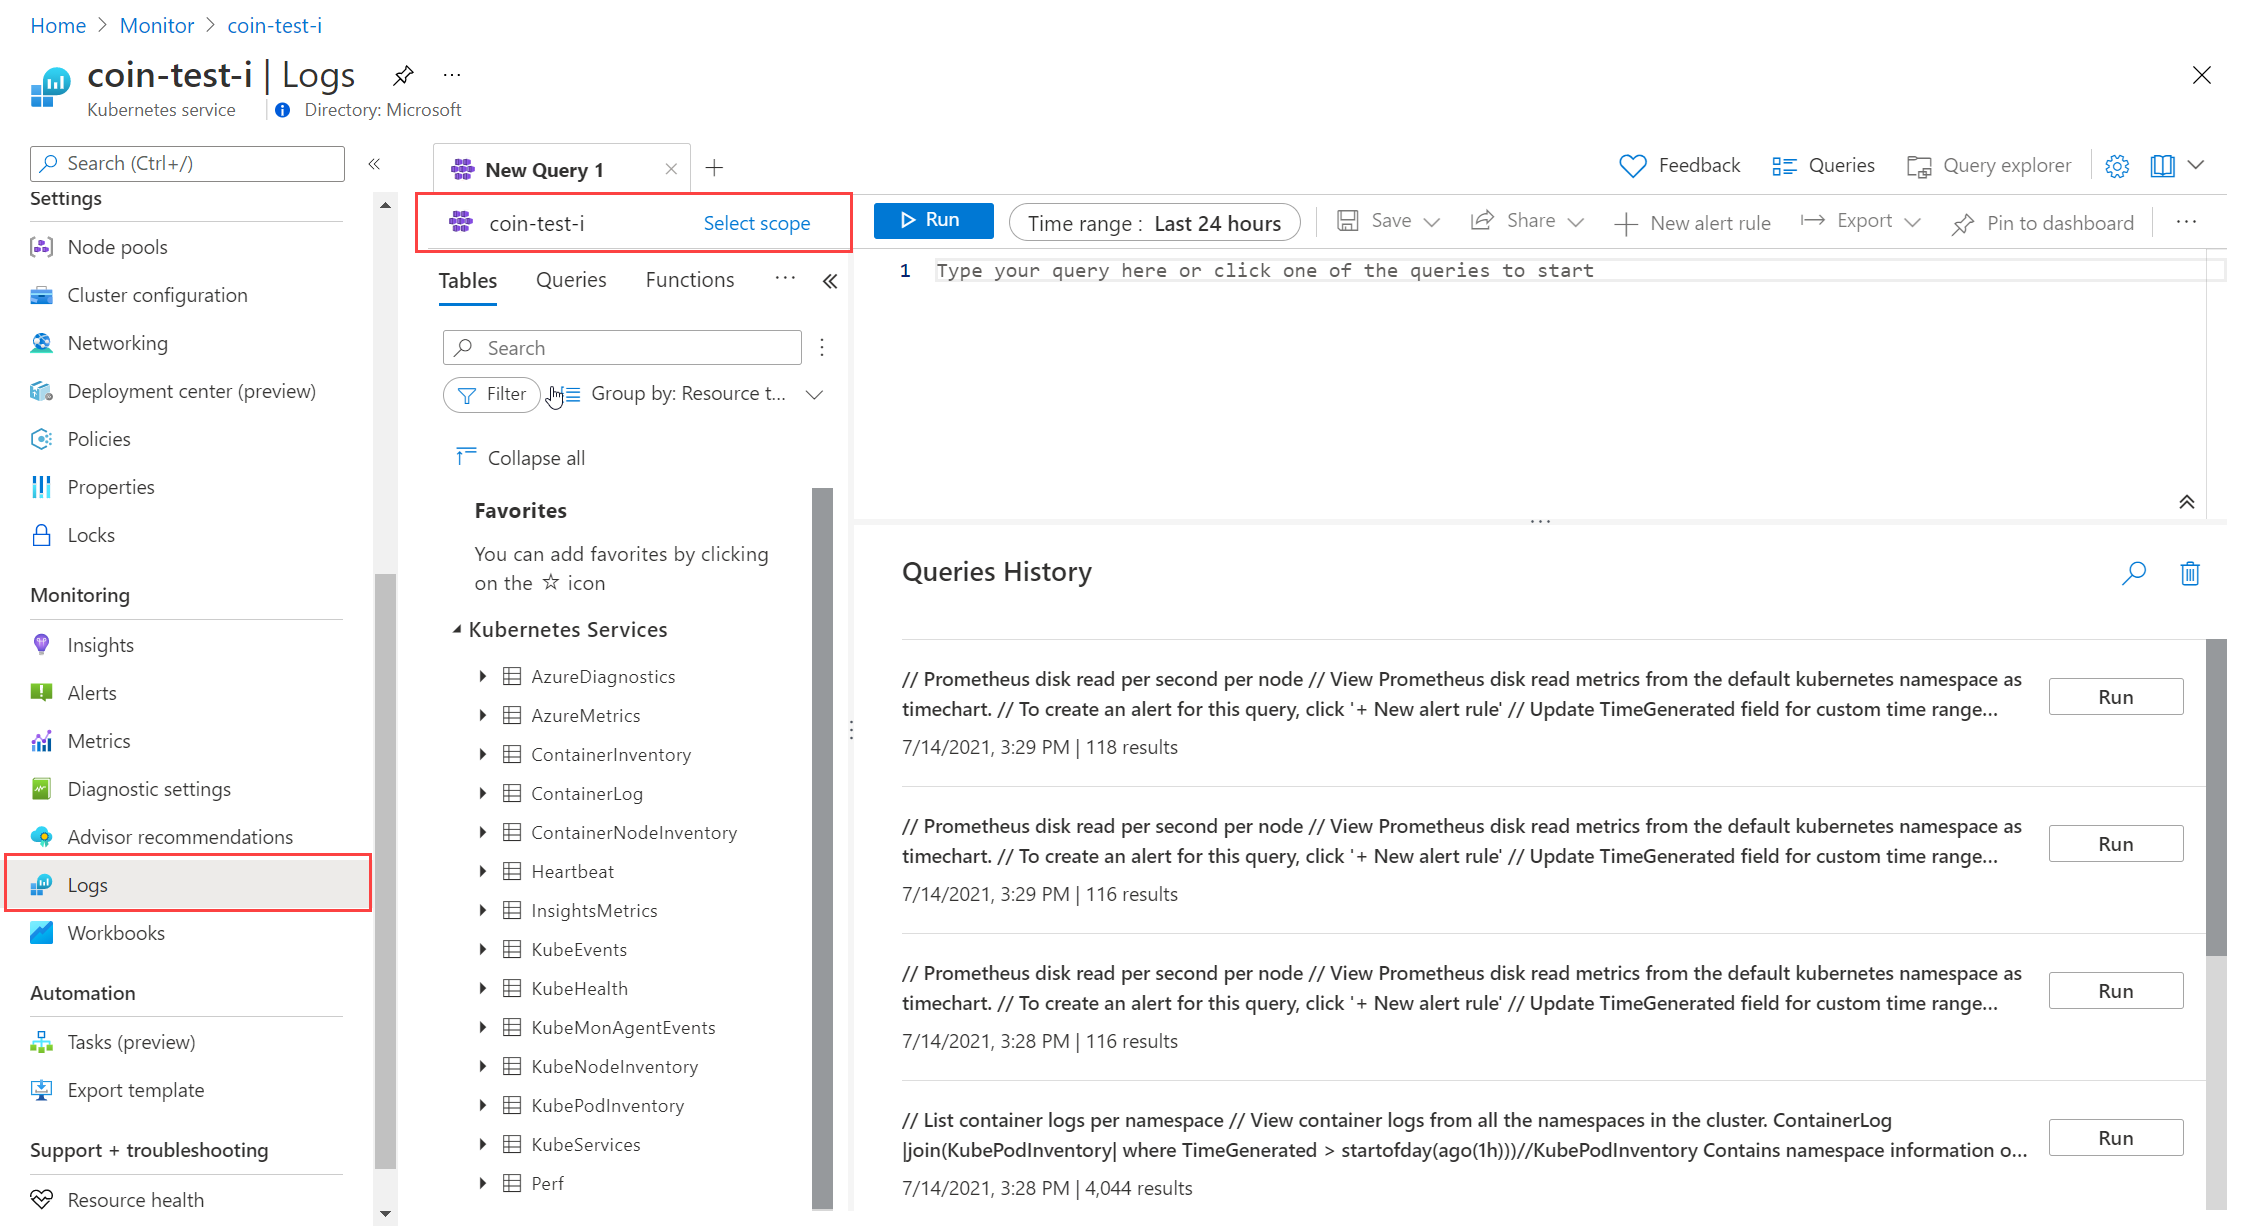
There are multiple options for starting Log Analytics. Each option starts with a different scope. For access to all data in the workspace, on the Monitoring menu, select Logs. To limit the data to a single Kubernetes cluster, select Logs from that cluster's menu.
Existing log queries
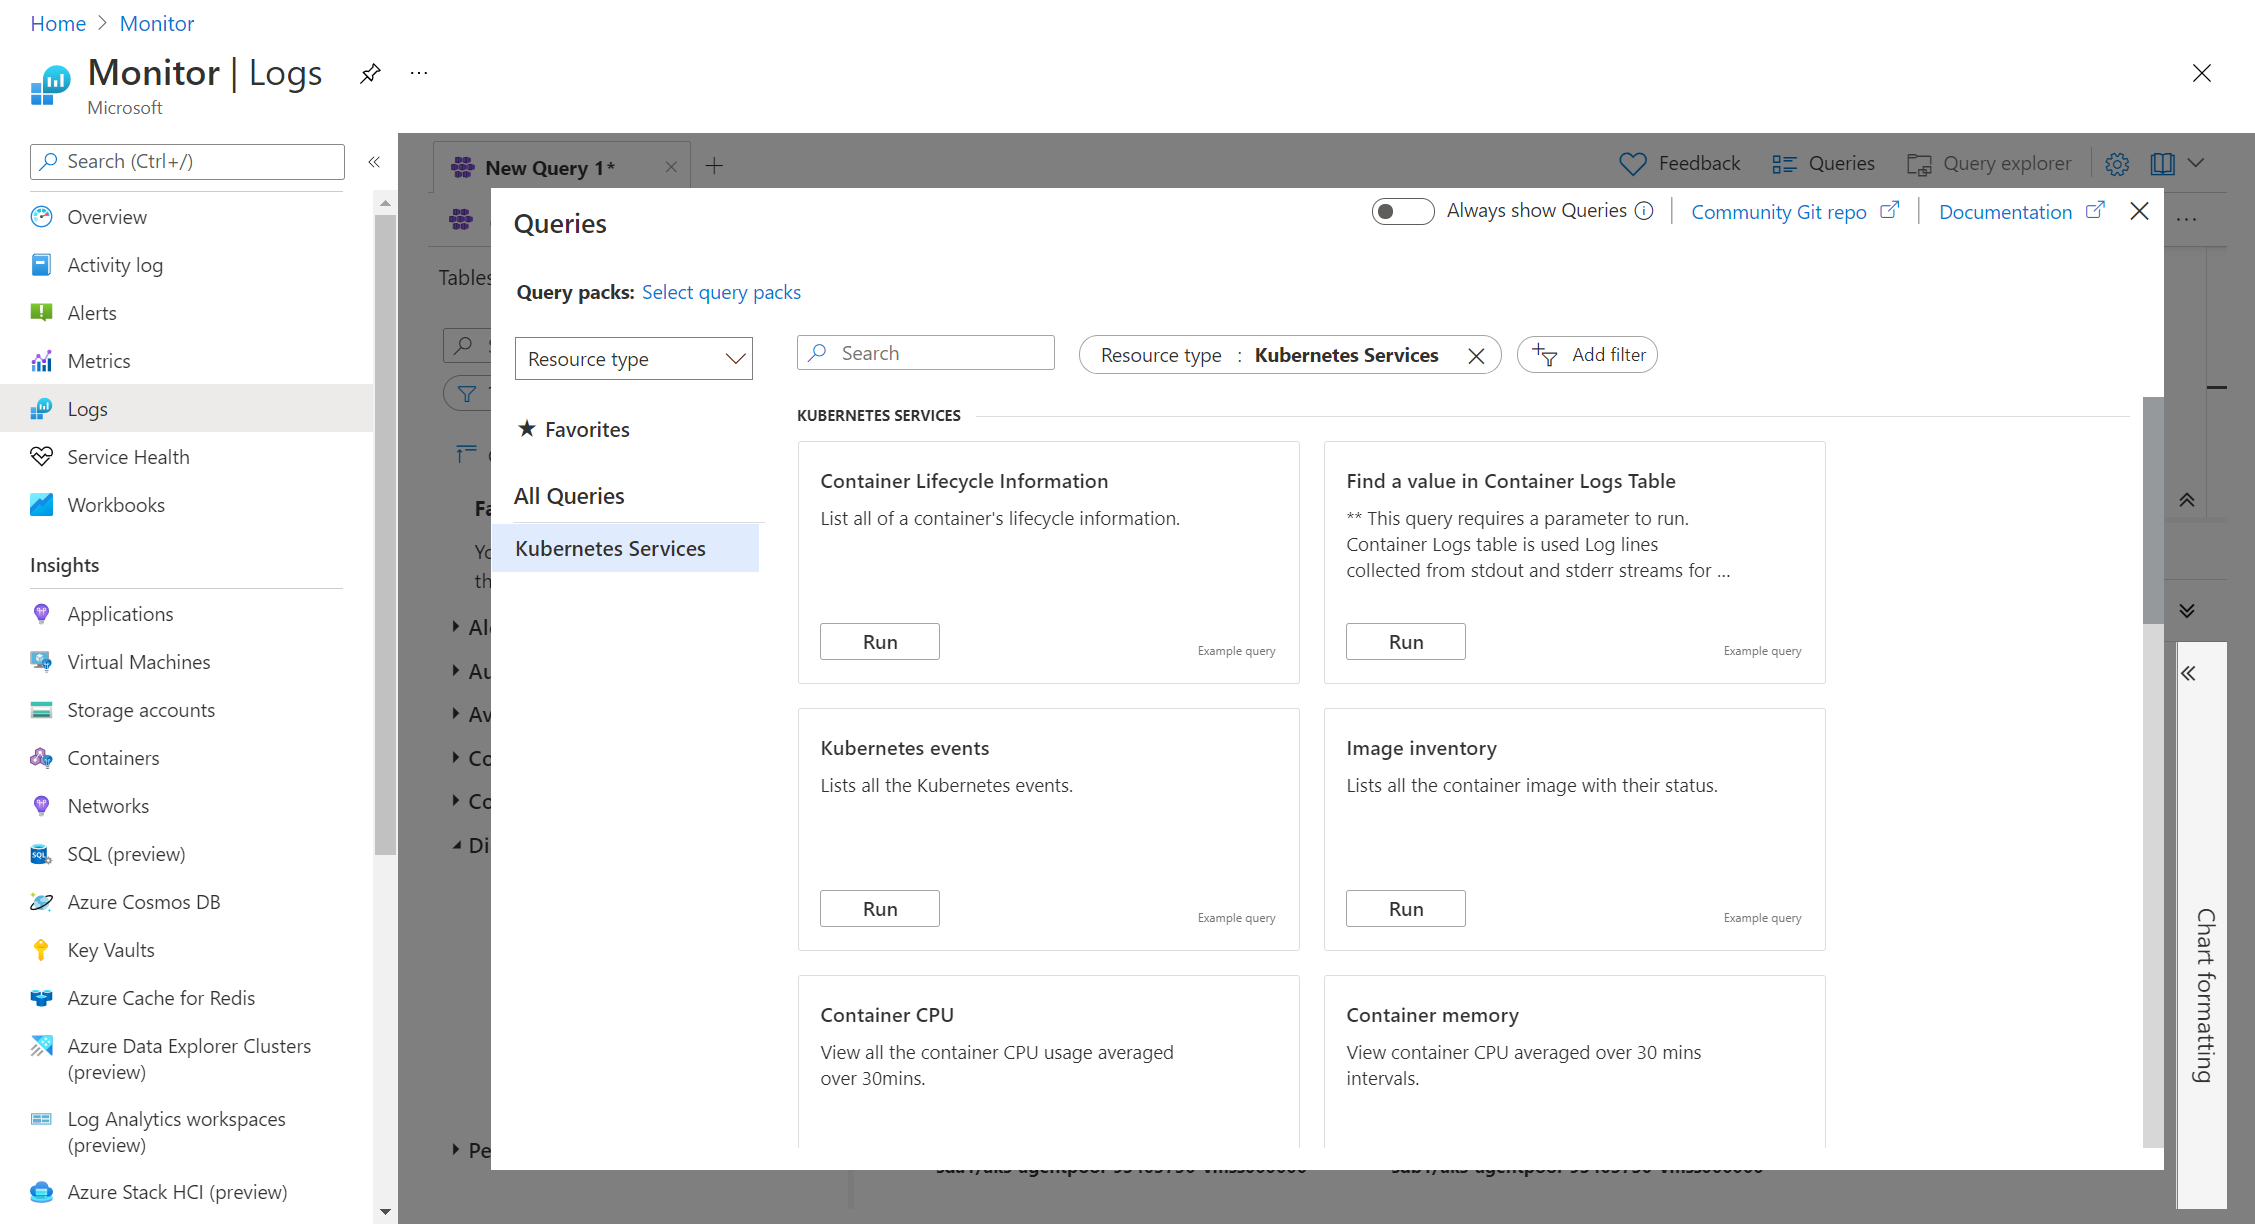
You don't necessarily need to understand how to write a log query to use Log Analytics. You can select from multiple prebuilt queries. You can either run the queries without modification or use them as a start to a custom query. Select Queries at the top of the Log Analytics screen, and view queries with a Resource type of Kubernetes Services.
Container tables
For a list of tables and their detailed descriptions used by Container insights, see the Azure Monitor table reference. All these tables are available for log queries.
Example log queries
It's often useful to build queries that start with an example or two and then modify them to fit your requirements. To help build more advanced queries, you can experiment with the following sample queries.
List all of a container's lifecycle information
ContainerInventory
| project Computer, Name, Image, ImageTag, ContainerState, CreatedTime, StartedTime, FinishedTime
| render table
Kubernetes events
Note
By default, Normal event types aren't collected, so you won't see them when you query the KubeEvents table unless the collect_all_kube_events ConfigMap setting is enabled. If you need to collect Normal events, enable collect_all_kube_events setting in the container-azm-ms-agentconfig ConfigMap. See Configure agent data collection for Container insights for information on how to configure the ConfigMap.
KubeEvents
| where not(isempty(Namespace))
| sort by TimeGenerated desc
| render table
Container CPU
Perf
| where ObjectName == "K8SContainer" and CounterName == "cpuUsageNanoCores"
| summarize AvgCPUUsageNanoCores = avg(CounterValue) by bin(TimeGenerated, 30m), InstanceName
Container memory
This query uses memoryRssBytes which is only available for Linux nodes.
Perf
| where ObjectName == "K8SContainer" and CounterName == "memoryRssBytes"
| summarize AvgUsedRssMemoryBytes = avg(CounterValue) by bin(TimeGenerated, 30m), InstanceName
Requests per minute with custom metrics
InsightsMetrics
| where Name == "requests_count"
| summarize Val=any(Val) by TimeGenerated=bin(TimeGenerated, 1m)
| sort by TimeGenerated asc
| project RequestsPerMinute = Val - prev(Val), TimeGenerated
| render barchart
Pods by name and namespace
let startTimestamp = ago(1h);
KubePodInventory
| where TimeGenerated > startTimestamp
| project ContainerID, PodName=Name, Namespace
| where PodName contains "name" and Namespace startswith "namespace"
| distinct ContainerID, PodName
| join
(
    ContainerLog
    | where TimeGenerated > startTimestamp
)
on ContainerID
// at this point before the next pipe, columns from both tables are available to be "projected". Due to both
// tables having a "Name" column, we assign an alias as PodName to one column which we actually want
| project TimeGenerated, PodName, LogEntry, LogEntrySource
| summarize by TimeGenerated, LogEntry
| order by TimeGenerated desc
Pod scale-out (HPA)
This query returns the number of scaled-out replicas in each deployment. It calculates the scale-out percentage with the maximum number of replicas configured in HPA.
let _minthreshold = 70; // minimum threshold goes here if you want to setup as an alert
let _maxthreshold = 90; // maximum threshold goes here if you want to setup as an alert
let startDateTime = ago(60m);
KubePodInventory
| where TimeGenerated >= startDateTime
| where Namespace !in('default', 'kube-system') // List of non system namespace filter goes here.
| extend labels = todynamic(PodLabel)
| extend deployment_hpa = reverse(substring(reverse(ControllerName), indexof(reverse(ControllerName), "-") + 1))
| distinct tostring(deployment_hpa)
| join kind=inner (InsightsMetrics
    | where TimeGenerated > startDateTime
    | where Name == 'kube_hpa_status_current_replicas'
    | extend pTags = todynamic(Tags) //parse the tags for values
    | extend ns = todynamic(pTags.k8sNamespace) //parse namespace value from tags
    | extend deployment_hpa = todynamic(pTags.targetName) //parse HPA target name from tags
    | extend max_reps = todynamic(pTags.spec_max_replicas) // Parse maximum replica settings from HPA deployment
    | extend desired_reps = todynamic(pTags.status_desired_replicas) // Parse desired replica settings from HPA deployment
    | summarize arg_max(TimeGenerated, *) by tostring(ns), tostring(deployment_hpa), Cluster=toupper(tostring(split(_ResourceId, '/')[8])), toint(desired_reps), toint(max_reps), scale_out_percentage=(desired_reps * 100 / max_reps)
    //| where scale_out_percentage > _minthreshold and scale_out_percentage <= _maxthreshold
    )
    on deployment_hpa
Nodepool scale-outs
This query returns the number of active nodes in each node pool. It calculates the number of available active nodes and the max node configuration in the autoscaler settings to determine the scale-out percentage. See commented lines in the query to use it for a number of results alert rule.
let nodepoolMaxnodeCount = 10; // the maximum number of nodes in your auto scale setting goes here.
let _minthreshold = 20;
let _maxthreshold = 90;
let startDateTime = 60m;
KubeNodeInventory
| where TimeGenerated >= ago(startDateTime)
| extend nodepoolType = todynamic(Labels) //Parse the labels to get the list of node pool types
| extend nodepoolName = todynamic(nodepoolType[0].agentpool) // parse the label to get the nodepool name or set the specific nodepool name (like nodepoolName = 'agentpool)'
| summarize nodeCount = count(Computer) by ClusterName, tostring(nodepoolName), TimeGenerated
//(Uncomment the below two lines to set this as a log search alert)
//| extend scaledpercent = iff(((nodeCount * 100 / nodepoolMaxnodeCount) >= _minthreshold and (nodeCount * 100 / nodepoolMaxnodeCount) < _maxthreshold), "warn", "normal")
//| where scaledpercent == 'warn'
| summarize arg_max(TimeGenerated, *) by nodeCount, ClusterName, tostring(nodepoolName)
| project ClusterName,
    TotalNodeCount= strcat("Total Node Count: ", nodeCount),
    ScaledOutPercentage = (nodeCount * 100 / nodepoolMaxnodeCount),
    TimeGenerated,
    nodepoolName
System containers (replicaset) availability
This query returns the system containers (replicasets) and reports the unavailable percentage. See commented lines in the query to use it for a number of results alert rule.
let startDateTime = 5m; // the minimum time interval goes here
let _minalertThreshold = 50; //Threshold for minimum and maximum unavailable or not running containers
let _maxalertThreshold = 70;
KubePodInventory
| where TimeGenerated >= ago(startDateTime)
| distinct ClusterName, TimeGenerated
| summarize Clustersnapshot = count() by ClusterName
| join kind=inner (
    KubePodInventory
    | where TimeGenerated >= ago(startDateTime)
    | where Namespace in('default', 'kube-system') and ControllerKind == 'ReplicaSet' // the system namespace filter goes here
    | distinct ClusterName, Computer, PodUid, TimeGenerated, PodStatus, ServiceName, PodLabel, Namespace, ContainerStatus
    | summarize arg_max(TimeGenerated, *), TotalPODCount = count(), podCount = sumif(1, PodStatus == 'Running' or PodStatus != 'Running'), containerNotrunning = sumif(1, ContainerStatus != 'running')
        by ClusterName, TimeGenerated, ServiceName, PodLabel, Namespace
    )
    on ClusterName
| project ClusterName, ServiceName, podCount, containerNotrunning, containerNotrunningPercent = (containerNotrunning * 100 / podCount), TimeGenerated, PodStatus, PodLabel, Namespace, Environment = tostring(split(ClusterName, '-')[3]), Location = tostring(split(ClusterName, '-')[4]), ContainerStatus
//Uncomment the below line to set for automated alert
//| where PodStatus == "Running" and containerNotrunningPercent > _minalertThreshold and containerNotrunningPercent < _maxalertThreshold
| summarize arg_max(TimeGenerated, *), c_entry=count() by PodLabel, ServiceName, ClusterName
//Below lines are to parse the labels to identify the impacted service/component name
| extend parseLabel = replace(@'k8s-app', @'k8sapp', PodLabel)
| extend parseLabel = replace(@'app.kubernetes.io\\/component', @'appkubernetesiocomponent', parseLabel)
| extend parseLabel = replace(@'app.kubernetes.io\\/instance', @'appkubernetesioinstance', parseLabel)
| extend tags = todynamic(parseLabel)
| extend tag01 = todynamic(tags[0].app)
| extend tag02 = todynamic(tags[0].k8sapp)
| extend tag03 = todynamic(tags[0].appkubernetesiocomponent)
| extend tag04 = todynamic(tags[0].aadpodidbinding)
| extend tag05 = todynamic(tags[0].appkubernetesioinstance)
| extend tag06 = todynamic(tags[0].component)
| project ClusterName, TimeGenerated,
    ServiceName = strcat( ServiceName, tag01, tag02, tag03, tag04, tag05, tag06),
    ContainerUnavailable = strcat("Unavailable Percentage: ", containerNotrunningPercent),
    PodStatus = strcat("PodStatus: ", PodStatus),
    ContainerStatus = strcat("Container Status: ", ContainerStatus)
System containers (daemonsets) availability
This query returns the system containers (daemonsets) and reports the unavailable percentage. See commented lines in the query to use it for a number of results alert rule.
let startDateTime = 5m; // the minimum time interval goes here
let _minalertThreshold = 50; //Threshold for minimum and maximum unavailable or not running containers
let _maxalertThreshold = 70;
KubePodInventory
| where TimeGenerated >= ago(startDateTime)
| distinct ClusterName, TimeGenerated
| summarize Clustersnapshot = count() by ClusterName
| join kind=inner (
    KubePodInventory
    | where TimeGenerated >= ago(startDateTime)
    | where Namespace in('default', 'kube-system') and ControllerKind == 'DaemonSet' // the system namespace filter goes here
    | distinct ClusterName, Computer, PodUid, TimeGenerated, PodStatus, ServiceName, PodLabel, Namespace, ContainerStatus
    | summarize arg_max(TimeGenerated, *), TotalPODCount = count(), podCount = sumif(1, PodStatus == 'Running' or PodStatus != 'Running'), containerNotrunning = sumif(1, ContainerStatus != 'running')
        by ClusterName, TimeGenerated, ServiceName, PodLabel, Namespace
    )
    on ClusterName
| project ClusterName, ServiceName, podCount, containerNotrunning, containerNotrunningPercent = (containerNotrunning * 100 / podCount), TimeGenerated, PodStatus, PodLabel, Namespace, Environment = tostring(split(ClusterName, '-')[3]), Location = tostring(split(ClusterName, '-')[4]), ContainerStatus
//Uncomment the below line to set for automated alert
//| where PodStatus == "Running" and containerNotrunningPercent > _minalertThreshold and containerNotrunningPercent < _maxalertThreshold
| summarize arg_max(TimeGenerated, *), c_entry=count() by PodLabel, ServiceName, ClusterName
//Below lines are to parse the labels to identify the impacted service/component name
| extend parseLabel = replace(@'k8s-app', @'k8sapp', PodLabel)
| extend parseLabel = replace(@'app.kubernetes.io\\/component', @'appkubernetesiocomponent', parseLabel)
| extend parseLabel = replace(@'app.kubernetes.io\\/instance', @'appkubernetesioinstance', parseLabel)
| extend tags = todynamic(parseLabel)
| extend tag01 = todynamic(tags[0].app)
| extend tag02 = todynamic(tags[0].k8sapp)
| extend tag03 = todynamic(tags[0].appkubernetesiocomponent)
| extend tag04 = todynamic(tags[0].aadpodidbinding)
| extend tag05 = todynamic(tags[0].appkubernetesioinstance)
| extend tag06 = todynamic(tags[0].component)
| project ClusterName, TimeGenerated,
    ServiceName = strcat( ServiceName, tag01, tag02, tag03, tag04, tag05, tag06),
    ContainerUnavailable = strcat("Unavailable Percentage: ", containerNotrunningPercent),
    PodStatus = strcat("PodStatus: ", PodStatus),
    ContainerStatus = strcat("Container Status: ", ContainerStatus)
Container logs
Container logs for AKS are stored in the ContainerLogV2 table. You can run the following sample queries to look for the stderr/stdout log output from target pods, deployments, or namespaces.
Container logs for a specific pod, namespace, and container
ContainerLogV2
| where _ResourceId =~ "clusterResourceID" //update with resource ID
| where PodNamespace == "podNameSpace" //update with target namespace
| where PodName == "podName" //update with target pod
| where ContainerName == "containerName" //update with target container
| project TimeGenerated, Computer, ContainerId, LogMessage, LogSource
Container logs for a specific deployment
let KubePodInv = KubePodInventory
| where _ResourceId =~ "clusterResourceID" //update with resource ID
| where Namespace == "deploymentNamespace" //update with target namespace
| where ControllerKind == "ReplicaSet"
| extend deployment = reverse(substring(reverse(ControllerName), indexof(reverse(ControllerName), "-") + 1))
| where deployment == "deploymentName" //update with target deployment
| extend ContainerId = ContainerID
| summarize arg_max(TimeGenerated, *)  by deployment, ContainerId, PodStatus, ContainerStatus
| project deployment, ContainerId, PodStatus, ContainerStatus;

KubePodInv
| join
(
    ContainerLogV2
  | where TimeGenerated >= startTime and TimeGenerated < endTime
  | where PodNamespace == "deploymentNamespace" //update with target namespace
  | where PodName startswith "deploymentName" //update with target deployment
) on ContainerId
| project TimeGenerated, deployment, PodName, PodStatus, ContainerName, ContainerId, ContainerStatus, LogMessage, LogSource
Container logs for any failed pod in a specific namespace
    let KubePodInv = KubePodInventory
    | where TimeGenerated >= startTime and TimeGenerated < endTime
    | where _ResourceId =~ "clustereResourceID" //update with resource ID
    | where Namespace == "podNamespace" //update with target namespace
    | where PodStatus == "Failed"
    | extend ContainerId = ContainerID
    | summarize arg_max(TimeGenerated, *)  by  ContainerId, PodStatus, ContainerStatus
    | project ContainerId, PodStatus, ContainerStatus;

    KubePodInv
    | join
    (
        ContainerLogV2
    | where TimeGenerated >= startTime and TimeGenerated < endTime
    | where PodNamespace == "podNamespace" //update with target namespace
    ) on ContainerId
    | project TimeGenerated, PodName, PodStatus, ContainerName, ContainerId, ContainerStatus, LogMessage, LogSource
Container insights default visualization queries
These queries are generated from the out of the box visualizations from container insights. You can choose to use these if you have enabled custom cost optimization settings, in lieu of the default charts.
Node count by status
The required tables for this chart include KubeNodeInventory.
 let trendBinSize = 5m;
 let maxListSize = 1000;
 let clusterId = 'clusterResourceID'; //update with resource ID

 let rawData = KubeNodeInventory
| where ClusterId =~ clusterId
| distinct ClusterId, TimeGenerated
| summarize ClusterSnapshotCount = count() by Timestamp = bin(TimeGenerated, trendBinSize), ClusterId
| join hint.strategy=broadcast ( KubeNodeInventory
| where ClusterId =~ clusterId
| summarize TotalCount = count(), ReadyCount = sumif(1, Status contains ('Ready')) by ClusterId, Timestamp = bin(TimeGenerated, trendBinSize)
| extend NotReadyCount = TotalCount - ReadyCount ) on ClusterId, Timestamp
| project ClusterId, Timestamp, TotalCount = todouble(TotalCount) / ClusterSnapshotCount, ReadyCount = todouble(ReadyCount) / ClusterSnapshotCount, NotReadyCount = todouble(NotReadyCount) / ClusterSnapshotCount;

 rawData
| order by Timestamp asc
| summarize makelist(Timestamp, maxListSize), makelist(TotalCount, maxListSize), makelist(ReadyCount, maxListSize), makelist(NotReadyCount, maxListSize) by ClusterId
| join ( rawData
| summarize Avg_TotalCount = avg(TotalCount), Avg_ReadyCount = avg(ReadyCount), Avg_NotReadyCount = avg(NotReadyCount) by ClusterId ) on ClusterId
| project ClusterId, Avg_TotalCount, Avg_ReadyCount, Avg_NotReadyCount, list_Timestamp, list_TotalCount, list_ReadyCount, list_NotReadyCount
Pod count by status
The required tables for this chart include KubePodInventory.
 let trendBinSize = 5m;
 let maxListSize = 1000;
 let clusterId = 'clusterResourceID'; //update with resource ID

 let rawData = KubePodInventory
| where ClusterId =~ clusterId
| distinct ClusterId, TimeGenerated
| summarize ClusterSnapshotCount = count() by bin(TimeGenerated, trendBinSize), ClusterId
| join hint.strategy=broadcast ( KubePodInventory
| where ClusterId =~ clusterId
| summarize PodStatus=any(PodStatus) by TimeGenerated, PodUid, ClusterId
| summarize TotalCount = count(), PendingCount = sumif(1, PodStatus =~ 'Pending'), RunningCount = sumif(1, PodStatus =~ 'Running'), SucceededCount = sumif(1, PodStatus =~ 'Succeeded'), FailedCount = sumif(1, PodStatus =~ 'Failed'), TerminatingCount = sumif(1, PodStatus =~ 'Terminating') by ClusterId, bin(TimeGenerated, trendBinSize) ) on ClusterId, TimeGenerated
| extend UnknownCount = TotalCount - PendingCount - RunningCount - SucceededCount - FailedCount - TerminatingCount
| project ClusterId, Timestamp = TimeGenerated, TotalCount = todouble(TotalCount) / ClusterSnapshotCount, PendingCount = todouble(PendingCount) / ClusterSnapshotCount, RunningCount = todouble(RunningCount) / ClusterSnapshotCount, SucceededCount = todouble(SucceededCount) / ClusterSnapshotCount, FailedCount = todouble(FailedCount) / ClusterSnapshotCount, TerminatingCount = todouble(TerminatingCount) / ClusterSnapshotCount, UnknownCount = todouble(UnknownCount) / ClusterSnapshotCount;

 let rawDataCached = rawData;

 rawDataCached
| order by Timestamp asc
| summarize makelist(Timestamp, maxListSize), makelist(TotalCount, maxListSize), makelist(PendingCount, maxListSize), makelist(RunningCount, maxListSize), makelist(SucceededCount, maxListSize), makelist(FailedCount, maxListSize), makelist(TerminatingCount, maxListSize), makelist(UnknownCount, maxListSize) by ClusterId
| join ( rawDataCached
| summarize Avg_TotalCount = avg(TotalCount), Avg_PendingCount = avg(PendingCount), Avg_RunningCount = avg(RunningCount), Avg_SucceededCount = avg(SucceededCount), Avg_FailedCount = avg(FailedCount), Avg_TerminatingCount = avg(TerminatingCount), Avg_UnknownCount = avg(UnknownCount) by ClusterId ) on ClusterId
| project ClusterId, Avg_TotalCount, Avg_PendingCount, Avg_RunningCount, Avg_SucceededCount, Avg_FailedCount, Avg_TerminatingCount, Avg_UnknownCount, list_Timestamp, list_TotalCount, list_PendingCount, list_RunningCount, list_SucceededCount, list_FailedCount, list_TerminatingCount, list_UnknownCount
List of containers by status
The required tables for this chart include KubePodInventory and Perf.
 let startDateTime = datetime('start time');
 let endDateTime = datetime('end time');
 let trendBinSize = 15m;
 let maxResultCount = 10000;
 let metricUsageCounterName = 'cpuUsageNanoCores';
 let metricLimitCounterName = 'cpuLimitNanoCores';

 let KubePodInventoryTable = KubePodInventory
| where TimeGenerated >= startDateTime
| where TimeGenerated < endDateTime
| where isnotempty(ClusterName)
| where isnotempty(Namespace)
| where isnotempty(Computer)
| project TimeGenerated, ClusterId, ClusterName, Namespace, ServiceName, ControllerName, Node = Computer, Pod = Name, ContainerInstance = ContainerName, ContainerID, ReadySinceNow = format_timespan(endDateTime - ContainerCreationTimeStamp , 'ddd.hh:mm:ss.fff'), Restarts = ContainerRestartCount, Status = ContainerStatus, ContainerStatusReason = columnifexists('ContainerStatusReason', ''), ControllerKind = ControllerKind, PodStatus;

 let startRestart = KubePodInventoryTable
| summarize arg_min(TimeGenerated, *) by Node, ContainerInstance
| where ClusterId =~ 'clusterResourceID' //update with resource ID
| project Node, ContainerInstance, InstanceName = strcat(ClusterId, '/', ContainerInstance), StartRestart = Restarts;

 let IdentityTable = KubePodInventoryTable
| summarize arg_max(TimeGenerated, *) by Node, ContainerInstance
| where ClusterId =~ 'clusterResourceID' //update with resource ID
| project ClusterName, Namespace, ServiceName, ControllerName, Node, Pod, ContainerInstance, InstanceName = strcat(ClusterId, '/', ContainerInstance), ContainerID, ReadySinceNow, Restarts, Status = iff(Status =~ 'running', 0, iff(Status=~'waiting', 1, iff(Status =~'terminated', 2, 3))), ContainerStatusReason, ControllerKind, Containers = 1, ContainerName = tostring(split(ContainerInstance, '/')[1]), PodStatus, LastPodInventoryTimeGenerated = TimeGenerated, ClusterId;

 let CachedIdentityTable = IdentityTable;

 let FilteredPerfTable = Perf
| where TimeGenerated >= startDateTime
| where TimeGenerated < endDateTime
| where ObjectName == 'K8SContainer'
| where InstanceName startswith 'clusterResourceID'
| project Node = Computer, TimeGenerated, CounterName, CounterValue, InstanceName ;

 let CachedFilteredPerfTable = FilteredPerfTable;

 let LimitsTable = CachedFilteredPerfTable
| where CounterName =~ metricLimitCounterName
| summarize arg_max(TimeGenerated, *) by Node, InstanceName
| project Node, InstanceName, LimitsValue = iff(CounterName =~ 'cpuLimitNanoCores', CounterValue/1000000, CounterValue), TimeGenerated;
 let MetaDataTable = CachedIdentityTable
| join kind=leftouter ( LimitsTable ) on Node, InstanceName
| join kind= leftouter ( startRestart ) on Node, InstanceName
| project ClusterName, Namespace, ServiceName, ControllerName, Node, Pod, InstanceName, ContainerID, ReadySinceNow, Restarts, LimitsValue, Status, ContainerStatusReason = columnifexists('ContainerStatusReason', ''), ControllerKind, Containers, ContainerName, ContainerInstance, StartRestart, PodStatus, LastPodInventoryTimeGenerated, ClusterId;

 let UsagePerfTable = CachedFilteredPerfTable
| where CounterName =~ metricUsageCounterName
| project TimeGenerated, Node, InstanceName, CounterValue = iff(CounterName =~ 'cpuUsageNanoCores', CounterValue/1000000, CounterValue);

 let LastRestartPerfTable = CachedFilteredPerfTable
| where CounterName =~ 'restartTimeEpoch'
| summarize arg_max(TimeGenerated, *) by Node, InstanceName
| project Node, InstanceName, UpTime = CounterValue, LastReported = TimeGenerated;

 let AggregationTable = UsagePerfTable
| summarize Aggregation = max(CounterValue) by Node, InstanceName
| project Node, InstanceName, Aggregation;

 let TrendTable = UsagePerfTable
| summarize TrendAggregation = max(CounterValue) by bin(TimeGenerated, trendBinSize), Node, InstanceName
| project TrendTimeGenerated = TimeGenerated, Node, InstanceName , TrendAggregation
| summarize TrendList = makelist(pack("timestamp", TrendTimeGenerated, "value", TrendAggregation)) by Node, InstanceName;

 let containerFinalTable = MetaDataTable
| join kind= leftouter( AggregationTable ) on Node, InstanceName
| join kind = leftouter (LastRestartPerfTable) on Node, InstanceName
| order by Aggregation desc, ContainerName
| join kind = leftouter ( TrendTable) on Node, InstanceName
| extend ContainerIdentity = strcat(ContainerName, ' ', Pod)
| project ContainerIdentity, Status, ContainerStatusReason = columnifexists('ContainerStatusReason', ''), Aggregation, Node, Restarts, ReadySinceNow, TrendList = iif(isempty(TrendList), parse_json('[]'), TrendList), LimitsValue, ControllerName, ControllerKind, ContainerID, Containers, UpTimeNow = datetime_diff('Millisecond', endDateTime, datetime_add('second', toint(UpTime), make_datetime(1970,1,1))), ContainerInstance, StartRestart, LastReportedDelta = datetime_diff('Millisecond', endDateTime, LastReported), PodStatus, InstanceName, Namespace, LastPodInventoryTimeGenerated, ClusterId;
containerFinalTable
| limit 200
List of Controllers by status
The required tables for this chart include KubePodInventory and Perf.
 let endDateTime = datetime('start time');
 let startDateTime = datetime('end time');
 let trendBinSize = 15m;
 let metricLimitCounterName = 'cpuLimitNanoCores';
 let metricUsageCounterName = 'cpuUsageNanoCores';

 let primaryInventory = KubePodInventory
| where TimeGenerated >= startDateTime
| where TimeGenerated < endDateTime
| where isnotempty(ClusterName)
| where isnotempty(Namespace)
| extend Node = Computer
| where ClusterId =~ 'clusterResourceID' //update with resource ID
| project TimeGenerated, ClusterId, ClusterName, Namespace, ServiceName, Node = Computer, ControllerName, Pod = Name, ContainerInstance = ContainerName, ContainerID, InstanceName, PerfJoinKey = strcat(ClusterId, '/', ContainerName), ReadySinceNow = format_timespan(endDateTime - ContainerCreationTimeStamp, 'ddd.hh:mm:ss.fff'), Restarts = ContainerRestartCount, Status = ContainerStatus, ContainerStatusReason = columnifexists('ContainerStatusReason', ''), ControllerKind = ControllerKind, PodStatus, ControllerId = strcat(ClusterId, '/', Namespace, '/', ControllerName);

let podStatusRollup = primaryInventory
| summarize arg_max(TimeGenerated, *) by Pod
| project ControllerId, PodStatus, TimeGenerated
| summarize count() by ControllerId, PodStatus = iif(TimeGenerated < ago(30m), 'Unknown', PodStatus)
| summarize PodStatusList = makelist(pack('Status', PodStatus, 'Count', count_)) by ControllerId;

let latestContainersByController = primaryInventory
| where isnotempty(Node)
| summarize arg_max(TimeGenerated, *) by PerfJoinKey
| project ControllerId, PerfJoinKey;

let filteredPerformance = Perf
| where TimeGenerated >= startDateTime
| where TimeGenerated < endDateTime
| where ObjectName == 'K8SContainer'
| where InstanceName startswith 'clusterResourceID' //update with resource ID
| project TimeGenerated, CounterName, CounterValue, InstanceName, Node = Computer ;

let metricByController = filteredPerformance
| where CounterName =~ metricUsageCounterName
| extend PerfJoinKey = InstanceName
| summarize Value = percentile(CounterValue, 95) by PerfJoinKey, CounterName
| join (latestContainersByController) on PerfJoinKey
| summarize Value = sum(Value) by ControllerId, CounterName
| project ControllerId, CounterName, AggregationValue = iff(CounterName =~ 'cpuUsageNanoCores', Value/1000000, Value);

let containerCountByController = latestContainersByController
| summarize ContainerCount = count() by ControllerId;

let restartCountsByController = primaryInventory
| summarize Restarts = max(Restarts) by ControllerId;

let oldestRestart = primaryInventory
| summarize ReadySinceNow = min(ReadySinceNow) by ControllerId;

let trendLineByController = filteredPerformance
| where CounterName =~ metricUsageCounterName
| extend PerfJoinKey = InstanceName
| summarize Value = percentile(CounterValue, 95) by bin(TimeGenerated, trendBinSize), PerfJoinKey, CounterName
| order by TimeGenerated asc
| join kind=leftouter (latestContainersByController) on PerfJoinKey
| summarize Value=sum(Value) by ControllerId, TimeGenerated, CounterName
| project TimeGenerated, Value = iff(CounterName =~ 'cpuUsageNanoCores', Value/1000000, Value), ControllerId
| summarize TrendList = makelist(pack("timestamp", TimeGenerated, "value", Value)) by ControllerId;

let latestLimit = filteredPerformance
| where CounterName =~ metricLimitCounterName
| extend PerfJoinKey = InstanceName
| summarize arg_max(TimeGenerated, *) by PerfJoinKey
| join kind=leftouter (latestContainersByController) on PerfJoinKey
| summarize Value = sum(CounterValue) by ControllerId, CounterName
| project ControllerId, LimitValue = iff(CounterName =~ 'cpuLimitNanoCores', Value/1000000, Value);

let latestTimeGeneratedByController = primaryInventory
| summarize arg_max(TimeGenerated, *) by ControllerId
| project ControllerId, LastTimeGenerated = TimeGenerated;

primaryInventory
| distinct ControllerId, ControllerName, ControllerKind, Namespace
| join kind=leftouter (podStatusRollup) on ControllerId
| join kind=leftouter (metricByController) on ControllerId
| join kind=leftouter (containerCountByController) on ControllerId
| join kind=leftouter (restartCountsByController) on ControllerId
| join kind=leftouter (oldestRestart) on ControllerId
| join kind=leftouter (trendLineByController) on ControllerId
| join kind=leftouter (latestLimit) on ControllerId
| join kind=leftouter (latestTimeGeneratedByController) on ControllerId
| project ControllerId, ControllerName, ControllerKind, PodStatusList, AggregationValue, ContainerCount = iif(isempty(ContainerCount), 0, ContainerCount), Restarts, ReadySinceNow, Node = '-', TrendList, LimitValue, LastTimeGenerated, Namespace
| limit 250;
List of Nodes by status
The required tables for this chart include KubeNodeInventory, KubePodInventory, and Perf.
 let endDateTime = datetime('start time');
 let startDateTime = datetime('end time');
 let binSize = 15m;
 let limitMetricName = 'cpuCapacityNanoCores';
 let usedMetricName = 'cpuUsageNanoCores';

 let materializedNodeInventory = KubeNodeInventory
| where TimeGenerated < endDateTime
| where TimeGenerated >= startDateTime
| project ClusterName, ClusterId, Node = Computer, TimeGenerated, Status, NodeName = Computer, NodeId = strcat(ClusterId, '/', Computer), Labels
| where ClusterId =~ 'clusterResourceID'; //update with resource ID

 let materializedPerf = Perf
| where TimeGenerated < endDateTime
| where TimeGenerated >= startDateTime
| where ObjectName == 'K8SNode'
| extend NodeId = InstanceName;

 let materializedPodInventory = KubePodInventory
| where TimeGenerated < endDateTime
| where TimeGenerated >= startDateTime
| where isnotempty(ClusterName)
| where isnotempty(Namespace)
| where ClusterId =~ 'clusterResourceID'; //update with resource ID

 let inventoryOfCluster = materializedNodeInventory
| summarize arg_max(TimeGenerated, Status) by ClusterName, ClusterId, NodeName, NodeId;

 let labelsByNode = materializedNodeInventory
| summarize arg_max(TimeGenerated, Labels) by ClusterName, ClusterId, NodeName, NodeId;

 let countainerCountByNode = materializedPodInventory
| project ContainerName, NodeId = strcat(ClusterId, '/', Computer)
| distinct NodeId, ContainerName
| summarize ContainerCount = count() by NodeId;

 let latestUptime = materializedPerf
| where CounterName == 'restartTimeEpoch'
| summarize arg_max(TimeGenerated, CounterValue) by NodeId
| extend UpTimeMs = datetime_diff('Millisecond', endDateTime, datetime_add('second', toint(CounterValue), make_datetime(1970,1,1)))
| project NodeId, UpTimeMs;

 let latestLimitOfNodes = materializedPerf
| where CounterName == limitMetricName
| summarize CounterValue = max(CounterValue) by NodeId
| project NodeId, LimitValue = CounterValue;

 let actualUsageAggregated = materializedPerf
| where CounterName == usedMetricName
| summarize Aggregation = percentile(CounterValue, 95) by NodeId //This line updates to the desired aggregation
| project NodeId, Aggregation;

 let aggregateTrendsOverTime = materializedPerf
| where CounterName == usedMetricName
| summarize TrendAggregation = percentile(CounterValue, 95) by NodeId, bin(TimeGenerated, binSize) //This line updates to the desired aggregation
| project NodeId, TrendAggregation, TrendDateTime = TimeGenerated;

 let unscheduledPods = materializedPodInventory
| where isempty(Computer)
| extend Node = Computer
| where isempty(ContainerStatus)
| where PodStatus == 'Pending'
| order by TimeGenerated desc
| take 1
| project ClusterName, NodeName = 'unscheduled', LastReceivedDateTime = TimeGenerated, Status = 'unscheduled', ContainerCount = 0, UpTimeMs = '0', Aggregation = '0', LimitValue = '0', ClusterId;

 let scheduledPods = inventoryOfCluster
| join kind=leftouter (aggregateTrendsOverTime) on NodeId
| extend TrendPoint = pack("TrendTime", TrendDateTime, "TrendAggregation", TrendAggregation)
| summarize make_list(TrendPoint) by NodeId, NodeName, Status
| join kind=leftouter (labelsByNode) on NodeId
| join kind=leftouter (countainerCountByNode) on NodeId
| join kind=leftouter (latestUptime) on NodeId
| join kind=leftouter (latestLimitOfNodes) on NodeId
| join kind=leftouter (actualUsageAggregated) on NodeId
| project ClusterName, NodeName, ClusterId, list_TrendPoint, LastReceivedDateTime = TimeGenerated, Status, ContainerCount, UpTimeMs, Aggregation, LimitValue, Labels
| limit 250;

 union (scheduledPods), (unscheduledPods)
| project ClusterName, NodeName, LastReceivedDateTime, Status, ContainerCount, UpTimeMs = UpTimeMs_long, Aggregation = Aggregation_real, LimitValue = LimitValue_real, list_TrendPoint, Labels, ClusterId
Prometheus metrics
The following examples requires the configuration described in Send Prometheus metrics to Log Analytics workspace with Container insights.
To view Prometheus metrics scraped by Azure Monitor and filtered by namespace, specify "prometheus". Here's a sample query to view Prometheus metrics from the default Kubernetes namespace.
InsightsMetrics
| where Namespace contains "prometheus"
| extend tags=parse_json(Tags)
| summarize count() by Name
Prometheus data can also be directly queried by name.
InsightsMetrics
| where Namespace contains "prometheus"
| where Name contains "some_prometheus_metric"
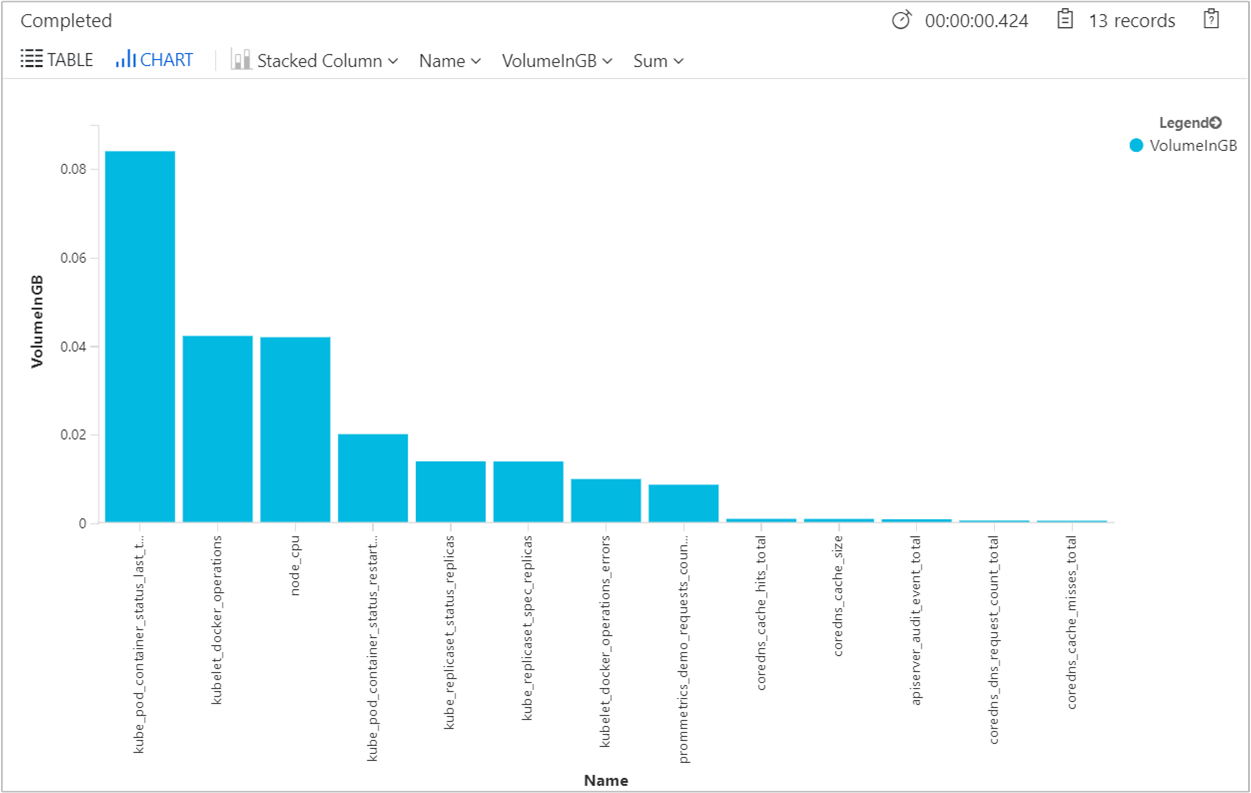
To identify the ingestion volume of each metrics size in GB per day to understand if it's high, the following query is provided.
InsightsMetrics
| where Namespace contains "prometheus"
| where TimeGenerated > ago(24h)
| summarize VolumeInGB = (sum(_BilledSize) / (1024 * 1024 * 1024)) by Name
| order by VolumeInGB desc
| render barchart
The output will show results similar to the following example.
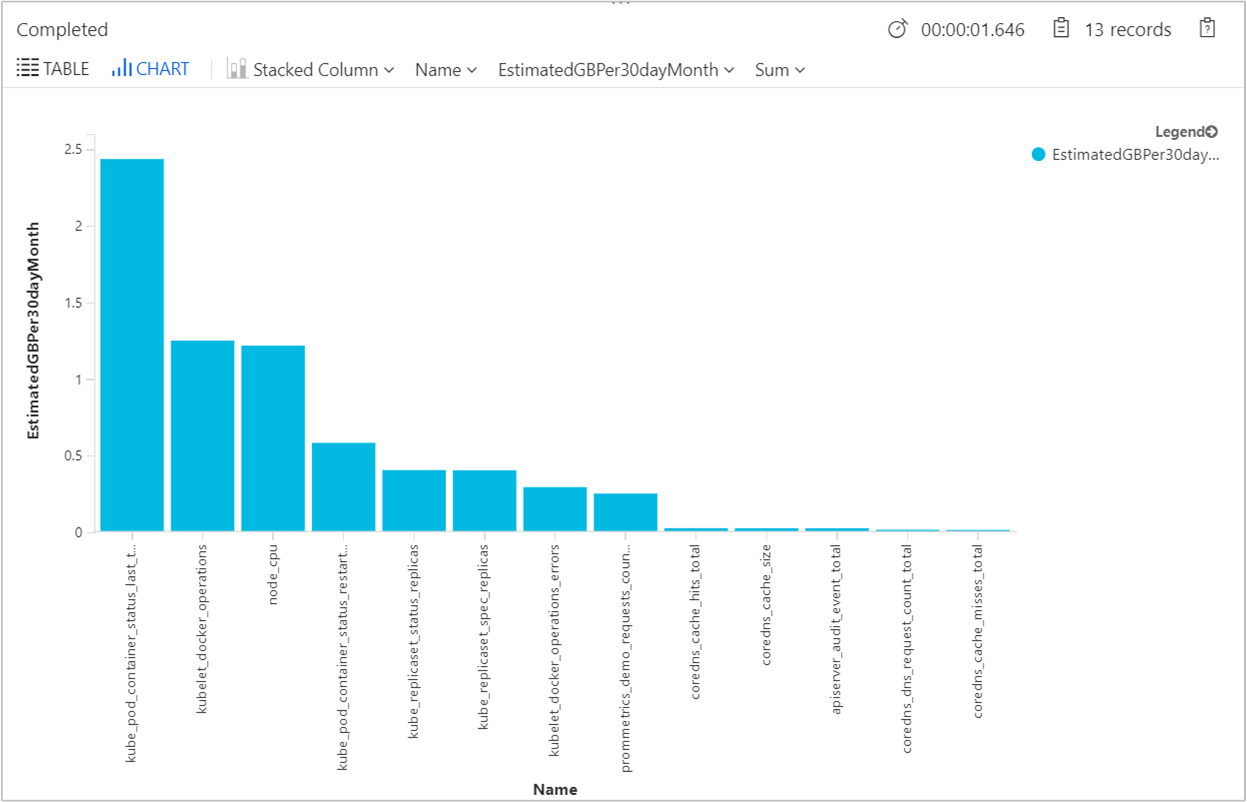
To estimate what each metrics size in GB is for a month to understand if the volume of data ingested received in the workspace is high, the following query is provided.
InsightsMetrics
| where Namespace contains "prometheus"
| where TimeGenerated > ago(24h)
| summarize EstimatedGBPer30dayMonth = (sum(_BilledSize) / (1024 * 1024 * 1024)) * 30 by Name
| order by EstimatedGBPer30dayMonth desc
| render barchart
The output will show results similar to the following example.
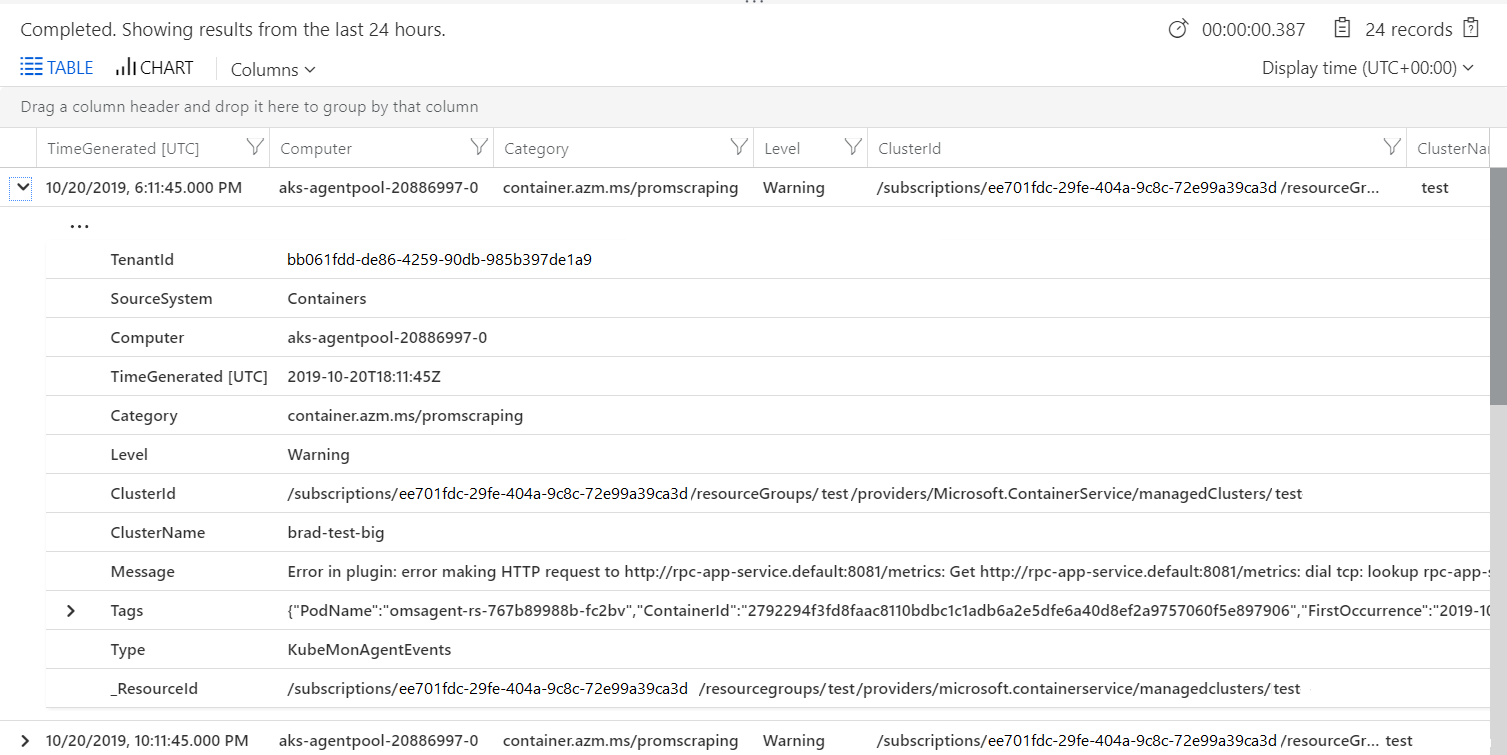
Configuration or scraping errors
To investigate any configuration or scraping errors, the following example query returns informational events from the KubeMonAgentEvents table.
KubeMonAgentEvents | where Level != "Info"
The output shows results similar to the following example:
Frequently asked questions
This section provides answers to common questions.
Can I view metrics collected in Grafana?
Container insights support viewing metrics stored in your Log Analytics workspace in Grafana dashboards. We've provided a template that you can download from the Grafana dashboard repository. Use it to get started and as a reference to help you learn how to query data from your monitored clusters to visualize in custom Grafana dashboards.
Why are log lines larger than 16 KB split into multiple records in Log Analytics?
The agent uses the Docker JSON file logging driver to capture the stdout and stderr of containers. This logging driver splits log lines larger than 16 KB into multiple lines when they're copied from stdout or stderr to a file. Use Multi-line logging to get log record size up to 64KB.
Next steps
Container insights doesn't include a predefined set of alerts. To learn how to create recommended alerts for high CPU and memory utilization to support your DevOps or operational processes and procedures, see Create performance alerts with Container insights.
Feedback
Coming soon: Throughout 2024 we will be phasing out GitHub Issues as the feedback mechanism for content and replacing it with a new feedback system. For more information see: https://aka.ms/ContentUserFeedback.
Submit and view feedback for
