Note
Access to this page requires authorization. You can try signing in or changing directories.
Access to this page requires authorization. You can try changing directories.
Sisense is an analytics business intelligence platform that enables you to build analytics apps that deliver highly interactive user experiences. The business intelligence and dashboard reporting software allows you to access and combine data in a few clicks. You can connect to structured and unstructured data sources, join tables from multiple sources with minimal scripting and coding, and create interactive web dashboards and reports. In this article, you learn how to set up Azure Data Explorer as a data source for Sisense, and visualize data from a sample cluster.
Prerequisites
You need the following to complete this article:
Create a cluster and database that includes the StormEvents sample data. For more information, see Quickstart: Create an Azure Data Explorer cluster and database and Ingest sample data into Azure Data Explorer.
The StormEvents sample dataset contains weather-related data from the National Centers for Environmental Information.
Connect to Sisense dashboards using Azure Data Explorer JDBC connector
Download and copy the latest versions of the following jar files to ..\Sisense\DataConnectors\jdbcdrivers\adx
- activation-1.1.jar
- adal4j-1.6.0.jar
- commons-codec-1.10.jar
- commons-collections4-4.1.jar
- commons-lang3-3.5.jar
- gson-2.8.0.jar
- jcip-annotations-1.0-1.jar
- json-smart-1.3.1.jar
- lang-tag-1.4.4.jar
- mail-1.4.7.jar
- mssql-jdbc-7.2.1.jre8.jar
- nimbus-jose-jwt-7.0.1.jar
- oauth2-oidc-sdk-5.24.1.jar
- slf4j-api-1.7.21.jar
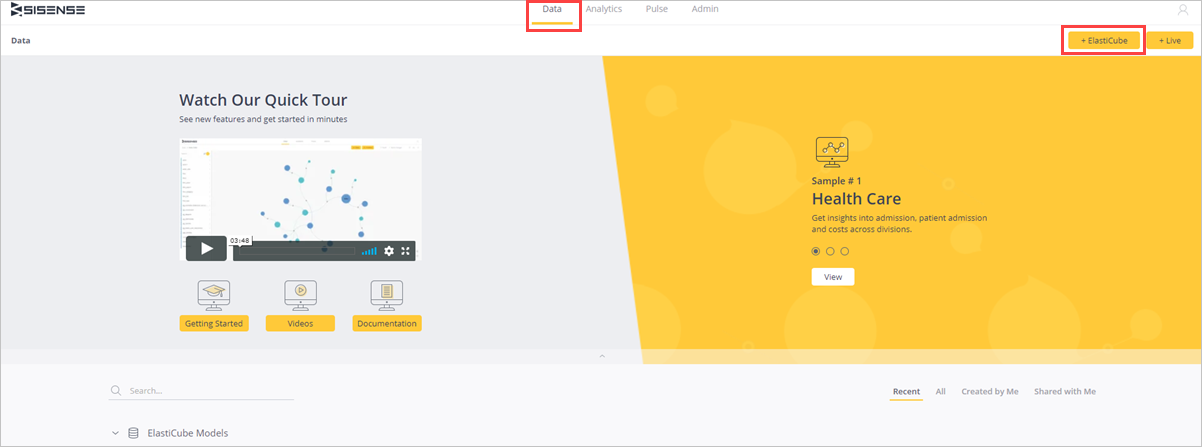
Open Sisense app.
Select Data tab and select +ElastiCube to create a new ElastiCube model.
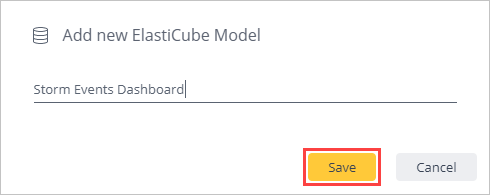
In Add new ElastiCube Model, name the ElastiCube model and Save.
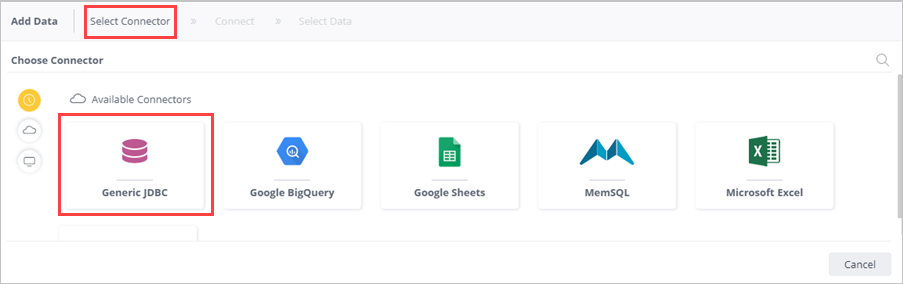
Select + Data.

In Select Connector tab, select Generic JDBC connector.
In the Connect tab, complete the following fields for the Generic JDBC connector and select Next.
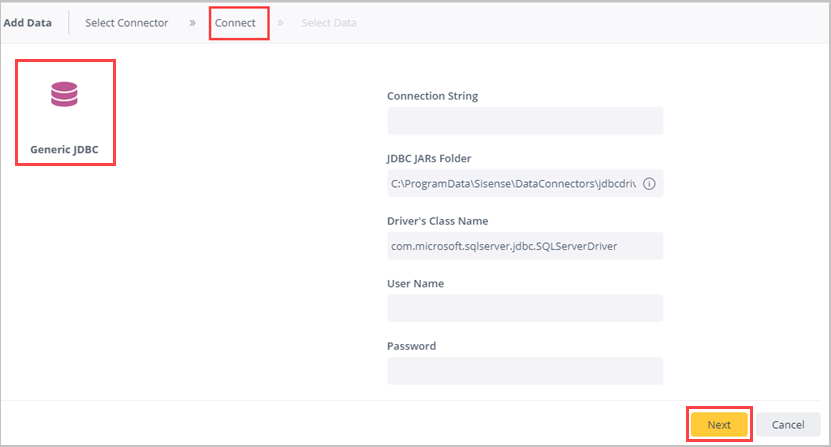
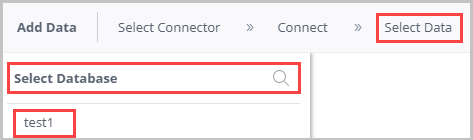
Field Description Connection String jdbc:sqlserver://<cluster_name.region>.kusto.windows.net:1433;database=<database_name>;encrypt=true;trustServerCertificate=false;hostNameInCertificate=*.kusto.windows.net;loginTimeout=30;authentication=ActiveDirectoryPasswordJDBC JARs folder ..\Sisense\DataConnectors\jdbcdrivers\adxDriver's Class Name com.microsoft.sqlserver.jdbc.SQLServerDriverUser Name Microsoft Entra user name Password Microsoft Entra user password In the Select Data tab, search Select Database to select the relevant database to which you have permissions. In this example, select test1.
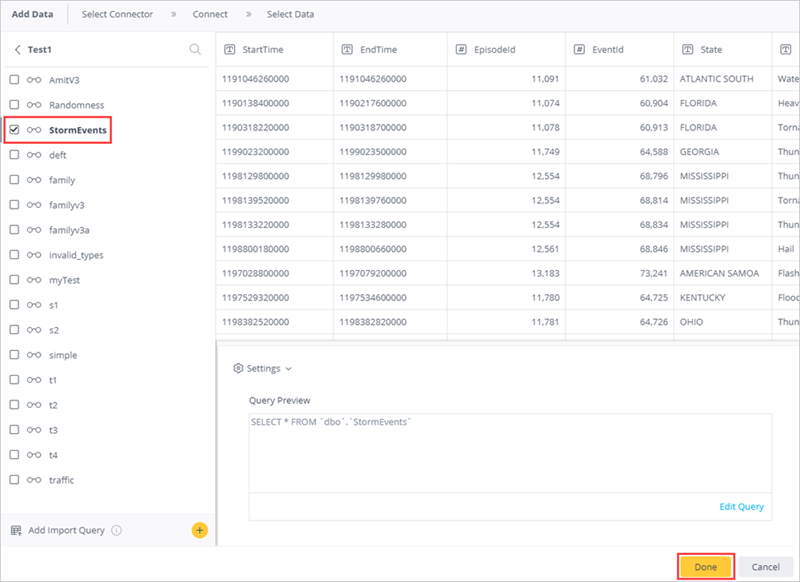
In test (database name) pane:
- Select the table name to preview the table and see the table column names. You can remove unnecessary columns.
- Select the check box of the relevant table to select that table.
- Select Done.
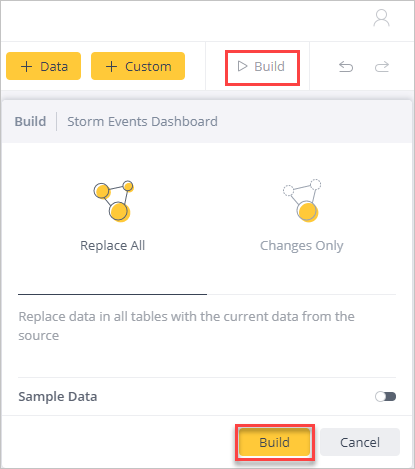
Select Build to build your dataset.
In the Build window, select Build.
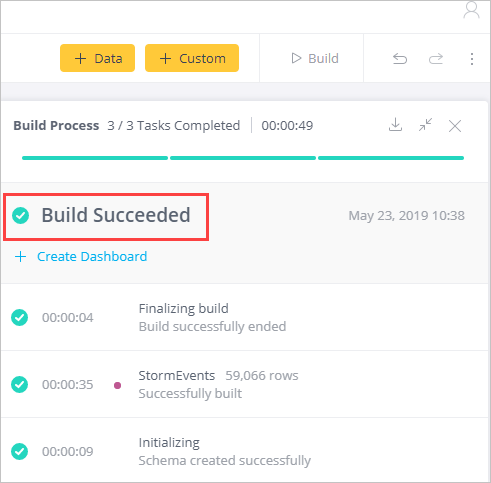
Wait until build process is complete and then select Build Succeeded.
Create Sisense dashboards
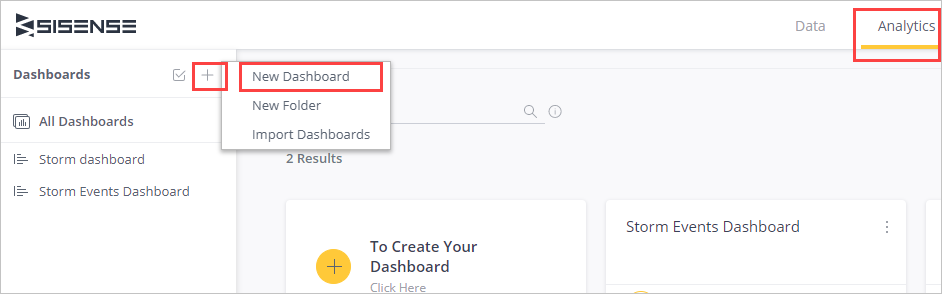
In Analytics tab, select + > New Dashboard to create dashboards on this dataset.
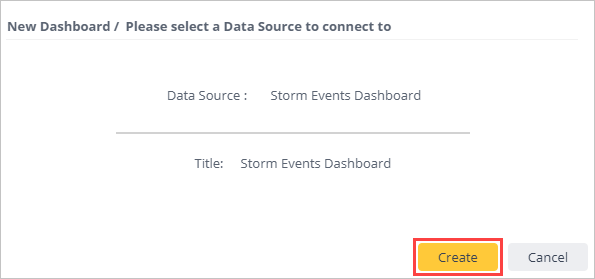
Pick a dashboard and select Create.
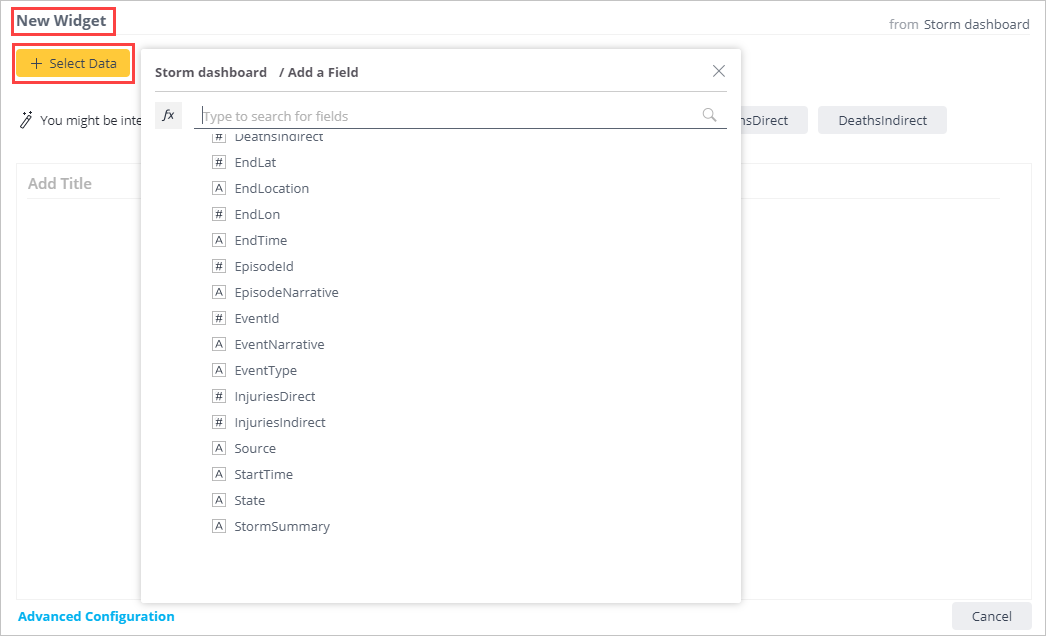
Under New Widget, select + Select Data to create a new widget.
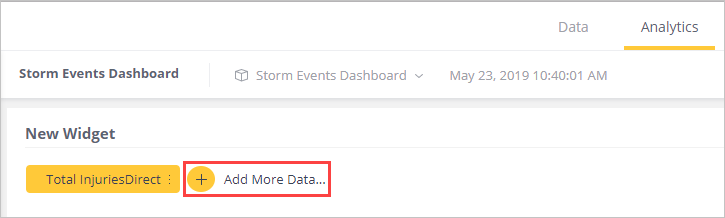
Select + Add More Data to add additional columns to your graph.
Select + Widget to create another widget. Drag and drop widgets to rearrange your dashboard.
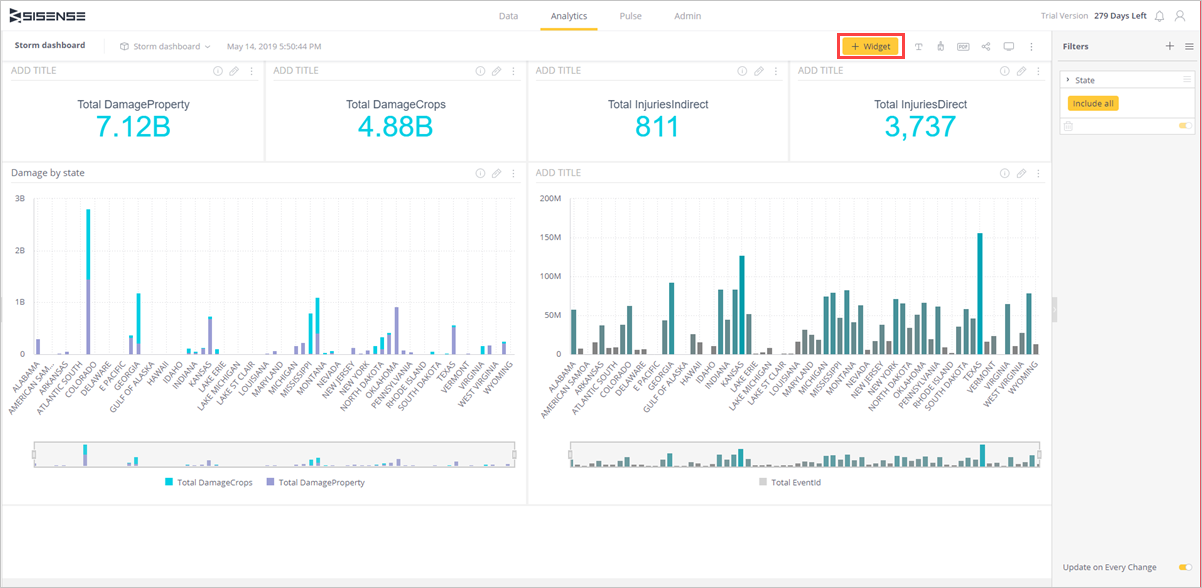
You can now explore your data with visual analytics, build additional dashboards, and transform data into actionable insights to make an impact on your business.