Widgets based on Analytics data
Azure DevOps Services | Azure DevOps Server 2022 - Azure DevOps Server 2019
Analytics supports several dashboard widgets that take advantage of the power of the service. Using these widgets, you and your team can gain valuable insights into the health and status of your work.
Analytics supports several dashboard widgets that take advantage of the power of the service. Once you enable or install Analytics on a project collection, you can add these widgets to your dashboard. To add extensions or enable the service, you must be an organization owner or a member of the Project Collection Administrators group. Using these widgets, you and your team can gain valuable insights into the health and status of your work.
You add an Analytics widget to a dashboard the same way you add any other type of widget. For details, see Add a widget to your dashboard.
Prerequisites
- Analytics widget data is calculated from the Analytics service. The Analytics service is enabled for all Azure DevOps organizations.
- To view Analytics data, you must have the View analytics project-level permission set to Allow. By default, this permission is set for all project members in all security groups. Users granted Stakeholder access or greater can view Analytics widgets.
- Analytics widget data is calculated from the Analytics service.
- For Analytics widgets to display correctly, the Analytics service must be enabled on your on-premises Azure DevOps Server. To learn more, see Install/uninstall or enable/disable the Analytics service.
- To view Analytics data, you must have the View analytics project-level permission set to Allow. By default, this permission is set for all project members in all security groups. Users granted Stakeholder access or greater can view Analytics widgets.
Note
If Boards is disabled, then Analytics views is also disabled. All widgets associated with work item tracking are also disabled in the widget catalog. To re-enable a service, see Turn on or off an Azure DevOps service.
Burndown widget
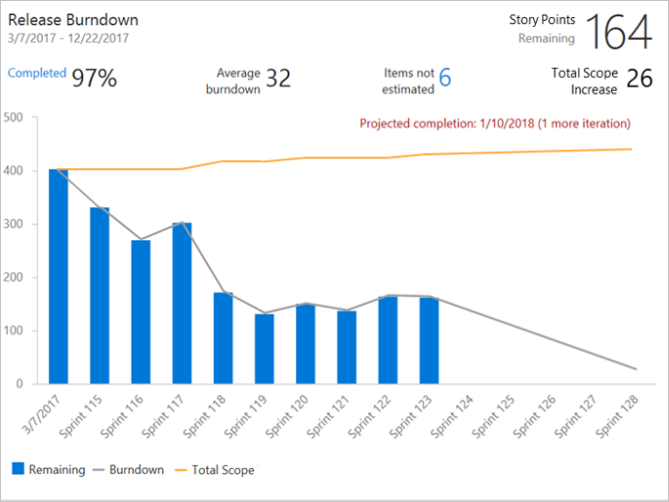
The Burndown widget lets you display a trend of remaining work across multiple teams and multiple sprints. You can use it to create a release burndown, a bug burndown, or a burndown on any scope of work over time. It will help you answer questions like:
- Will we complete the scope of work by the targeted completion date? If not, what is the projected completion date?
- What kind of scope creep does my project have?
- What is the projected completion date for my project?
Burndown widget showing a release Burndown
To learn more, see Configure a burndown or burnup widget.
Burnup widget
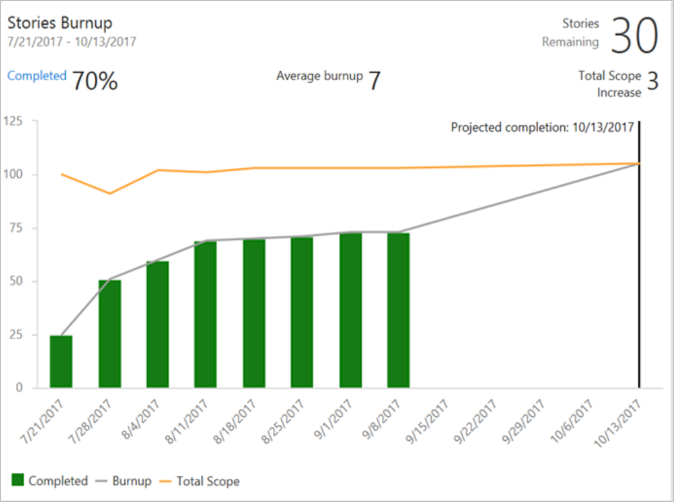
The Burnup widget lets you display a trend of completed work across multiple teams and multiple sprints. You can use it to create a release burnup, a bug burnup, or a burnup on any scope of work over time. When completed work meets total scope, your project is done!
Burnup widget showing a release Burnup
To learn more, see Configure a burndown or burnup widget.
Sprint Burndown widget
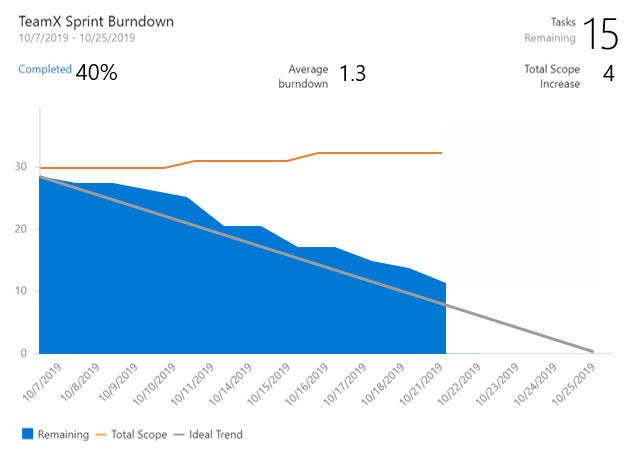
The Analytics-based Sprint Burndown widget adds a team's burndown chart for a sprint to the dashboard. This widget supports several configuration options, including selecting a team, iteration, and time period. Teams use the burndown chart to mitigate risk and check for scope creep throughout the sprint cycle.
Sprint Burndown widget
To learn more, see Configure and monitor sprint burndown.
Cumulative Flow Diagram (CFD) widget
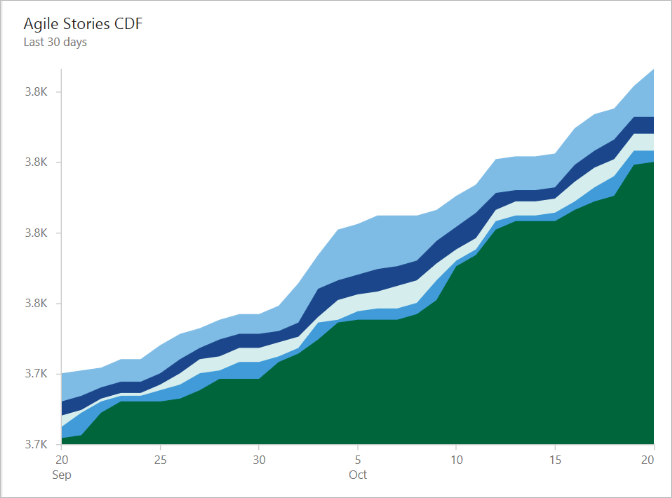
The CFD widget shows the count of work items (over time) for each column of a board. It allows you to see patterns in your team's development cycle over time. It will help you answer questions like:
- Is there a bottleneck in my process?
- Am I consistently delivering value to my users?
Cumulative flow diagram widget showing 30 days of data
To learn more, see Cumulative flow diagram widget.
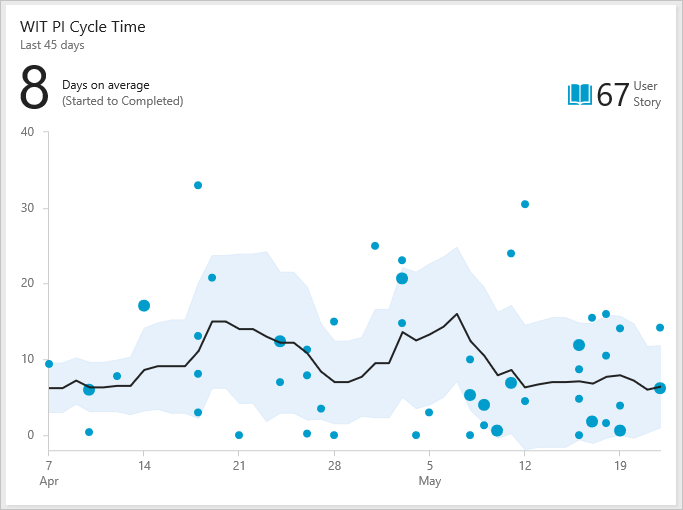
Cycle Time widget
The Cycle Time widget will help you analyze the time it takes for your team to complete work items once they begin actively working on them. A lower cycle time is typically indicative of a healthier team process. Using the Cycle Time widget you can answer questions like:
- On average, how long does it take my team to build a feature or fix a bug?
- Are bugs costing my team many development hours?
Cycle Time widget showing 30 days of data
To learn more, see Cycle Time and lead time control charts.
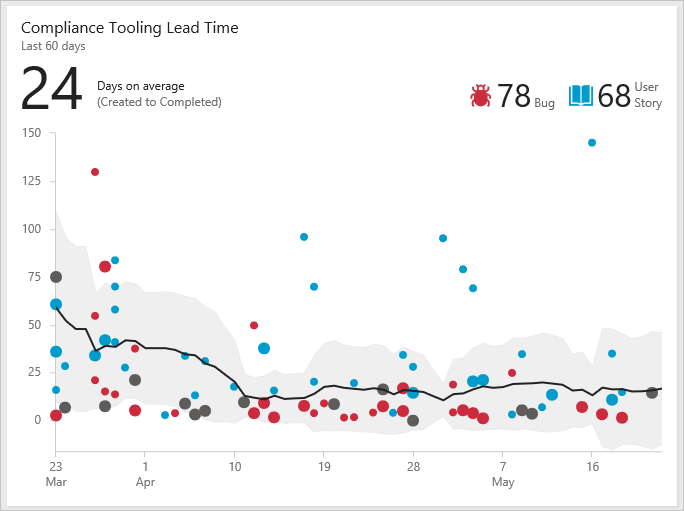
Lead Time widget
The Lead Time widget will help you analyze the time it takes to deliver work from your backlog. Lead Time measures the total time elapsed from the creation of work items to their completion. Using the Lead Time widget, you can answer questions like:
- How long does it take for work requested by a customer to be delivered?
- Did work items take longer than usual to complete?
Lead Time widget showing 60 days of data
To learn more, see Cycle Time and lead time control charts.
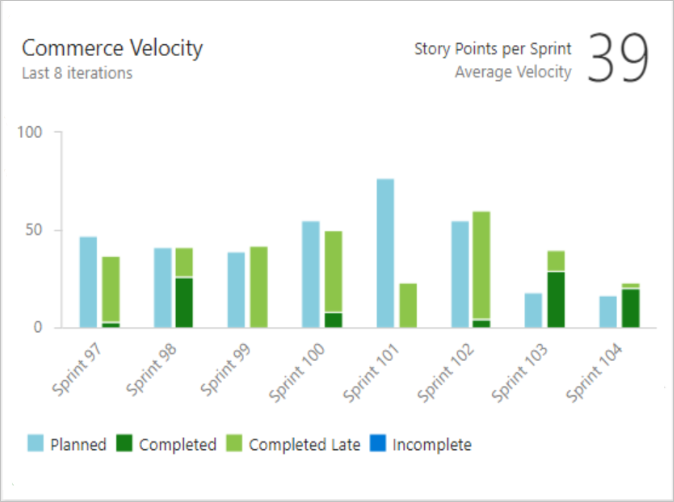
Velocity widget
The Velocity widget will help you learn how much work your team can complete during a sprint. The widget shows the team's velocity by Story Points, work item count, or any custom field. It allows you to compare the work delivered against your plan and track work that's completed late. Using the Velocity widget, you can answer questions like:
- On average, what is the velocity of my team?
- Is my team consistently delivering what we planned?
- How much work can we commit to deliver in upcoming sprints?
Velocity widget showing 8 sprints of data based on Story Points
To learn more, see Configure and view Velocity widgets.
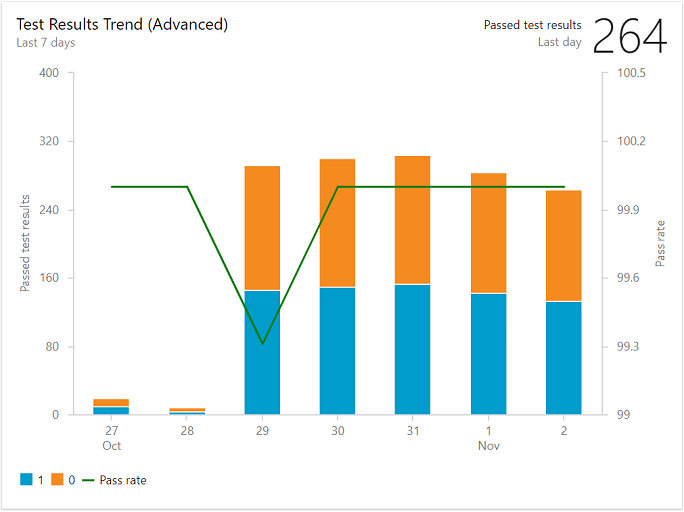
Test Results Trend (Advanced)
With the Test Results Trend (Advanced) widget, you can track the test quality of your pipelines over time. Tracking test quality and improving test collateral are essential tasks to maintaining a healthy DevOps pipeline.
The widget shows a trend of your test results for either build or release pipelines. You can track the daily count of tests, pass rates, and test duration. The highly configurable widget allows you to use it for a wide variety of scenarios.
You can find outliers in your test results and answer questions like:
- What tests taking longer to run than usual?
- What micro services are affecting my pass rate?
Test trend widget showing passed test results and pass rate for the last 7 days grouped by Priority
To learn more, see Configure a test results widget.
Feedback
Coming soon: Throughout 2024 we will be phasing out GitHub Issues as the feedback mechanism for content and replacing it with a new feedback system. For more information see: https://aka.ms/ContentUserFeedback.
Submit and view feedback for