Manual test suites aggregated view sample report
Azure DevOps Services | Azure DevOps Server 2022 | Azure DevOps Server 2020
You can report on the execution state of one or more Test Suites. The report you create using the information in this article is similar to the following image.

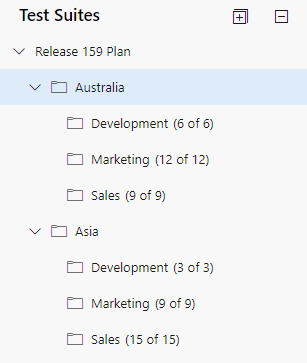
As shown in the following image, test suites can be arranged within a hierarchical organization. As shown, there are three test suites with the same names under two test suites labeled Australia and Asia. This article outlines how to aggregate data for a specific test suite level.
Important
Power BI integration and access to the OData feed of the Analytics Service are generally available for Azure DevOps Services and Azure DevOps Server 2020 and later versions. The sample queries provided in this article are valid only against Azure DevOps Server 2020 and later versions, and depend on v3.0-preview or later version. We encourage you to use these queries and provide us feedback.
Prerequisites
- Access: Be a member of a project with at least Basic access.
- Permissions: By default, project members have permission to query Analytics and create views.
- For more information about other prerequisites regarding service and feature enablement and general data tracking activities, see Permissions and prerequisites to access Analytics.
Note
This article assumes you read Overview of Sample Reports using OData Queries and have a basic understanding of Power BI.
For the report to generate useful data, the team must carry out the following activities to manage test plans:
Define test plans, test suites, and test cases. Specify their state. For a Test Suite to run, it must be in the In Progress state. For a Test Case to run, it must be in the Ready state. For details, see Create test plans and test suites and Create manual test cases.
Run manual tests and verify the results. Mark the results of each validation step in the test case as passed or failed. For details, see Run manual tests.
Note
Testers must mark a test step with a status if it is a validation test step. The overall result for a test reflects the status of all the test steps that were marked. Therefore, the test will have a status of failed if any test step is marked as failed or not marked.
Sample queries
You can use the following queries of the TestPoints entity set to create aggregated test suite reports.
Note
To determine available properties for filter or report purposes, see Metadata reference for Test Plans Analytics. You can filter your queries or return properties using any of the Property values under an EntityType or NavigationPropertyBinding Path values available with an EntitySet. Each EntitySet corresponds to an EntityType. For more information about the data type of each value, review the metadata provided for the corresponding EntityType.
Copy and paste the following Power BI query directly into the Get Data > Blank Query window. For more information, see Overview of sample reports using OData queries.
let
    Source = OData.Feed ("https://analytics.dev.azure.com/{organization}/{project}/_odata/v3.0-preview/TestPoints?"
        &"$apply=filter((TestSuite/TestPlanTitle eq '{testPlanTitle}' and TestSuite/IdLevel3 ne null))"
            &"/groupby("
                &"(TestSuite/TitleLevel3),"
                &"aggregate("
                    &"$count as TotalCount,"
                    &"cast(LastResultOutcome eq 'Passed', Edm.Int32) with sum as PassedCount,"
                    &"cast(LastResultOutcome eq 'Failed', Edm.Int32) with sum as FailedCount,"
                    &"cast(LastResultOutcome eq 'None', Edm.Int32) with sum as  NotRunCount,"
                    &"cast(LastResultOutcome ne 'None', Edm.Int32) with sum as RunCount"
            &")"
        &")"
        &"/compute("
            &"RunCount mul 100 div TotalCount as RunPercentage,"
            &"NotRunCount mul 100 div TotalCount as NotRunPercentage,"
            &"iif(TotalCount gt NotRunCount, PassedCount mul 100 div RunCount,0) as PassedPercentage,"
            &"iif(TotalCount gt NotRunCount, FailedCount mul 100 div RunCount,0) as FailedPercentage"
        &")"
        &"&$orderby=RunPercentage desc", null, [Implementation="2.0"])
in
    Source
Substitution strings and query breakdown
Substitute the following strings with your values. Don't include brackets {} with your substitution. For example if your organization name is "Fabrikam", replace {organization} with Fabrikam, not {Fabrikam}.
{organization}- Your organization name{project}- Your team project name, or omit "/{project}" entirely, for a cross-project query{testPlanTitle}- Title of the test plan whose data you want to return.
Query breakdown
The following table describes each part of the query.
Query part
Description
filter((TestSuite/TestPlanTitle eq '{testPlanTitle}' and TestSuite/IdLevel3 ne null))
Return data for only selected test plan. Also return the data for level 3 test suites onwards. You can add multiple plans with a clause like filter((TestSuite/TestPlanTitle eq '{testPlanTitle1}' or TestSuite/TestPlanTitle eq '{testPlanTitle2}' and TestSuite/IdLevel3 ne null)). You can also apply any other filters related to test suites, test configurations here.
/groupby((TestSuite/TitleLevel3),
The test suites to group by. If you're interested in getting report for all distinct test suites lying at level 3 of test suite hierarchy, you can specify this query part. You can change the level number from 1-14. If you wish to separate test suites with same name, you can use /groupby((TestSuite/TitleLevel3, TestSuite/IdLevel3), to sure that even if you've two test suites with same name, they'll be shown as two different entries as they would have two different IDs.
/aggregate($count as TotalCount,
Aggregate data across the filtered test points with having count as TotalCount.
cast(LastResultOutcome eq 'Passed', Edm.Int32) with sum as Passed,
While aggregating, type-cast test points having latest execution outcome 'Passed' to 1 and sum them up as 'Passed' metric.
/compute(Executed mul 100 div TotalCount as ExecPct
Provide a computed metric ExecPct that is equal to (Executed test points / Total count * 100).
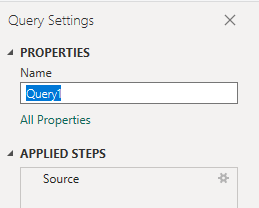
(Optional) Rename query
You can rename the default query label, Query1, to something more meaningful. Simply enter a new name from the Query Settings pane.
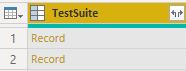
Expand columns in Power Query Editor
Prior to creating the report, you need to expand the TestSuite column to flatten the records into specific fields. To learn how, see Transform Analytics data to generate Power BI reports.
In Power BI, do the following steps.
When finished, you may choose to rename columns.
Expand
TestSuiteChoose the expand button.
Select the fields to flatten.
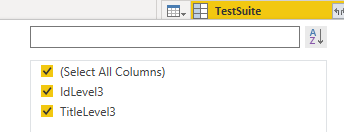
The table now contains entity field of
TestSuite.IdLevel3andTestSuite.TitleLevel3.
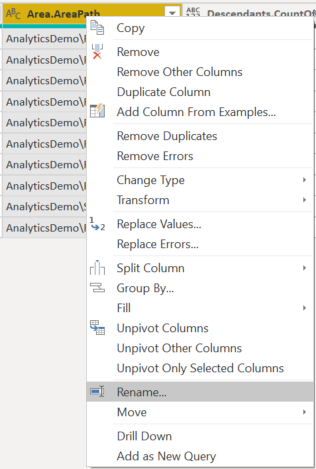
Right-click a column header and select Rename...
Change column data type
From the Power Query Editor, select all columns containing numbers, such as TotalCount, RunCount, and Passed; select Data Type from the Transform menu, and choose Whole Number. For more information about changing the data type, see Transform Analytics data to generate Power BI reports, Transform a column data type.
(Optional) Rename column fields
You can rename column fields. For example, you can rename the column NotApplicable to Not Applicable, or TotalCount to Total Count. To learn how, see Rename column fields.
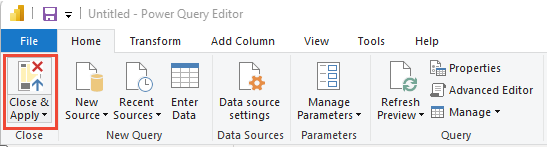
Close the query and apply your changes
Once you've completed all your data transformations, choose Close & Apply from the Home menu to save the query and return to the Report tab in Power BI.
Create the Table report
- Under Visualizations, choose Table.
- Drag and drop
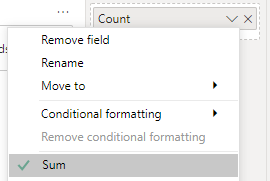
TestSuite.TitleLevel3,NotRunCount,RunCount,PassedCount,TotalCountunder Columns. - Select Sum as aggregation for Count.
Your report should look similar to the following image.