Test summary trend sample report
Azure DevOps Services | Azure DevOps Server 2022 | Azure DevOps Server 2020
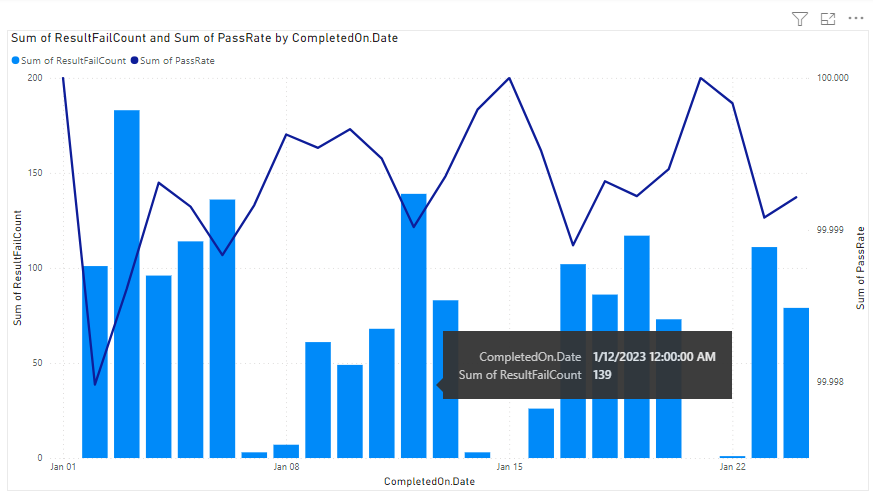
Pipelines that include test tasks can be queried to build a test summary trend report. For example, the following report displays the number of failed test runs in each column over a period of 24 days, along with the line chart showing the trend of test pass rate. For information on adding tests to a pipeline, see the Test task resources section later in this article.
Specifically, this article provides sample queries for generating the following reports:
- Test summary trend for build workflow
- Test summary trend for release workflow
- Test summary trend for a particular branch
- Test summary trend for a particular test file
- Test summary trend for a particular test owner.
Important
Power BI integration and access to the OData feed of the Analytics Service are generally available for Azure DevOps Services and Azure DevOps Server 2020 and later versions. The sample queries provided in this article are valid only against Azure DevOps Server 2020 and later versions, and depend on v3.0-preview or later version. We encourage you to use these queries and provide us feedback.
Prerequisites
- Access levels: You must be a member of a project with Basic access or higher.
- Permissions: By default, project members have permission to query Analytics and create views.
- For more information about other prerequisites regarding service and feature enablement and general data tracking activities, see Permissions and prerequisites to access Analytics.
Note
This article assumes you read Overview of Sample Reports using OData Queries and have a basic understanding of Power BI.
Sample queries
You can use the following queries of the TestRuns entity set to create different but similar pipeline test summary trend reports. The TestRuns entity set for the following queries are available only when you include test tasks within a pipeline definition.
Note
To determine available properties for filter or report purposes, see Metadata reference for Test Plans Analytics and Metadata reference for Azure Pipelines. You can filter your queries or return properties using any of the Property values under an EntityType or NavigationPropertyBinding Path values available with an EntitySet. Each EntitySet corresponds to an EntityType. For more information about the data type of each value, review the metadata provided for the corresponding EntityType.
Test summary trend for Build workflow
Use the following queries to view the test summary trend of a pipeline for a Build workflow.
Copy and paste the following Power BI query directly into the Get Data > Blank Query window. For more information, see Overview of sample reports using OData queries.
let
   Source = OData.Feed ("https://analytics.dev.azure.com/{organization}/{project}/_odata/v4.0-preview/TestRuns?
$apply=filter("
                &"Pipeline/PipelineName eq '{pipelineName}' "
                &"and CompletedOn/Date ge {startdate} "
                &"and Workflow eq 'Build' "
            &") "
        &"/groupby( "
          &"(CompletedOn/Date), "
          &"aggregate( "
            &"ResultCount with sum as ResultCount, "
            &"ResultPassCount with sum as ResultPassCount, "
            &"ResultNotExecutedCount with sum as ResultNotExecutedCount, "
            &"ResultNotImpactedCount with sum as ResultNotImpactedCount, "
            &"ResultFailCount with sum as ResultFailCount "
         &")) "
       &"/compute( "
       &"iif(ResultCount gt ResultNotExecutedCount, ((ResultPassCount add ResultNotImpactedCount) div cast(ResultCount sub ResultNotExecutedCount, Edm.Decimal)) mul 100, 0) as PassRate) "
    ,null, [Implementation="2.0",OmitValues = ODataOmitValues.Nulls,ODataVersion = 4])
in
    Source
Test summary trend for Release workflow
Use the following queries to view the test summary trend of a pipeline defined for a Release workflow.
Copy and paste the following Power BI query directly into the Get Data > Blank Query window. For more information, see Overview of sample reports using OData queries.
let
   Source = OData.Feed ("https://analytics.dev.azure.com/{organization}/{project}/_odata/v4.0-preview/TestRuns?
$apply=filter("
                &"Pipeline/PipelineName eq '{pipelineName}' "
                &"and CompletedOn/Date ge {startdate} "
                &"and Workflow eq 'Release' "
            &") "
        &"/groupby( "
          &"(CompletedOn/Date), "
          &"aggregate( "
            &"ResultCount with sum as ResultCount, "
            &"ResultPassCount with sum as ResultPassCount, "
            &"ResultNotExecutedCount with sum as ResultNotExecutedCount, "
            &"ResultNotImpactedCount with sum as ResultNotImpactedCount, "
            &"ResultFailCount with sum as ResultFailCount "
         &")) "
       &"/compute( "
       &"iif(ResultCount gt ResultNotExecutedCount, ((ResultPassCount add ResultNotImpactedCount) div cast(ResultCount sub ResultNotExecutedCount, Edm.Decimal)) mul 100, 0) as PassRate) "
    ,null, [Implementation="2.0",OmitValues = ODataOmitValues.Nulls,ODataVersion = 4])
in
    Source
Test summary trend filtered by branch
To view the test summary trend of a pipeline for a particular branch, use the following queries. To create the report, carry out the following extra steps along with what is specified later in this article.
- Expand
BranchintoBranch.BranchName - Select Power BI Visualization Slicer and add the field
Branch.BranchNameto the slicer's Field - Select the branch name from the slicer for which you need to see the outcome summary.
For more information about using slicers, see Slicers in Power BI.
Copy and paste the following Power BI query directly into the Get Data > Blank Query window. For more information, see Overview of sample reports using OData queries.
let
   Source = OData.Feed ("https://analytics.dev.azure.com/{organization}/{project}/_odata/v4.0-preview/TestRuns?
$apply=filter("
                &"Pipeline/PipelineName eq '{pipelineName}' "
                &"and CompletedOn/Date ge {startdate} "
                &"and Workflow eq 'Build' "
            &") "
        &"/groupby((Branch/BranchName, CompletedOn/Date), "
          &"aggregate( "
            &"ResultCount with sum as ResultCount, "
            &"ResultPassCount with sum as ResultPassCount, "
            &"ResultNotExecutedCount with sum as ResultNotExecutedCount, "
            &"ResultNotImpactedCount with sum as ResultNotImpactedCount, "
            &"ResultFailCount with sum as ResultFailCount "
         &")) "
       &"/compute( "
       &"iif(ResultCount gt ResultNotExecutedCount, ((ResultPassCount add ResultNotImpactedCount) div cast(ResultCount sub ResultNotExecutedCount, Edm.Decimal)) mul 100, 0) as PassRate) "
    ,null, [Implementation="2.0",OmitValues = ODataOmitValues.Nulls,ODataVersion = 4])
in
    Source
Test summary trend filtered by test file
To view the test summary trend of a pipeline for a particular test file, use the following queries. To create the report, carry out the following extra steps along with what is defined later in this article.
- Expand
TestintoTest.ContainerName - Select Power BI Visualization Slicer and add the field
Test.ContainerNameto the slicer's Field - Select the container name from the slicer for which you need to see the outcome summary.
Copy and paste the following Power BI query directly into the Get Data > Blank Query window. For more information, see Overview of sample reports using OData queries.
let
   Source = OData.Feed ("https://analytics.dev.azure.com/{organization}/{project}/_odata/v4.0-preview/TestRuns?
$apply=filter("
                &"Pipeline/PipelineName eq '{pipelineName}' "
                &"and CompletedOn/Date ge {startdate} "
                &"and Workflow eq 'Build' "
            &") "
        &"/groupby((Test/ContainerName, Date/Date), "
          &"aggregate( "
            &"ResultCount with sum as ResultCount, "
            &"ResultPassCount with sum as ResultPassCount, "
            &"ResultNotExecutedCount with sum as ResultNotExecutedCount, "
            &"ResultNotImpactedCount with sum as ResultNotImpactedCount, "
            &"ResultFailCount with sum as ResultFailCount "
         &")) "
       &"/compute( "
       &"iif(ResultCount gt ResultNotExecutedCount, ((ResultPassCount add ResultNotImpactedCount) div cast(ResultCount sub ResultNotExecutedCount, Edm.Decimal)) mul 100, 0) as PassRate) "
    ,null, [Implementation="2.0",OmitValues = ODataOmitValues.Nulls,ODataVersion = 4])
in
    Source
Test summary trend filtered by test owner
To view the test summary trend of a pipeline for tests owned by a particular test owner, use the following queries. To create the report, carry out the following extra steps along with what is defined later in this article.
- Expand
TestintoTest.TestOwner - Select Power BI Visualization Slicer and add the field
Test.TestOwnerto the slicer's Field - Select the test owner from the slicer for which you need to see the outcome summary.
Copy and paste the following Power BI query directly into the Get Data > Blank Query window. For more information, see Overview of sample reports using OData queries.
let
   Source = OData.Feed ("https://analytics.dev.azure.com/{organization}/{project}/_odata/v4.0-preview/TestRuns?
$apply=filter("
                &"Pipeline/PipelineName eq '{pipelineName}' "
                &"and CompletedOn/Date ge {startdate} "
                &"and Workflow eq 'Build' "
            &") "
        &"/groupby((Test/TestOwner, Date/Date), "
          &"aggregate( "
            &"ResultCount with sum as ResultCount, "
            &"ResultPassCount with sum as ResultPassCount, "
            &"ResultNotExecutedCount with sum as ResultNotExecutedCount, "
            &"ResultNotImpactedCount with sum as ResultNotImpactedCount, "
            &"ResultFailCount with sum as ResultFailCount "
         &")) "
       &"/compute( "
       &"iif(ResultCount gt ResultNotExecutedCount, ((ResultPassCount add ResultNotImpactedCount) div cast(ResultCount sub ResultNotExecutedCount, Edm.Decimal)) mul 100, 0) as PassRate) "
    ,null, [Implementation="2.0",OmitValues = ODataOmitValues.Nulls,ODataVersion = 4])
in
    Source
Substitution strings and query breakdown
Substitute the following strings with your values. Don't include brackets {} with your substitution. For example if your organization name is "Fabrikam", replace {organization} with Fabrikam, not {Fabrikam}.
{organization}- Your organization name{project}- Your team project name{pipelinename}- Your pipeline name. Example: Fabrikam hourly build pipeline{startdate}The date to start your report. Format: YYYY-MM-DDZ. Example: 2023-01-01Z represents January 1, 2023 at 12:50:54. Don't enclose in quotes or brackets.
Query breakdown
The following table describes each part of the query.
Query part
Description
$apply=filter(
Start filter() clause.
Pipeline/PipelineName eq '{pipelineName}'
Return test runs for the specified pipeline.
and CompletedOn/Date ge {startdate}
Return test runs on or after the specified date.
and Workflow eq 'Build'
Return test runs for the pipeline with a Build workflow
)
Close filter() clause
/groupby(
Start groupby() clause.
(CompletedOn/Date),
Group by the date of completion of test run.
aggregate(
Start aggregate clause. For all the test runs matching the filter criteria, sum the series of counts.
ResultCount with sum as ResultCount,
Count the total number of test runs as ResultCount.
ResultPassCount with sum as ResultPassCount,
Count the total number of passed test runs as ResultPassCount.
ResultNotExecutedCount with sum as ResultNotExecutedCount,
Count the total number of not executed test runs as ResultNotExecutedCount.
ResultNotImpactedCount with sum as ResultNotImpactedCount
Count the total number of not affected test runs as ResultNotImpactedCount.
ResultFailCount with sum as ResultFailCount
Count the total number of failed test runs as ResultFailCount.
))
Close aggregate() and groupby() clauses.
/compute(
Start compute() clause.
iif(ResultCount gt ResultNotExecutedCount, ((ResultPassCount add ResultNotImpactedCount) div cast(ResultCount sub ResultNotExecutedCount, Edm.Decimal)) mul 100, 0) as PassRate
For all the days, calculate PassRate.
)
Close compute() clause.
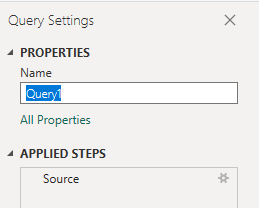
(Optional) Rename query
You can rename the default query label, Query1, to something more meaningful. Simply enter a new name from the Query Settings pane.
Expand the CompletedOn column in Power BI
Expand the CompletedOn column. Expanding the column flattens the record into specific fields. To learn how, see Transform Analytics data to generate Power BI reports, Expand columns.
Change column data type
From the Power Query Editor, select the PassRate column; select Data Type from the Transform menu; and then choose Decimal Number.
For more information about changing the data type, see Transform Analytics data to generate Power BI reports, Transform a column data type.
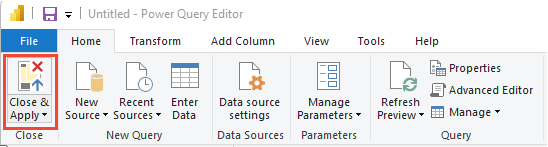
Close the query and apply your changes
Once you've completed all your data transformations, choose Close & Apply from the Home menu to save the query and return to the Report tab in Power BI.
Create the line and stack column chart report
In Power BI, under Visualizations, choose the Line and stack column chart and drag and drop the fields onto the chart areas.
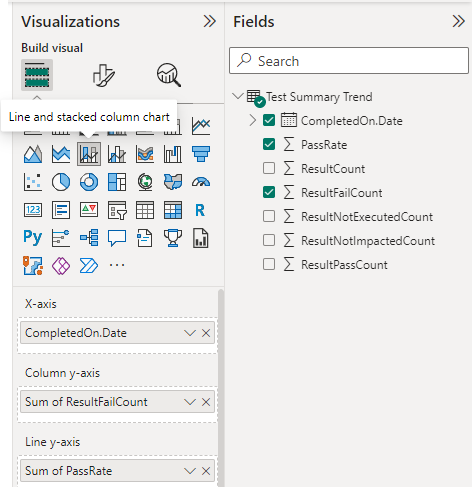
Add
CompletedOn.Dateto the X-axis, right-click the field and select Date.Date rather than Date Hierarchy.Add
ResultFailCountto Column y-axis.Add
PassRateto Line y-axis.
Your report should look similar to the following image.
Test task resources
- Run tests in parallel using the Visual Studio Test task
- Run tests in parallel for any test runner
- Speed up testing by using Test Impact Analysis (TIA)
- Manage flaky tests
- UI testing considerations
- Azure Load Testing
- Azure Pipelines task reference, Test tasks