Azure ExpressRoute Insights using Network Insights
This article explains how Network Insights can help you view your ExpressRoute metrics and configurations all in one place. Through Network Insights, you can view topological maps and health dashboards containing important ExpressRoute information without needing to complete any extra setup.

Visualize functional dependencies
Navigate to the Azure Monitor page, then select Networks.
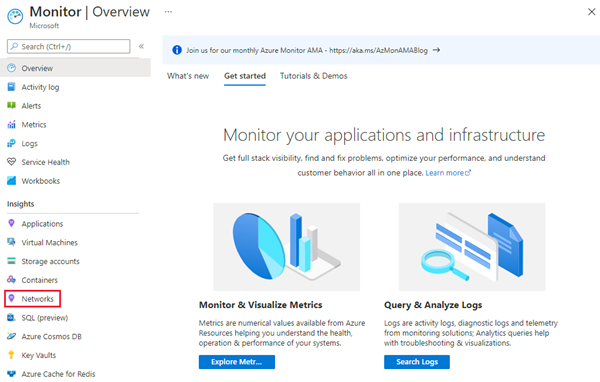
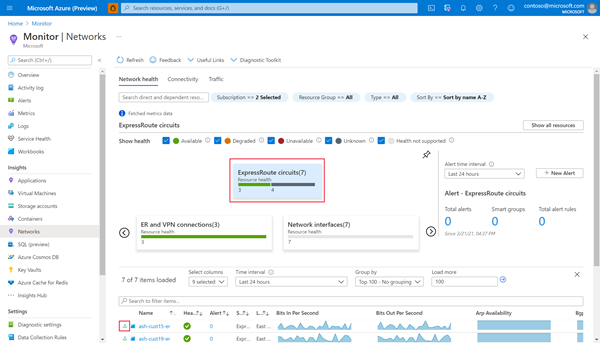
Select the ExpressRoute Circuits card.
Then, select the topology button for the circuit you would like to view.
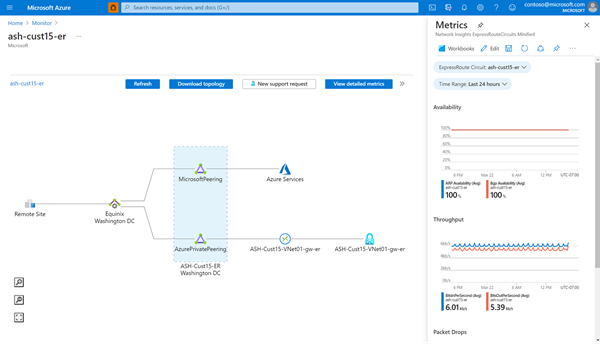
The functional dependency view provides a clear picture of your ExpressRoute setup, outlining the relationship between different ExpressRoute components (peerings, connections, gateways).
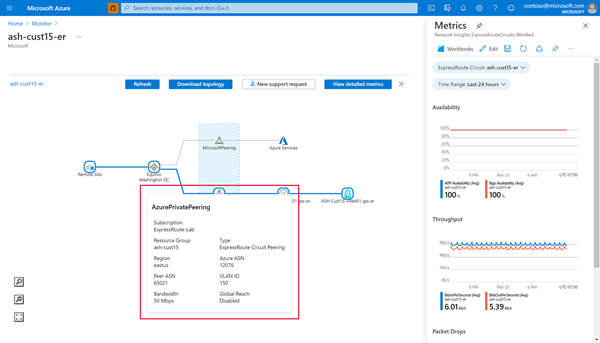
Hover over any component in the topology map to view configuration information. For example, hover over an ExpressRoute peering component to view details such as circuit bandwidth and Global Reach enablement.


View a detailed and preloaded metrics dashboard
Once you review the topology of your ExpressRoute setup using the functional dependency view, select View detailed metrics to navigated to the detailed metrics view to understand the performance of your circuit. This view offers an organized list of linked resources and a rich dashboard of important ExpressRoute metrics.
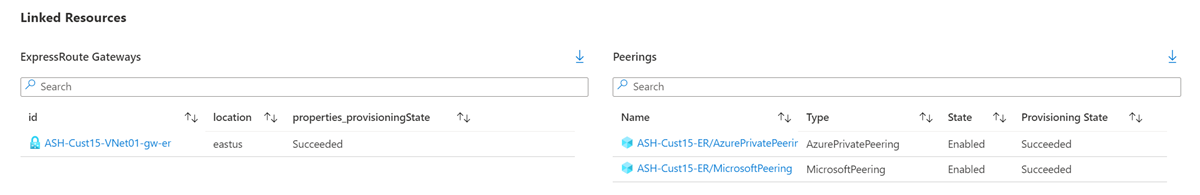
The Linked Resources section lists the connected ExpressRoute gateways and configured peerings, which you can select on to navigate to the corresponding resource page.
The ExpressRoute Metrics section includes charts of important circuit metrics across the categories of Availability, Throughput, Packet Drops, and Gateway Metrics.
Availability
The Availability tab tracks ARP and BGP availability, plotting the data for both the circuit as a whole and individual connection (primary and secondary).

Note
During maintenance between the Microsoft edge and core network, BGP availability will appear down even if the BGP session between the customer edge and Microsoft edge remains up. For information about maintenance between the Microsoft edge and core network, make sure to have your maintenance alerts turned on and configured.
Throughput
Similarly, the Throughput tab plots the total throughput of ingress and egress traffic for the circuit in bits/second. You can also view throughput for individual connections and each type of configured peering.

Packet Drops
The Packet Drops tab plots the dropped bits/second for ingress and egress traffic through the circuit. This tab provides an easy way to monitor performance issues that may occur if you regularly need or exceed your circuit bandwidth.

Gateway Metrics
Lastly, the Gateway Metrics tab populates with key metrics charts for a selected ExpressRoute gateway (from the Linked Resources section). Use this tab when you need to monitor your connectivity to specific virtual networks.

Next steps
Configure your ExpressRoute connection.
Feedback
Coming soon: Throughout 2024 we will be phasing out GitHub Issues as the feedback mechanism for content and replacing it with a new feedback system. For more information see: https://aka.ms/ContentUserFeedback.
Submit and view feedback for