Note
Access to this page requires authorization. You can try signing in or changing directories.
Access to this page requires authorization. You can try changing directories.
Use the langchain-azure-ai integration package to emit OpenTelemetry traces from LangChain and
LangGraph applications and sink them in Azure Application Insights. In this article, you configure
AzureAIOpenTelemetryTracer, attach it to your runnable, and inspect traces in
Azure Monitor.
The tracer emits spans for agent execution, model calls, tool execution, and retrieval operations. You can use it for apps that run fully local, hybrid flows that call Foundry Agent Service, or multi-agent LangGraph solutions.
Prerequisites
- An Azure subscription. Create one for free.
- A Foundry project.
- A deployed Azure OpenAI chat model (for example,
gpt-4.1). - Python 3.11 or later.
- Azure CLI signed in (
az login) soDefaultAzureCredentialcan authenticate.
Configure your environment
Install required packages:
pip install -U "langchain-azure-ai[opentelemetry]" azure-identity
Set the environment variables used in this article:
import os

# Option 1: Project endpoint (recommended)
os.environ["FOUNDRY_PROJECT_ENDPOINT"] = (
	"https://<resource>.services.ai.azure.com/api/projects/<project>"
)

# Option 2: Direct OpenAI-compatible endpoint + API key
os.environ["OPENAI_BASE_URL"] = (
	"https://<resource>.services.ai.azure.com/openai/v1"
)
os.environ["OPENAI_API_KEY"] = "<your-api-key>"
os.environ["APPLICATION_INSIGHTS_CONNECTION_STRING"] = "InstrumentationKey=0ab1c2d3..."
To control whether content from messages and tool calls is recorded in the trace,
pass enable_content_recording to the AzureAIOpenTelemetryTracer constructor.
Content recording is enabled by default.
Tip
Set enable_content_recording=False in the AzureAIOpenTelemetryTracer constructor
to redact message content and tool call arguments from traces.
Create the tracer
Create one tracer instance and reuse it across your workflow.
import os

from azure.identity import DefaultAzureCredential
from langchain_azure_ai.callbacks.tracers import AzureAIOpenTelemetryTracer

tracer = AzureAIOpenTelemetryTracer(
	project_endpoint=os.environ["FOUNDRY_PROJECT_ENDPOINT"],
	credential=DefaultAzureCredential(),
	name="langchain-tracing-sample",
	agent_id="support-bot",
	trace_all_langgraph_nodes=True,
)
What this snippet does: Configures a tracer that resolves the associated
Application Insights connection string from your Foundry project endpoint and
enables tracing for LangGraph nodes. Use the agent_id parameter to set the attribute
gen_ai.agent.id when invoking agents. The name parameter sets the
OpenTelemetry tracer name.
The tracer supports common controls for production workflows:
- Pass
connection_stringto target a specific Application Insights resource or configure the environment variableAPPLICATION_INSIGHTS_CONNECTION_STRING. - Set
trace_all_langgraph_nodes=Trueto trace all nodes by default. - Use node metadata like
otel_trace: Trueorotel_trace: Falseto include or skip specific nodes. - Use
message_keysandmessage_pathswhen your messages are nested under a custom state shape, for examplechat_history.
Reference:
Trace an agent
Start with a minimal LangChain agent so you can verify tracing quickly. For
LangGraph, attach the tracer with with_config on the compiled graph.
from langchain.agents import create_agent

agent = create_agent(
    model="azure_ai:gpt-5.2",
    system_prompt="You're an informational agent. Answer questions cheerfully.",
).with_config(
    {"callbacks": [tracer]}
)

response = agent.invoke({"messages": "what's your name?"})
response["messages"][-1].pretty_print()
================================== Ai Message ==================================

I’m ChatGPT, your AI assistant.
What this snippet does: Creates a simple LangGraph agent, attaches the tracer, and invokes the agent with a message.
Reference:
Trace a LangChain runnable
Start with a minimal LangChain flow so you can verify tracing quickly.
import os

from azure.identity import DefaultAzureCredential
from langchain_core.prompts import ChatPromptTemplate
from langchain_azure_ai.chat_models import AzureAIChatCompletionsModel

model = AzureAIChatCompletionsModel(
	project_endpoint=os.environ["FOUNDRY_PROJECT_ENDPOINT"],
	credential=DefaultAzureCredential(),
	model="gpt-4.1",
)

prompt = ChatPromptTemplate.from_template(
	"You are concise. Answer in one sentence: {question}"
)
chain = prompt | model

response = chain.invoke(
	{"question": "What does OpenTelemetry help me do?"},
	config={"callbacks": [tracer]},
)

print(response.content)
OpenTelemetry helps you observe requests, latency, dependencies, and failures across your AI workflow.
What this snippet does: Runs a standard LangChain pipeline and sends chat
spans to OpenTelemetry through AzureAIOpenTelemetryTracer.
Reference:
Trace a LangGraph graph
For LangGraph, attach the tracer by using with_config on the compiled graph.
This snippet reuses model and tracer from earlier examples.
from langgraph.graph import END, START, MessagesState, StateGraph
from langgraph.prebuilt import ToolNode
from langgraph.checkpoint.memory import MemorySaver
from langchain_core.tools import tool
from langchain_azure_ai.utils.agents import pretty_print

@tool
def play_song_on_spotify(song: str):
    """Play a song on Spotify"""
    # Integrate with Spotify API here.
    return f"Successfully played {song} on Spotify!"

@tool
def play_song_on_apple(song: str):
    """Play a song on Apple Music"""
    # Integrate with Apple Music API here.
    return f"Successfully played {song} on Apple Music!"

tool_node = ToolNode([play_song_on_apple, play_song_on_spotify])
model_with_tools = model.bind_tools([play_song_on_apple, play_song_on_spotify])

def should_continue(state: MessagesState):
    messages = state["messages"]
    last_message = messages[-1]
    return "continue" if getattr(last_message, "tool_calls", None) else "end"

def call_model(state: MessagesState):
    messages = state["messages"]
    response = model_with_tools.invoke(messages)
    return {"messages": [response]}

memory = MemorySaver()
workflow = (
    StateGraph(MessagesState)
    .add_node("agent", call_model)
    .add_node("action", tool_node)
    .add_edge(START, "agent")
    .add_conditional_edges(
        "agent",
        should_continue,
        {
            "continue": "action",
            "end": END,
        },
    )
    .add_edge("action", "agent")
    .compile(checkpointer=memory)
)
Then, you can run the graph as usual:
from langchain_core.messages import HumanMessage

config = {"configurable": {"thread_id": "1"}, "callbacks": [tracer]}
message = HumanMessage(content="Can you play Taylor Swift's most popular song?")

result = workflow.invoke({"messages": [message]}, config)
pretty_print(result)
================================ Human Message =================================

Can you play Taylor Swift's most popular song?
================================== Ai Message ==================================
Tool Calls:
  play_song_on_spotify (call_xxx)
 Call ID: call_xxx
  Args:
    song: Anti-Hero
================================= Tool Message =================================
Name: play_song_on_spotify

Successfully played Anti-Hero on Spotify!
================================== Ai Message ==================================

I played Taylor Swift's popular song "Anti-Hero" on Spotify.
What this snippet does: Creates a simple LangGraph app, marks the node for
tracing, and emits invoke_agent and model/tool spans into the same trace.
Reference:
Understand trace structure
The tracer emits spans that follow the OpenTelemetry GenAI semantic conventions.
Each span type uses a specific gen_ai.operation.name value:
| Span type | gen_ai.operation.name |
Description |
|---|---|---|
| Agent or chain invocation | invoke_agent |
Each LangGraph node or chain step. Span name is invoke_agent {gen_ai.agent.name}. |
| Chat model call | chat |
LLM inference requests. Span name is chat {gen_ai.request.model}. |
| Text completion | text_completion |
Non-chat LLM calls. |
| Tool execution | execute_tool |
Tool calls triggered by the model. Span name is execute_tool {gen_ai.tool.name}. |
| Retriever | execute_tool |
Retrieval operations from vector stores or search. |
Spans also carry these key attributes:
gen_ai.agent.name— The agent or node name.gen_ai.agent.id— Set from theagent_idconstructor parameter.gen_ai.agent.description— A description of the agent.gen_ai.provider.name— The model provider (for example,openai).gen_ai.request.model— The model name used for inference.gen_ai.conversation.id— Thread or session identifier, when available.gen_ai.usage.input_tokens/gen_ai.usage.output_tokens— Token counts from model responses.gen_ai.input.messages/gen_ai.output.messages— Message content (when content recording is enabled).
How the tracer resolves gen_ai.agent.name
The tracer resolves the agent name from the first non-empty value in this order:
agent_namein the node metadata.langgraph_nodein the node metadata (set automatically by LangGraph).agent_typein the node metadata.- The
namekeyword argument from the LangChain callback. langgraph_path(last element) if the preceding values are generic placeholders.- The serialized chain ID or class name.
- The
nameparameter from theAzureAIOpenTelemetryTracerconstructor (fallback default).
How the tracer resolves gen_ai.agent.id
The tracer resolves the agent ID from:
agent_idin the node metadata (per-node override).- The
agent_idconstructor parameter (default for all spans).
Customize attributes with node metadata
Set agent_name, agent_id, and agent_description for each node by using
LangGraph metadata. Any metadata key starting with gen_ai. is also forwarded
as a span attribute.
config = {
    "configurable": {"thread_id": "session-abc-123"},
    "callbacks": [tracer],
    "metadata": {
        "agent_name": "support-bot",
        "agent_id": "support-bot-v2",
        "agent_description": "Handles customer support requests",
    },
}
result = workflow.invoke({"messages": [message]}, config)
When you use LangGraph, you can also set metadata for each node in the graph definition:
workflow = StateGraph(MessagesState)
workflow.add_node(
    "planner",
    planner_fn,
    metadata={
        "agent_name": "PlannerAgent",
        "agent_id": "planner-v1",
        "otel_agent_span": True,
    },
)
Reference:
View traces in Azure Monitor
Azure Application Insights receives traces, and you can query them by using Azure Monitor:
Go to the Azure portal.
Navigate to the Azure Application Insights you configured.
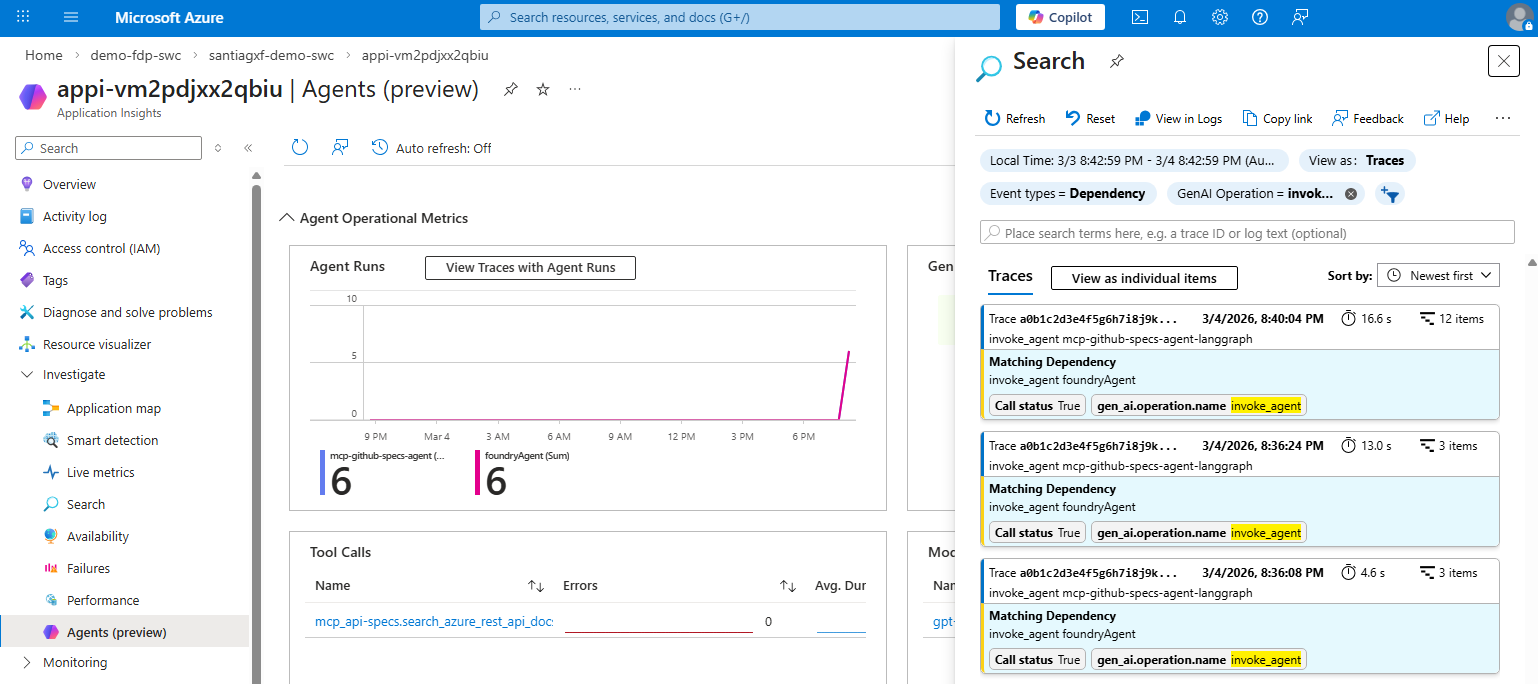
In the left navigation bar, select Investigate > Agents (Preview).
You see a dashboard that shows agent, model, and tool executions. Use this view to understand the overall activity of your agents.
Select View Traces with Agent Runs. The side panel shows all the traces generated by agent runs.
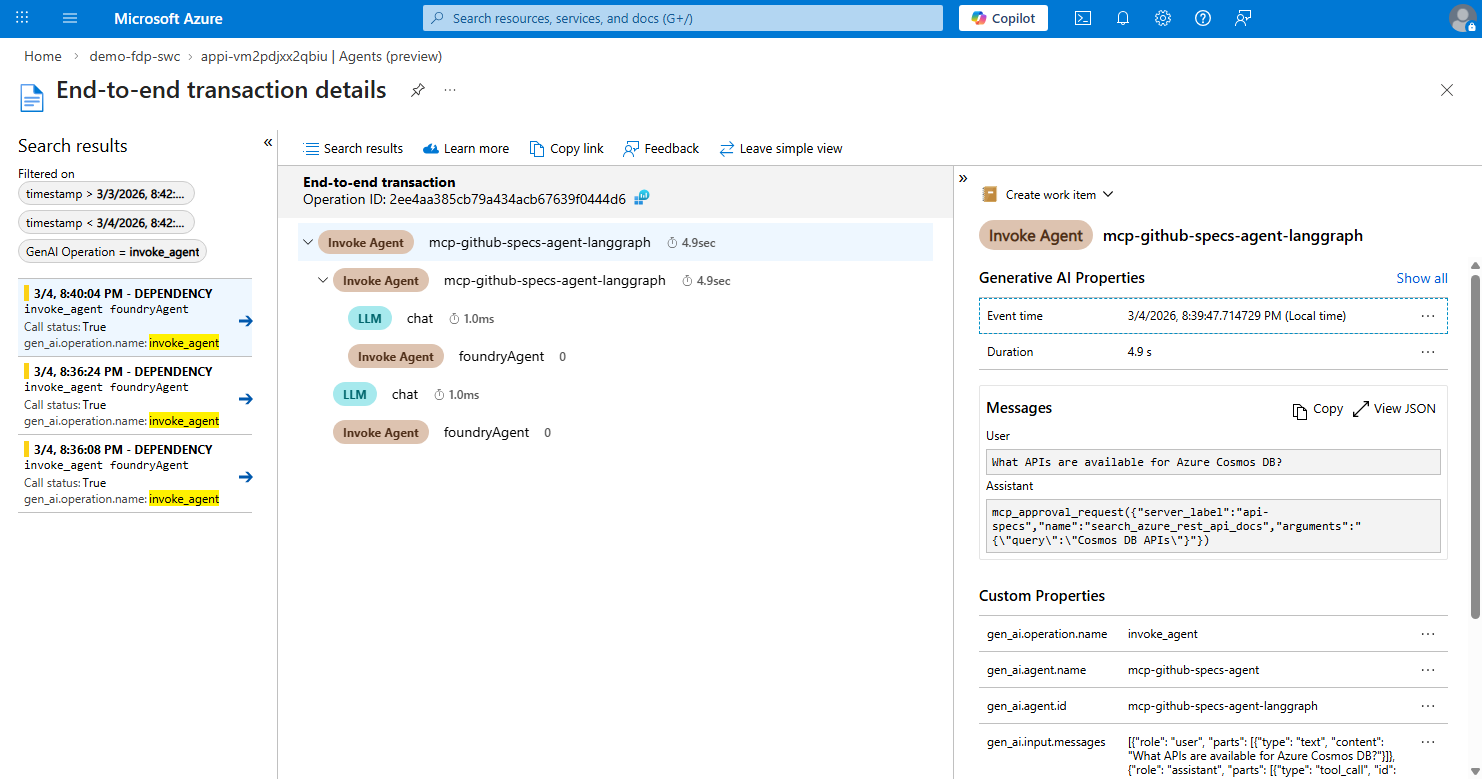
Select one of the traces. You see the details.
View traces in Foundry Control Plane
Register a LangGraph or LangChain agent that runs outside Foundry as an external agent to link its telemetry to Foundry. Registration doesn't move or host your agent's runtime. For telemetry setup and access requirements, see Register external agents for observability and evaluation.
Important
You can no longer add new Control Plane custom agents. For an existing custom agent, follow Migrate custom agents to external agents. Preserve its OpenTelemetry agent ID, gateway, and invocation route. Don't unregister or delete the original custom agent or its API Management API during migration.
To register an external agent in the portal:
Open your project in the Foundry portal and select Build > Agents.
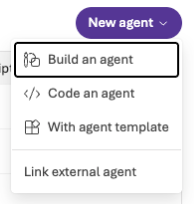
Select New agent > Link external agent.
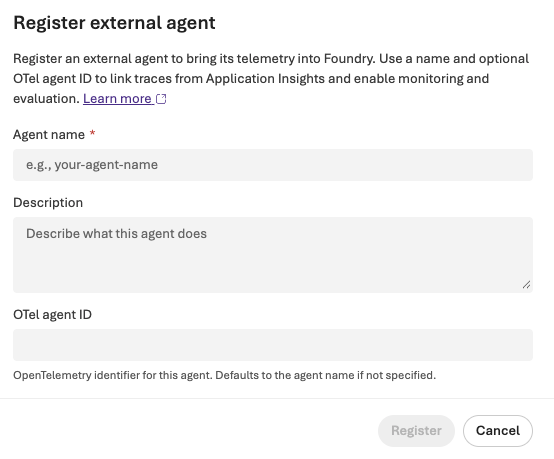
Enter Agent name and, optionally, Description.
Enter the OTel agent ID that matches the
gen_ai.agent.idemitted by your instrumentation.This field is optional and defaults to the agent name if you leave it blank. The value must match the ID in your telemetry to associate traces with the registered agent.
Select Register.
After your agent emits telemetry, select Manage > Fleet > Agents, select the agent, and open Traces. For details, see View agent traces.
Troubleshoot
- If no traces appear, verify that either
connection_stringis configured or your project endpoint exposes telemetry. - If message content appears redacted, set
enable_content_recording=Truein theAzureAIOpenTelemetryTracerconstructor. - If some LangGraph nodes are missing, set
trace_all_langgraph_nodes=Trueor add node metadataotel_trace: True.
Related content
- Explicit tracer sample for the callback-handler integration.
- Automatic Application Insights tracing sample.
- Hosted LangGraph observability sample for deployment and tracing.
- Get started with langchain-azure-ai
- Use LangGraph with the Agent Service
- Set up tracing integrations for agent frameworks