Use the responsible AI text dashboard (preview)
The Responsible AI (RAI) dashboard brings together several RAI tools in a single interface to help inform data-driven decisions about your models. Understanding natural language processing (NLP) models can be different from assessing tabular data. RAI dashboard debugging and visualizations now support text data.
The Responsible AI text dashboard is a customizable, interoperable toolbox where you can select components to perform model assessment and debugging. This article describes how to access and configure RAI text dashboard components and functionality.
Important
The Responsible AI text dashboard is currently in public preview. This preview is provided without a service-level agreement, and isn't recommended for production workloads. Certain features might not be supported or might have constrained capabilities. For more information, see Supplemental Terms of Use for Microsoft Azure Previews.
Prerequisites
An Azure subscription with an Azure Machine Learning workspace.
A registered machine learning model that has a responsible AI text dashboard created.
You can create an RAI text dashboard by using:
- The Azure Machine Learning studio UI
- YAML and Python via a pipeline job
- A preconfigured sample Jupyter notebook like Financial_News_Text_classifier.ipynb
To open the Responsible AI text dashboard in Machine Learning studio, select your registered model in the Models list, select Responsible AI at the top of the model page, and then select the name of your Responsible AI text dashboard from the list.

The Responsible AI text dashboard opens.


Cohorts
In the RAI text dashboard, you can select or create data cohorts, which are subsets of data created by manually adding filters or saving selected data. You can view, create, edit, duplicate, and delete cohorts.
The default dashboard view shows the Global cohort, which is all of the data. At the top of the dashboard, select Switch cohort to select a different cohort or New cohort to create a new cohort. You can also select the Settings icon to open a side panel that lists the names and details of all cohorts, and lets you switch or create new cohorts.

Selecting Switch cohort at the top of the dashboard or in the Cohort settings sidebar opens a popup that lets you select and apply a different cohort to the dashboard.

Selecting Create new cohort at the top of the dashboard or in the Cohort settings sidebar opens a sidebar that lets you create a new cohort.

To create a new cohort:
Under Dataset cohort name, enter a name for the cohort.
Under Select filter, select one of the following data filters and configure the Included values.
- Index filters by the position of the datapoint in the full dataset. You can select an Operation like Less than and then select a Value, or you can select the Treat as categorical checkbox and then select Included values.
- Dataset filters by the value of a particular feature in the dataset. Under Select filter, select a feature like positive_words. You can then select an Operation like Less than and select a Value, or you can select the Treat as categorical checkbox and then select Included values.
- Predicted Y filters by the prediction made by the model.
- True Y filters by the actual value of the target feature.
- Classification outcome filters classification problems by type and accuracy of classification.
After you select and configure the filter, select Add filter. You can add several filters to define the cohort.
When you're done adding filters, select Save or Save and switch to finish creating the cohort.
RAI text dashboard components
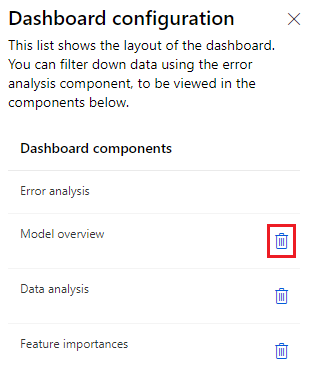
The default RAI text dashboard includes Error analysis, Model overview, Data analysis, and Feature importances components. To view and select from the list of components, select the Dashboard configuration icon at upper right.

Selecting the icon opens a side panel showing details of the dashboard layout. You can select the garbage can icon next to a component to remove the component from the dashboard.
The following sections describe the Responsible AI text dashboard components and their functionality.
Error analysis
The Error analysis component helps you analyze failure patterns in your model. You can select a metric from the Select metric dropdown list to learn more about your error and success nodes' performance. The default metric is Error rate. The metric selection doesn't impact the way your error tree is generated.

The right side of the Error analysis screen shows information about the dataset, current selected cohort, and filters applied.
- Basic Information shows the name and filters applied for the current selected cohort.
- Instances in global cohort displays the total number of points and the number of correctly and incorrectly predicted points in the entire dataset.
- Instances in the selected cohort displays the total number of points and the number of correctly and incorrectly predicted points in the currently selected cohort.
- Prediction path (filters) lists the filters applied to the full dataset to create the currently selected cohort.
If you change a view by applying filters or selecting different features, you can save the view as a new cohort by selecting Save as a new cohort.
You can view the error analysis component in Tree map or Heat map views by selecting either tab at the top of the component.
Tree map view
The Tree map view illustrates how model failure is distributed across different feature cohorts. For text data, the tree view is trained on tabular features extracted from text data and any added metadata features that users bring in.
The tree visualization uses the mutual information between each feature and the error to separate error instances from success instances hierarchically in the data. This visualization simplifies the process of discovering and highlighting common failure patterns.

In the tree view, each circle or node represents a dataset cohort, potentially with filters applied. The numbers in each node show the number of errors compared to the total number of datapoints in that node.
You can hover over or select a node to display the Error coverage, or percentage of errors in the dataset that are in that node, and Error rate, or failure percentage of the datapoints in the node. Higher node fill levels indicate greater error coverage, and darker background colors indicate higher error rates. Selected nodes have a heavy outline.
The fill lines between nodes visualize the distribution of datapoints into child cohorts based on filters, with the number of datapoints represented by line thickness. You can hover over or select a fill line to display the feature and prediction being applied.
To find important failure patterns, look for nodes with darker colors indicating a higher error rate, and thicker fill lines indicating higher error coverage.
To edit the list of features the tree uses to train the tree map, select Feature list at the top of the view.

In the Feature list pane, Features lists the names of the features in the dataset. You can search to find specific features. Importances visualizes the relative importance of each feature in the dataset. You can select or deselect the check boxes next to each feature to add or remove the feature from the tree map.
You can also configure the following settings:
- Maximum depth sets the maximum depth of the tree.
- Number of leaves sets the number of leaves in the tree.
- Minimum number of samples in one leaf sets the minimum number of samples required to create one leaf.
After you make changes in the Feature list pane, select Apply to apply the changes to the current view.
Heat map view
You can use the Heat map view to focus on specific intersectional feature filters and compute disaggregated error rates. Start by comparing two dataset features to cluster and filter your data along two dimensions. You can select one or many heatmap cells and create new cohorts.

In the Heat map view:
- Cells displays the number of cells selected. If no cells are selected, the view shows the data for all cells.
- Error coverage displays the percentage of errors in the dataset that are in the selected cells.
- Error rate displays the failure percentage of the datapoints in the selected cells.
To configure the view:
- Under Select metric, select the metric you want to view from the dropdown list.
- Under Rows: Feature 1, and Columns: Feature 2, select the features you want to compare from the dropdown lists.
- Optionally enable Quantile binning to distribute values evenly across varying ranges of bins.
- Set the Binning threshold to configure the number of values required before binning.
The cells represent cohorts of the dataset, with filters applied. Each cell shows the percentage of errors out of the total number of datapoints in the cohort.
Selected cells are outlined, and cell color darkness represents the concentration of failures. Hover over a cell to display the number correct, number incorrect, error coverage, and error rate for that cell.
Model overview
The Model overview component displays model and dataset statistics computed for cohorts across the dataset.

You can choose between Dataset cohorts or Feature cohorts by selecting either tab at the top of the component. For either view, select Metric(s) from the dropdown list or select Help me choose metrics to open a sidebar screen that explains, recommends, and lets you select metrics to display.
You can also enable Show heatmaps for either view.
Dataset cohorts
Dataset cohorts displays the selected metrics across the global cohort and all user-defined cohorts in the dashboard.

Feature cohorts
Feature cohorts displays the selected metrics for cohorts that are based on selected features. You select the Feature(s) to define the cohorts. This view also shows Fairness metrics such as Difference and Ratio parity.

Metrics visualizations or Confusion matrix
At the bottom of the component, you can choose to view Metrics visualizations or a Confusion matrix. The following example shows a confusion matrix for the Feature cohorts view.

Data analysis
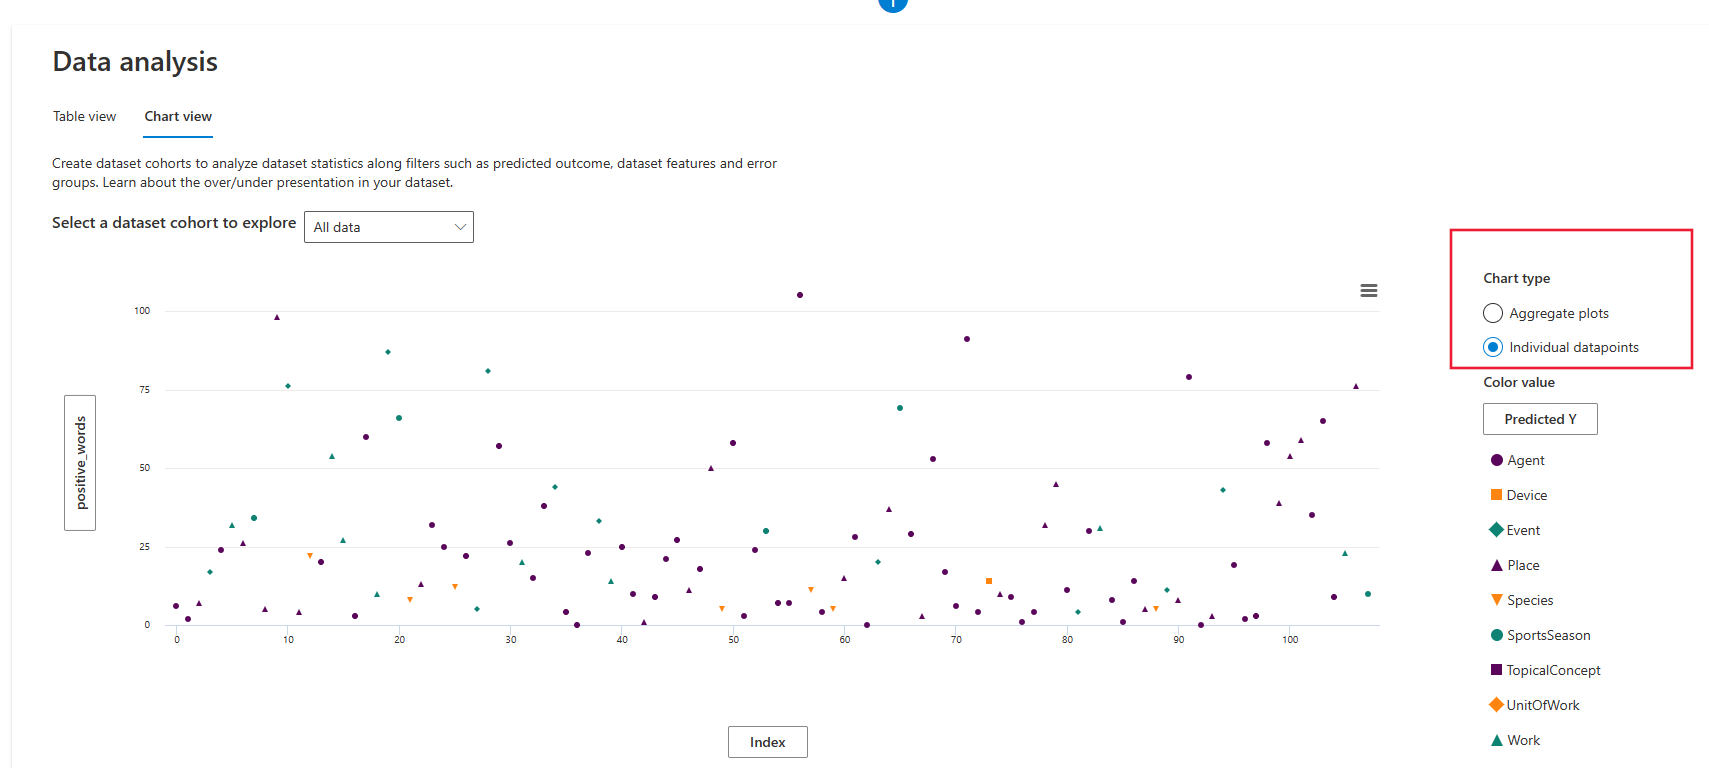
The Data analysis component creates dataset cohorts to analyze dataset statistics along filters such as predicted outcome, dataset features, and error groups. You can choose between Table view or Chart view by selecting either tab at the top of the component.
Table view
Table view shows the true and predicted values and the tabular extracted features.

Chart view
Chart view lets you choose between customized aggregation and local data exploration.

In the chart view, the X axis and Y axis show the values being plotted horizontally and vertically. You can select either label to open a sidebar pane to select and configure that axis.
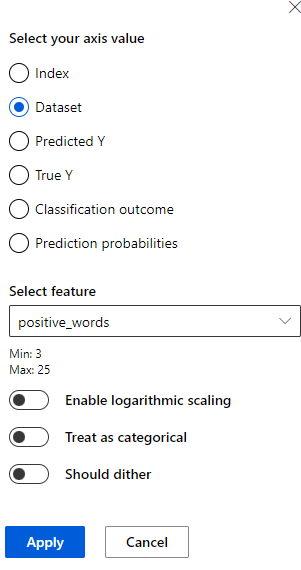
In the axis configuration pane, depending on the value, you can configure options such as Apply binning to data, Enable logarithmic scaling, or Treat as categorical. Should dither adds optional noise to the data to avoid overlapping points in the scatterplot.
Under Chart type, you can select whether to aggregate values across all datapoints.
Aggregate plot displays data in bins or categories along the X axis.
Individual datapoints displays a disaggregated view of the data.
In the Individual datapoints view, you can select the type of legend used to group datapoints. Selecting the label under Color value opens the axis configuration sidebar pane.

Feature importances
In the Feature importances component, you can choose between Aggregate feature importance or Individual feature importance by selecting either tab at the top of the component.
Aggregate feature importance
In Aggregate feature importance, you can explore the most important features that impact your overall model predictions, also known as global explanations. Use the slider to select the number of features to show side by side in descending importance. Hover over each feature to see its absolute global value.

Individual feature importance
Selecting the Individual feature importances tab shifts views to explain how specific words influence the predictions made on specific datapoints. Select a datapoint in the table to view the local feature importance values, or local explanations, from the Shapley Additive explanations (SHAP) text explainer.

In the local explanation chart, you can configure:
- Show most important words to select the number of most important words to highlight in the text.
- Class importance weights to select the class or an aggregate view of the top most important words.

Related content
- Learn more about the concepts and techniques behind the Responsible AI dashboard.
- View sample YAML and Python notebooks to generate Responsible AI dashboards with YAML or Python.
Feedback
Coming soon: Throughout 2024 we will be phasing out GitHub Issues as the feedback mechanism for content and replacing it with a new feedback system. For more information see: https://aka.ms/ContentUserFeedback.
Submit and view feedback for