Note
Access to this page requires authorization. You can try signing in or changing directories.
Access to this page requires authorization. You can try changing directories.
Microsoft Discovery Supercomputer logs provide visibility into platform orchestration, Kubernetes cluster activity, system health, tool execution, and bookshelf indexing operations. These logs are automatically collected and stored in a dedicated Log Analytics workspace within the Supercomputer's Managed Resource Group (MRG).
This article describes the available log tables, their schemas, and example queries for common diagnostic scenarios.
Prerequisites
Before you begin, navigate to the Log Analytics workspace in your supercomputer's MRG. For instructions, see Access resource logs for Microsoft Discovery resources.
Available log tables
The following tables are available in the supercomputer's MRG Log Analytics workspace:
| Table | Category | Description |
|---|---|---|
KubePodInventory_CL |
Platform and orchestration | Tracks pod creation, placement, and lifecycle state across the cluster |
KubeEvents_CL |
Platform and orchestration | Captures Kubernetes events such as scheduling failures and volume mount errors |
Syslog_CL |
Platform and orchestration | Records OS-level signals related to node health and underlying infrastructure |
SystemContainerLogs_CL |
System component application | Logs from platform-managed controllers and orchestration services |
DiscoveryToolLogs_CL |
Tool execution application | Application logs from tool containers, including execution output and failures |
DiscoveryBookshelfLogs_CL |
Bookshelf indexing | Logs from bookshelf indexing jobs, including execution behavior and failures |
Query logs
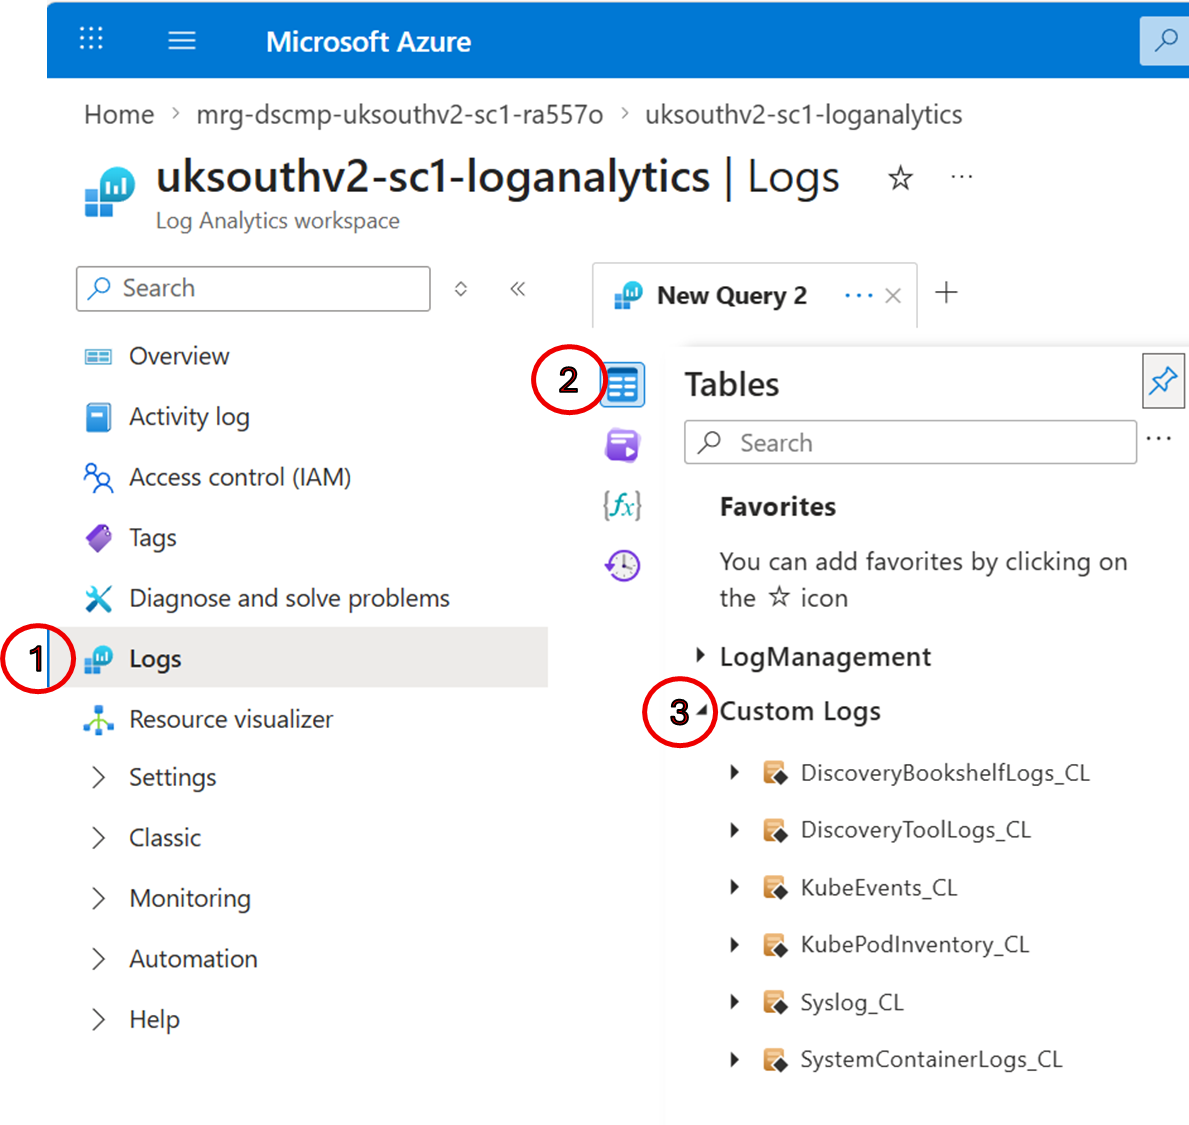
- In the Logs interface, select the Tables tab in the left panel.
- Expand Custom Logs and locate the table you want to query.
- Select Run next to the table name to execute a default query and confirm log ingestion.
General query examples
In the following examples, replace tableName with the name of the table you want to query, for example KubePodInventory_CL.
View recent entries
tableName
| take 100
Filter by time range
tableName
| where TimeGenerated > ago(1h)
| order by TimeGenerated desc
Search for errors and failures
tableName
| where * has "error" or * has "fail"
| order by TimeGenerated desc
KubeEvents_CL query examples
View recent pod events
KubeEvents_CL
| where TimeGenerated > ago(1h)
| where ObjectKind == "Pod"
Find nodes with warnings
KubeEvents_CL
| where ObjectKind == "Node"
| where KubeEventType == "Warning"
Trace container lifecycle events for a specific pod
Replace the pod name with the name of the pod you want to investigate:
KubeEvents_CL
| where ObjectKind == "Pod"
| where Name == "<pod-name>"
Check whether a specific job completed or failed
Replace <first-16-chars-of-toolRunId> with the first 16 characters of your toolRunId.
KubeEvents_CL
| where Namespace == "scorch"
| where Name has "<first-16-chars-of-toolRunId>"
| where Reason in ("AllJobsCompleted", "FailedJobs", "BackoffLimitExceeded", "Completed", "FinishedWorkload")
| project TimeGenerated, Reason, ObjectKind, Name, Message
| order by TimeGenerated desc
View the full job lifecycle timeline
See every stage a job went through, from workload creation to admission, scheduling, and completion.
KubeEvents_CL
| where Namespace == "scorch"
| where Name has "<first-16-chars-of-toolRunId>"
| project TimeGenerated, KubeEventType, Reason, ObjectKind, Name, Message
| order by TimeGenerated asc
Find failure details for a specific job
Get detailed warning events for a specific job run. Common Reason values are listed in the table at bottom of this section.
KubeEvents_CL
| where KubeEventType == "Warning"
| where Namespace == "scorch"
| where Name has "<first-16-chars-of-toolRunId>"
| project TimeGenerated, Reason, ObjectKind, Name, Message
| order by TimeGenerated desc
| Reason | Meaning |
|---|---|
BackoffLimitExceeded |
Job retried and exhausted all retry attempts |
FailedJobs |
One or more jobs in the jobset failed |
Failed |
Container failed (image pull error, missing entrypoint, OCI error) |
FailedScheduling |
Kubernetes couldn't schedule the pod |
Pending |
Queued, insufficient cluster quota for the requested node flavor |
Killing |
Container was forcibly terminated |
Unhealthy |
Container health check failed |
FailedMount |
Volume or secret couldn't be mounted |
Detect jobs stuck in queue
If a job is queued but not running, it can be waiting for cluster quota.
KubeEvents_CL
| where Namespace == "scorch"
| where Reason == "Pending"
| where Name has "<first-16-chars-of-toolRunId>"
| project TimeGenerated, Name, Message
| order by TimeGenerated desc
To see all currently pending jobs across the supercomputer:
KubeEvents_CL
| where Namespace == "scorch"
| where Reason == "Pending"
| extend flavor = extract(@"in flavor ([\w-]+)", 1, Message)
| summarize pending_count = count() by bin(TimeGenerated, 15m), flavor
| order by TimeGenerated desc
Detect container startup failures
Identify if a container failed to start due to image pull errors or missing entrypoints.
KubeEvents_CL
| where KubeEventType == "Warning"
| where Reason == "Failed"
| where Namespace == "scorch"
| where Name has "<first-16-chars-of-toolRunId>"
| where Message has_any ("ErrImagePull", "ImagePullBackOff", "executable file not found", "no such file", "OCI runtime", "containerd")
| extend failure_type = case(
    Message has "ErrImagePull" or Message has "ImagePullBackOff", "Image Pull Failure",
    Message has "executable file not found", "Missing Entrypoint",
    Message has "no such file or directory", "Missing Script/File",
    Message has "OCI runtime", "Container Runtime Error",
    "Other")
| project TimeGenerated, Name, failure_type, Message
| order by TimeGenerated desc
View recent failures across all SC tool runs
See which jobs have recently failed across the entire cluster, useful for understanding if there's a systemic issue.
KubeEvents_CL
| where KubeEventType == "Warning"
| where Namespace == "scorch"
| where Reason in ("BackoffLimitExceeded", "FailedJobs", "Failed")
| summarize failure_count = count() by bin(TimeGenerated, 1h), Reason
| order by TimeGenerated desc
View most common failure reasons across all SC jobs
KubeEvents_CL
| where KubeEventType == "Warning"
| where Namespace == "scorch"
| summarize count() by Reason
| order by count_ desc
KubePodInventory_CL query examples
Find pods in CrashLoopBackOff
KubePodInventory_CL
| where ContainerStatus == "waiting"
| where ContainerStatusReason == "CrashLoopBackOff" or ContainerStatusReason == "Error"
Check pod status and restart count for a specific job
Replace <first-16-chars-of-toolRunId> with the first 16 characters of your toolRunId.
KubePodInventory_CL
| where Namespace == "scorch"
| where Name has "<first-16-chars-of-toolRunId>"
| project TimeGenerated, Name, PodStatus, ContainerStatus, ContainerStatusReason,
          PodRestartCount = toint(PodRestartCount), ContainerRestartCount = toint(ContainerRestartCount)
| order by TimeGenerated desc
Find pods stuck in Pending state
This query shows pods that haven't started, along with how long they have been pending:
KubePodInventory_CL
| where PodStatus == "Pending"
| project PodCreationTimeStamp, Namespace, PodStartTime, PodStatus, Name, ContainerStatus
| summarize Start = any(PodCreationTimeStamp), arg_max(PodStartTime, Namespace) by Name
| extend PodStartTime = iff(isnull(PodStartTime), now(), PodStartTime)
| extend PendingTime = PodStartTime - Start
| project Name, Namespace, PendingTime
Find OOMKilled pods
KubePodInventory_CL
| where ContainerStatusReason == "OOMKilled"
| order by TimeGenerated desc
DiscoveryToolLogs_CL query examples
View recent tool execution logs
DiscoveryToolLogs_CL
| take 100
Filter tool logs by time range
DiscoveryToolLogs_CL
| where TimeGenerated > ago(1h)
| order by TimeGenerated desc
Find tool execution errors
DiscoveryToolLogs_CL
| where * has "error" or * has "exception"
| order by TimeGenerated desc
View all logs for a specific run
Replace <your-toolRunId> with your run ID, which is returned by the SC API when you submit a job.
DiscoveryToolLogs_CL
| where toolRunId == "<your-toolRunId>"
| project TimeGenerated, toolName, jobName, Message
| order by TimeGenerated asc
Find your most recent runs
List recent tool runs with their start and end times. Useful if you need to retrieve a toolRunId you didn't record.
DiscoveryToolLogs_CL
| summarize start_time = min(TimeGenerated), end_time = max(TimeGenerated), log_count = count()
  by toolRunId, toolName, jobName, imageTag
| order by start_time desc
To filter by a specific tool name:
DiscoveryToolLogs_CL
| where toolName == "<your-tool-name>"
| summarize start_time = min(TimeGenerated), end_time = max(TimeGenerated), log_count = count()
  by toolRunId, toolName, jobName, imageTag
| order by start_time desc
Calculate run duration
Calculate the wall-clock duration of a tool execution from first to last log line. Replace <your-toolRunId> with your run ID.
DiscoveryToolLogs_CL
| where toolRunId == "<your-toolRunId>"
| summarize start_time = min(TimeGenerated), end_time = max(TimeGenerated)
| extend duration_minutes = datetime_diff('minute', end_time, start_time)
| project start_time, end_time, duration_minutes
DiscoveryBookshelfLogs_CL query examples
For detailed guidance on querying bookshelf indexing logs, including how to trace logs for a specific knowledgebase, see Query bookshelf indexing logs.
Syslog_CL query examples
Detect kubelet restarts on compute nodes
Identify nodes where kubelet was stopped or restarted, which would interrupt any workload running on that node.
Syslog_CL
| where ProcessName == "systemd"
| where SyslogMessage has "kubelet" and SyslogMessage has_any ("killed", "failed", "restarting", "stopped")
| project TimeGenerated, HostName, HostIP, SeverityLevel, SyslogMessage
| order by TimeGenerated desc
To scope to a specific node, replace <nodeName> with the node name from a pod inventory or Kubernetes event query:
Syslog_CL
| where HostName == "<nodeName>"
| where ProcessName == "systemd"
| where SyslogMessage has "kubelet" and SyslogMessage has_any ("killed", "failed", "restarting", "stopped")
| project TimeGenerated, HostName, HostIP, SeverityLevel, SyslogMessage
| order by TimeGenerated desc
Troubleshooting
No data in tables
| Cause | Resolution |
|---|---|
| Supercomputer was recently created and no jobs have run | Run an investigation or indexing job and generate log entries |
| Time range is too narrow | Expand the time range to the last 24 hours |
| Logs are delayed due to ingestion latency | Wait a few seconds and rerun the query |
Query timeout or slow performance
| Cause | Resolution |
|---|---|
| Query scope is too broad | Narrow the time range or add filters |
| Complex aggregations across large datasets | Use take or limit to restrict the result set |