Visualize Azure Network Watcher NSG flow logs using open source tools
Important
On September 30, 2027, network security group (NSG) flow logs will be retired. As part of this retirement, you'll no longer be able to create new NSG flow logs starting June 30, 2025. We recommend migrating to virtual network flow logs, which overcome the limitations of NSG flow logs. After the retirement date, traffic analytics enabled with NSG flow logs will no longer be supported, and existing NSG flow logs resources in your subscriptions will be deleted. However, NSG flow logs records won't be deleted and will continue to follow their respective retention policies. For more information, see the official announcement.
Network security group flow logs provide information that can be used understand ingress and egress IP traffic on network security groups. These flow logs show outbound and inbound flows on a per rule basis, the NIC the flow applies to, 5-tuple information about the flow (Source/Destination IP, Source/Destination Port, Protocol), and if the traffic was allowed or denied.
These flow logs can be difficult to manually parse and gain insights from. However, there are several open source tools that can help visualize this data. This article provides a solution to visualize these logs using the Elastic Stack, which allows you to quickly index and visualize your flow logs on a Kibana dashboard.
Scenario
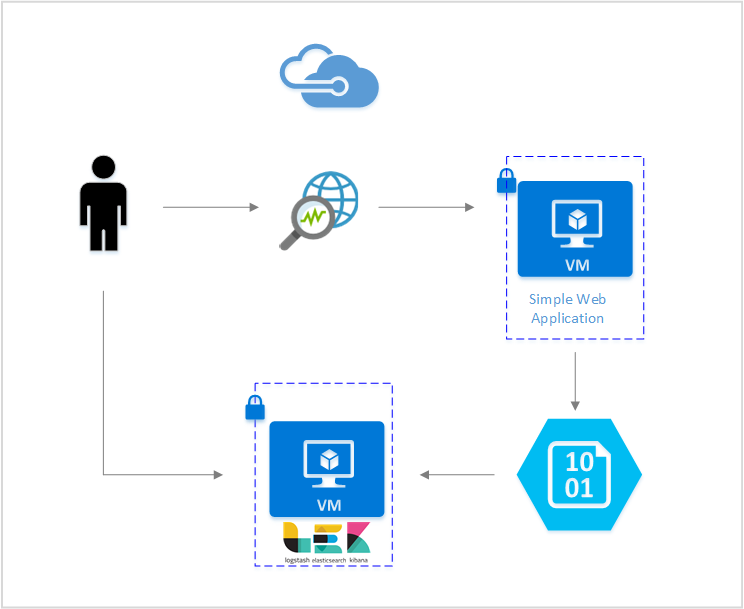
In this article, we set up a solution that allows you to visualize network security group flow logs using the Elastic Stack. A Logstash input plugin obtains the flow logs directly from the storage blob configured for containing the flow logs. Then, using the Elastic Stack, the flow logs are indexed and used to create a Kibana dashboard to visualize the information.
Steps
Enable network security group flow logging
For this scenario, you must have network security group Flow Logging enabled on at least one network security group in your account. For instructions on enabling Network Security Flow Logs, see the following article Introduction to flow logging for network security groups.
Set up the Elastic Stack
By connecting NSG flow logs with the Elastic Stack, we can create a Kibana dashboard what allows us to search, graph, analyze, and derive insights from our logs.
Install Elasticsearch
The following instructions are used to install Elasticsearch in Ubuntu Azure VMs. For instructions on how to install elastic search in Red Hat Enterprise Linux, see Install Elasticsearch with RPM.
The Elastic Stack from version 5.0 and above requires Java 8. Run the command
java -versionto check your version. If you don't have Java installed, see the documentation on the Azure-suppored JDKs.Download the correct binary package for your system:
curl -L -O https://artifacts.elastic.co/downloads/elasticsearch/elasticsearch-5.2.0.deb
sudo dpkg -i elasticsearch-5.2.0.deb
sudo /etc/init.d/elasticsearch start
Other installation methods can be found at Elasticsearch Installation
Verify that Elasticsearch is running with the command:
curl http://127.0.0.1:9200You should see a response similar to the following:
{
"name" : "Angela Del Toro",
"cluster_name" : "elasticsearch",
"version" : {
    "number" : "5.2.0",
    "build_hash" : "8ff36d139e16f8720f2947ef62c8167a888992fe",
    "build_timestamp" : "2016-01-27T13:32:39Z",
    "build_snapshot" : false,
    "lucene_version" : "6.1.0"
},
"tagline" : "You Know, for Search"
}
For further instructions on installing Elastic search, see Installation instructions.
Install Logstash
The following instructions are used to install Logstash in Ubuntu. For instructions on how to install this package in Red Hat Enterprise Linux, see the Installing from Package Repositories - yum article.
To install Logstash run the following commands:
curl -L -O https://artifacts.elastic.co/downloads/logstash/logstash-5.2.0.deb
sudo dpkg -i logstash-5.2.0.deb
Next we need to configure Logstash to access and parse the flow logs. Create a logstash.conf file using:
sudo touch /etc/logstash/conf.d/logstash.confAdd the following content to the file:
input {
   azureblob
     {
         storage_account_name => "mystorageaccount"
         storage_access_key => "VGhpcyBpcyBhIGZha2Uga2V5Lg=="
         container => "insights-logs-networksecuritygroupflowevent"
         codec => "json"
         # Refer https://learn.microsoft.com/azure/network-watcher/network-watcher-read-nsg-flow-logs
         # Typical numbers could be 21/9 or 12/2 depends on the nsg log file types
         file_head_bytes => 12
         file_tail_bytes => 2
         # Enable / tweak these settings when event is too big for codec to handle.
         # break_json_down_policy => "with_head_tail"
         # break_json_batch_count => 2
     }
   }

   filter {
     split { field => "[records]" }
     split { field => "[records][properties][flows]"}
     split { field => "[records][properties][flows][flows]"}
     split { field => "[records][properties][flows][flows][flowTuples]"}

  mutate{
   split => { "[records][resourceId]" => "/"}
   add_field => {"Subscription" => "%{[records][resourceId][2]}"
                 "ResourceGroup" => "%{[records][resourceId][4]}"
                 "NetworkSecurityGroup" => "%{[records][resourceId][8]}"}
   convert => {"Subscription" => "string"}
   convert => {"ResourceGroup" => "string"}
   convert => {"NetworkSecurityGroup" => "string"}
   split => { "[records][properties][flows][flows][flowTuples]" => ","}
   add_field => {
               "unixtimestamp" => "%{[records][properties][flows][flows][flowTuples][0]}"
               "srcIp" => "%{[records][properties][flows][flows][flowTuples][1]}"
               "destIp" => "%{[records][properties][flows][flows][flowTuples][2]}"
               "srcPort" => "%{[records][properties][flows][flows][flowTuples][3]}"
               "destPort" => "%{[records][properties][flows][flows][flowTuples][4]}"
               "protocol" => "%{[records][properties][flows][flows][flowTuples][5]}"
               "trafficflow" => "%{[records][properties][flows][flows][flowTuples][6]}"
               "traffic" => "%{[records][properties][flows][flows][flowTuples][7]}"
               "flowstate" => "%{[records][properties][flows][flows][flowTuples][8]}"
                "packetsSourceToDest" => "%{[records][properties][flows][flows][flowTuples][9]}"
                "bytesSentSourceToDest" => "%{[records][properties][flows][flows][flowTuples][10]}"
                "packetsDestToSource" => "%{[records][properties][flows][flows][flowTuples][11]}"
                "bytesSentDestToSource" => "%{[records][properties][flows][flows][flowTuples][12]}"
                }
   convert => {"unixtimestamp" => "integer"}
   convert => {"srcPort" => "integer"}
   convert => {"destPort" => "integer"}
  }

  date{
    match => ["unixtimestamp" , "UNIX"]
  }
 }
output {
  stdout { codec => rubydebug }
  elasticsearch {
    hosts => "localhost"
    index => "nsg-flow-logs"
  }
}
For further instructions on installing Logstash, see the official documentation.
Install the Logstash input plugin for Azure blob storage
This Logstash plugin allows you to directly access the flow logs from their designated storage account. To install this plugin, from the default Logstash installation directory run the command:
sudo /usr/share/logstash/bin/logstash-plugin install logstash-input-azureblob
To start Logstash run the command:
sudo /etc/init.d/logstash start
For more information about this plugin, see the documentation.
Install Kibana
For instructions on how to install Kibana in Red Hat Enterprise Linux, see Install Kibana with RPM. For instructions about how to install Kibana in Ubuntu/Debian systems using a repository package, see Install Kibana from APT repository.
Then following instructions were tested in Ubuntu and could be used in different Linux distributions as they aren't Ubuntu specific.
Run the following commands to install Kibana:
curl -L -O https://artifacts.elastic.co/downloads/kibana/kibana-5.2.0-linux-x86_64.tar.gz
tar xzvf kibana-5.2.0-linux-x86_64.tar.gz
To run Kibana use the commands:
cd kibana-5.2.0-linux-x86_64/
./bin/kibana
To view your Kibana web interface, navigate to
http://localhost:5601For this scenario, the index pattern used for the flow logs is "nsg-flow-logs". You may change the index pattern in the "output" section of your logstash.conf file.
If you want to view the Kibana dashboard remotely, create an inbound NSG rule allowing access to port 5601.
Create a Kibana dashboard
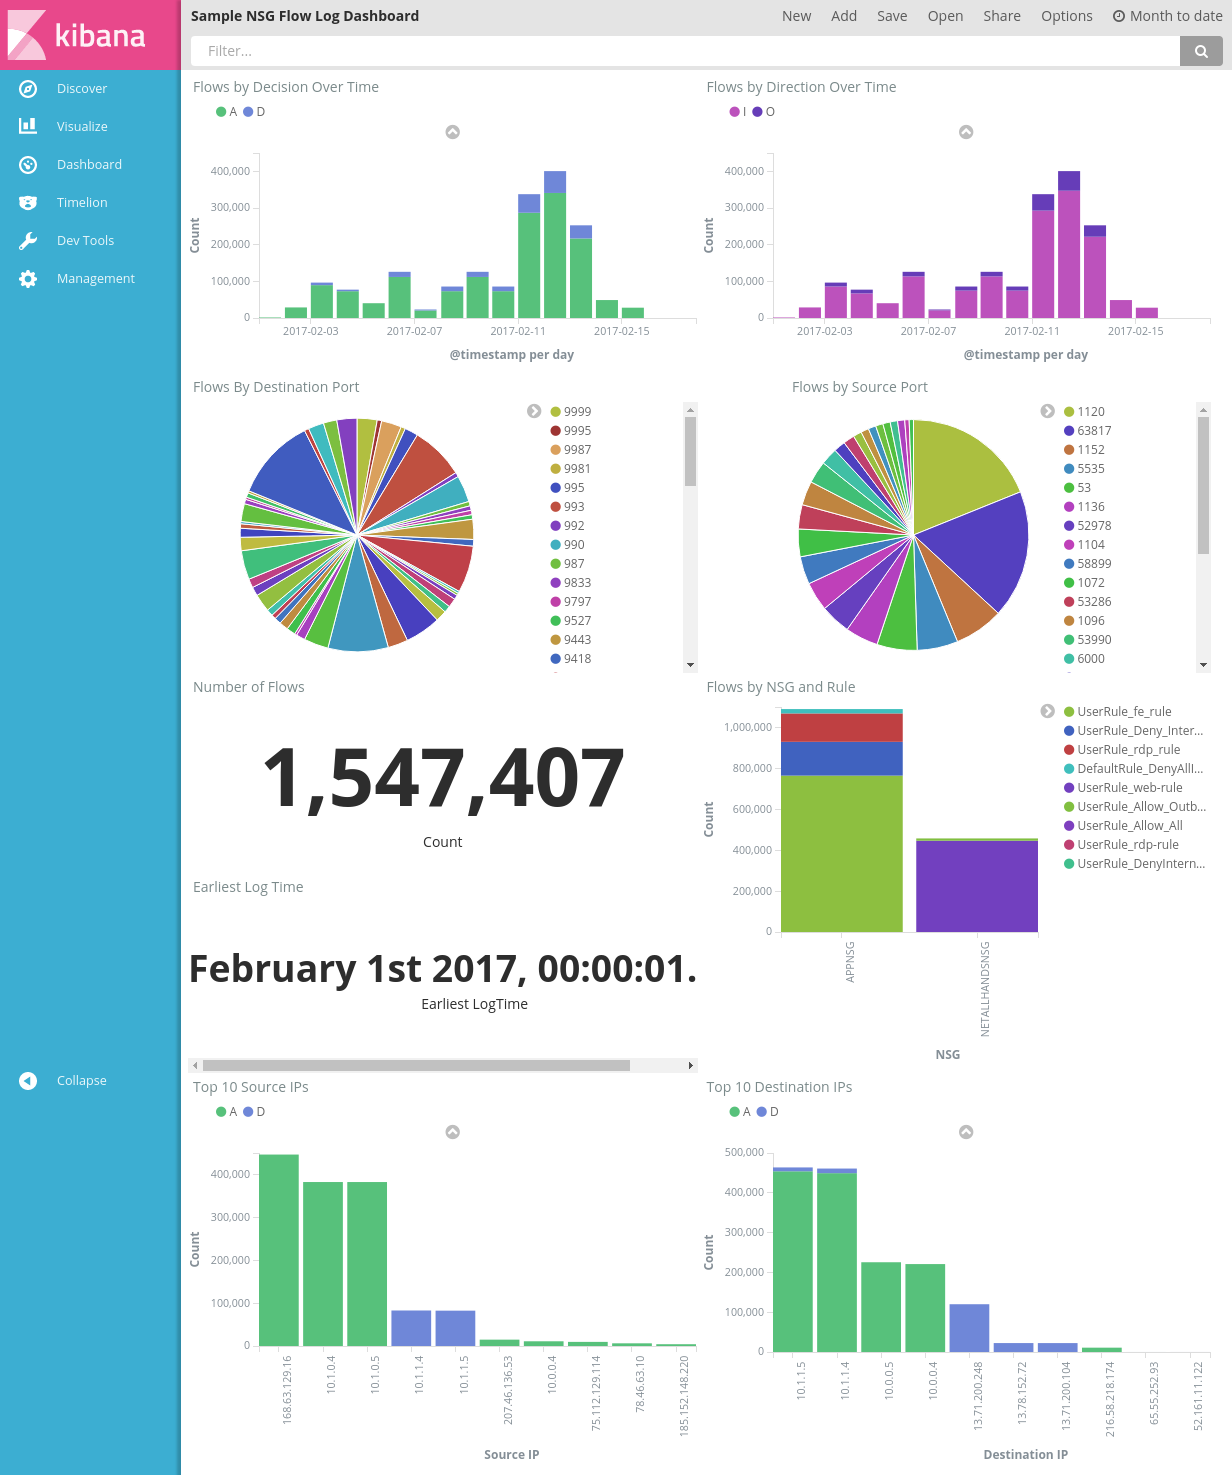
A sample dashboard to view trends and details in your alerts is shown in the following picture:
Download the dashboard file, the visualization file, and the saved search file.
Under the Management tab of Kibana, navigate to Saved Objects and import all three files. Then from the Dashboard tab you can open and load the sample dashboard.
You can also create your own visualizations and dashboards tailored towards metrics of your own interest. Read more about creating Kibana visualizations from Kibana's official documentation.
Visualize NSG flow logs
The sample dashboard provides several visualizations of the flow logs:
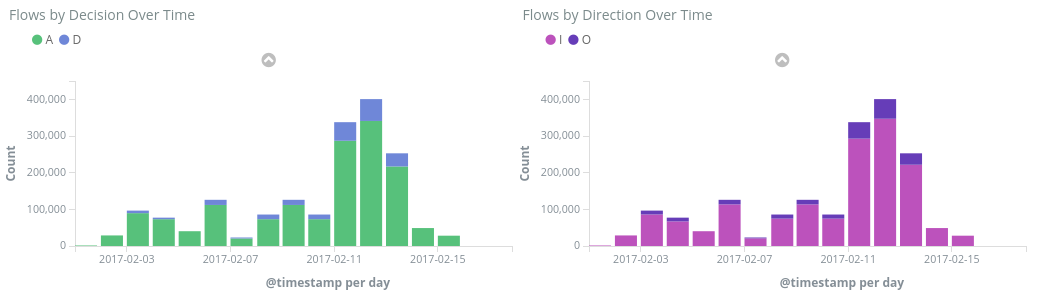
Flows by Decision/Direction Over Time - time series graphs showing the number of flows over the time period. You can edit the unit of time and span of both these visualizations. Flows by Decision shows the proportion of allow or deny decisions made, while Flows by Direction shows the proportion of inbound and outbound traffic. With these visuals, you can examine traffic trends over time and look for any spikes or unusual patterns.
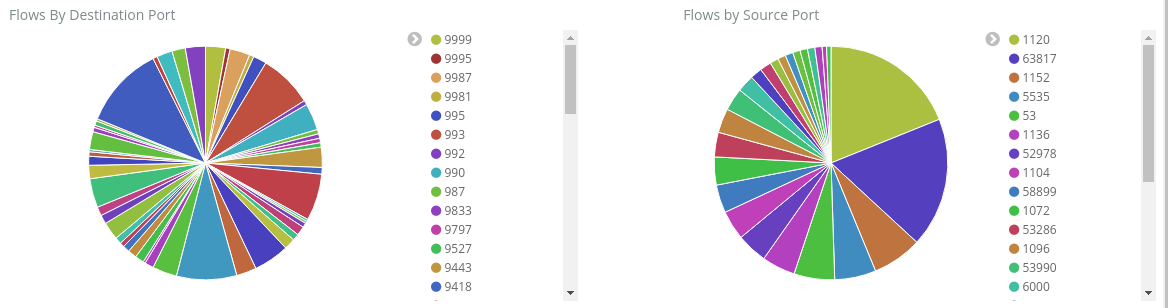
Flows by Destination/Source Port – pie charts showing the breakdown of flows to their respective ports. With this view, you can see your most commonly used ports. If you click on a specific port within the pie chart, the rest of the dashboard filters down to flows of that port.
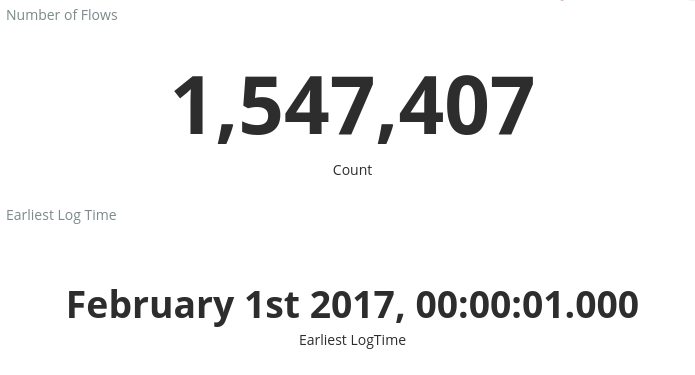
Number of Flows and Earliest Log Time – metrics showing you the number of flows recorded and the date of the earliest log captured.
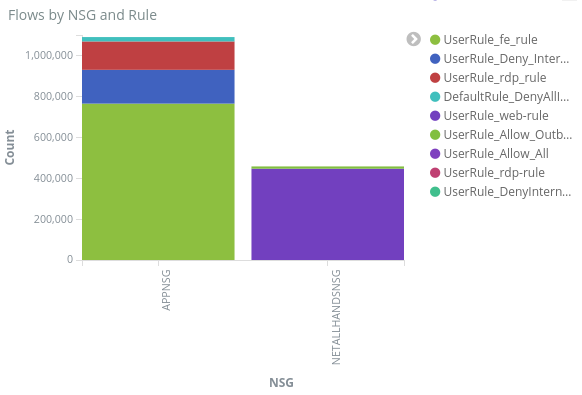
Flows by NSG and Rule – a bar graph showing you the distribution of flows within each NSG, and the distribution of rules within each NSG. , you can see which NSG and rules generated the most traffic.
Top 10 Source/Destination IPs – bar charts showing the top 10 source and destination IPs. You can adjust these charts to show more or less top IPs. From here, you can see the most commonly occurring IPs and the traffic decision (allow or deny) being made towards each IP.
Flow Tuples – a table showing the information contained within each flow tuple, and its corresponding NGS and rule.
Using the query bar at the top of the dashboard, you can filter down the dashboard based on any parameter of the flows, such as subscription ID, resource groups, rule, or any other variable of interest. For more about Kibana's queries and filters, see the official documentation
Conclusion
By combining the network security group flow logs with the Elastic Stack, we have come up with powerful and customizable way to visualize our network traffic. These dashboards allow you to quickly gain and share insights about your network traffic, and filter down and investigate on any potential anomalies. Using Kibana, you can tailor these dashboards and create specific visualizations to meet any security, audit, and compliance needs.
Next step
Learn how to visualize your NSG flow logs with Power BI by visiting Visualize NSG flows logs with Power BI