Note
Access to this page requires authorization. You can try signing in or changing directories.
Access to this page requires authorization. You can try changing directories.
Traffic analytics is a cloud-based solution that provides visibility into user and application activity in your cloud networks. Specifically, traffic analytics analyzes Azure Network Watcher flow logs to provide insights into traffic flow in your Azure cloud. With traffic analytics, you can:
Visualize network activity across your Azure subscriptions.
Identify hot spots.
Secure your network by using information about the following components to identify threats:
- Open ports
- Applications that attempt to access the internet
- Virtual machines (VMs) that connect to rogue networks
Optimize your network deployment for performance and capacity by understanding traffic flow patterns across Azure regions and the internet.
Pinpoint network misconfigurations that can lead to failed connections in your network.
Why traffic analytics?
It's vital to monitor, manage, and know your own network for uncompromised security, compliance, and performance. Knowing your own environment is of paramount importance to protect and optimize it. You often need to know the current state of the network, including the following information:
- Who is connecting to the network?
- Where are they connecting from?
- Which ports are open to the internet?
- What's the expected network behavior?
- Is there any irregular network behavior?
- Are there any sudden rises in traffic?
Cloud networks are different from on-premises enterprise networks. In on-premises networks, routers and switches support NetFlow and other, equivalent protocols. You can use these devices to collect data about IP network traffic as it enters or exits a network interface. By analyzing traffic flow data, you can build an analysis of network traffic flow and volume.
With Azure virtual networks, flow logs collect data about the network. These logs provide information about ingress and egress IP traffic through a network security group or a virtual network. Traffic analytics analyzes raw flow logs and combines the log data with intelligence about security, topology, and geography. Traffic analytics then provides you with insights into traffic flow in your environment.
Traffic analytics provides the following information:
- Most-communicating hosts
- Most-communicating application protocols
- Most-conversing host pairs
- Allowed and blocked traffic
- Inbound and outbound traffic
- Open internet ports
- Most-blocking rules
- Traffic distribution per Azure datacenter, virtual network, subnets, or rogue network
Key components
To use traffic analytics, you need the following components:
Network Watcher: A regional service that you can use to monitor and diagnose conditions at a network-scenario level in Azure. You can use Network Watcher to turn flow logs on and off in your subscription. For more information, see What is Azure Network Watcher? and Enable or disable Azure Network Watcher.
Log Analytics: A tool in the Azure portal that you use to work with Azure Monitor Logs data. Azure Monitor Logs is an Azure service that collects monitoring data and stores the data in a central repository. This data can include events, performance data, or custom data that's provided through the Azure API. After this data is collected, it's available for alerting, analysis, and export. Monitoring applications such as network performance monitor and traffic analytics use Azure Monitor Logs as a foundation. For more information, see Azure Monitor Logs. Log Analytics provides a way to edit and run queries on logs. You can also use this tool to analyze query results. For more information, see Overview of Log Analytics in Azure Monitor.
Log Analytics workspace: The environment that stores Azure Monitor log data that pertains to an Azure account. For more information about Log Analytics workspaces, see Overview of Log Analytics workspace and Create a Log Analytics workspace.
Additionally, you need a network security group enabled for flow logging if you're using traffic analytics to analyze network security group flow logs or a virtual network enabled for flow logging if you're using traffic analytics to analyze virtual network flow logs:
Network security group (NSG): A resource that contains a list of security rules that allow or deny network traffic to or from resources that are connected to an Azure virtual network. Network security groups can be associated with subnets, network interfaces (NICs) that are attached to VMs (Resource Manager), or individual VMs (classic). For more information, see Network security group overview.
Network security group flow logs: Recorded information about ingress and egress IP traffic through a network security group. Network security group flow logs are written in JSON format and include:
- Outbound and inbound flows on a per rule basis.
- The NIC that the flow applies to.
- Information about the flow, such as the source and destination IP addresses, the source and destination ports, and the protocol.
- The status of the traffic, such as allowed or denied.
For more information, see Network security group flow logs overview and Create a network security group flow log.
Virtual network (VNet): A resource that enables many types of Azure resources to securely communicate with each other, the internet, and on-premises networks. For more information, see Virtual network overview.
Virtual network flow logs: Recorded information about ingress and egress IP traffic through a virtual network. Virtual network flow logs are written in JSON format and include:
- Outbound and inbound flows.
- Information about the flow, such as the source and destination IP addresses, the source and destination ports, and the protocol.
- The status of the traffic, such as allowed or denied.
For more information, see Virtual network flow logs overview and Create a virtual network flow log. To learn about the differences between network security group flow logs and virtual network flow logs, see Virtual network flow logs compared to network security group flow logs.
Note
To use Traffic analytics, you must have the required permissions. For more information, see Traffic analytics permissions.
How traffic analytics works
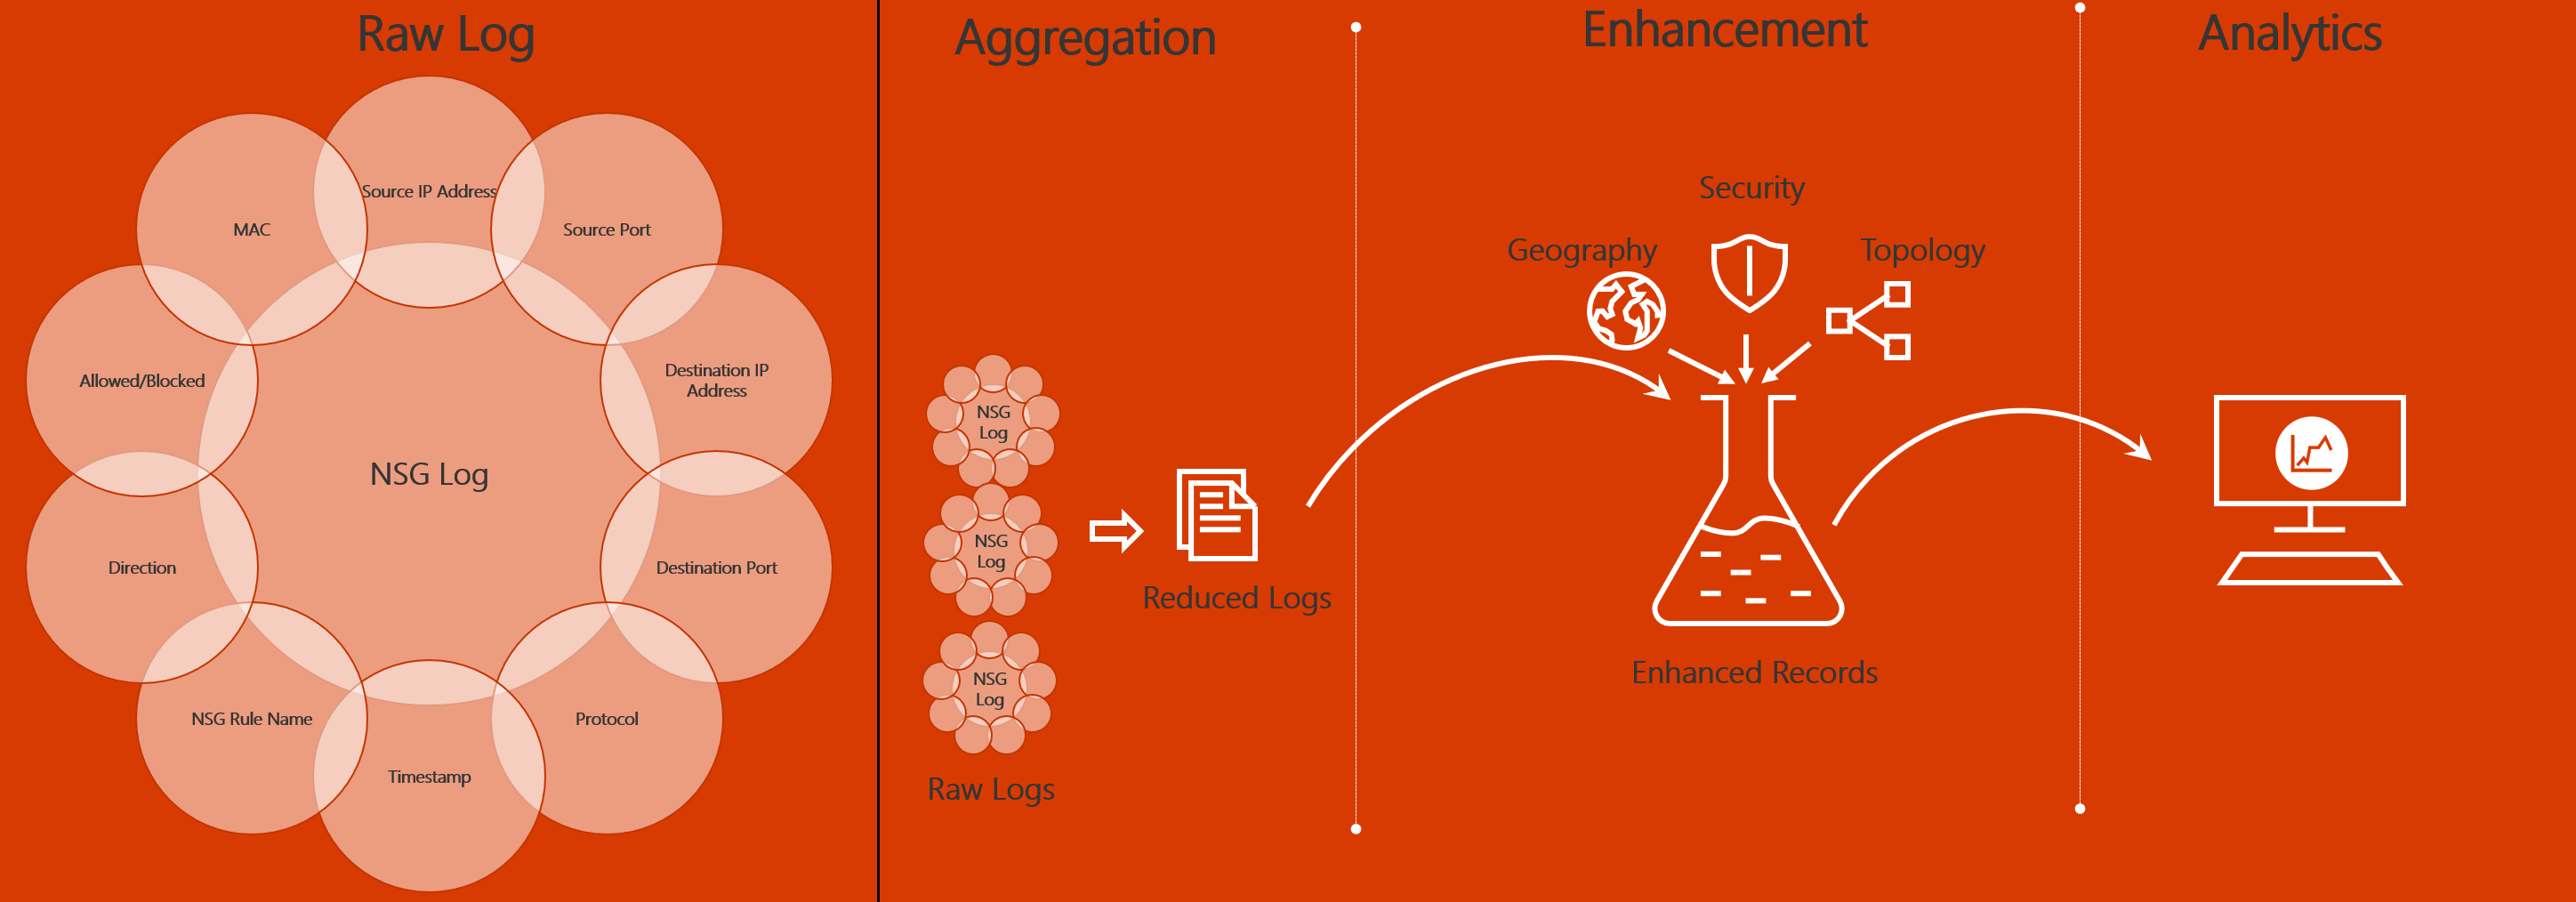
Traffic analytics examines raw flow logs. It then reduces the log volume by aggregating flows that have a common source IP address, destination IP address, destination port, and protocol.
An example might involve Host 1 at IP address 10.10.10.10 and Host 2 at IP address 10.10.20.10. Suppose these two hosts communicate 100 times over a period of one hour. The raw flow log has 100 entries in this case. If these hosts use the HTTP protocol on port 80 for each of those 100 interactions, the reduced log has one entry. That entry states that Host 1 and Host 2 communicated 100 times over a period of one hour by using the HTTP protocol on port 80.
Reduced logs are enhanced with geography, security, and topology information and then stored in a Log Analytics workspace. The following diagram shows the data flow:
Availability
The following tables list the supported regions where you can enable traffic analytics for your flow logs and the Log Analytics workspaces that you can use.
- North America / South America
- Europe
- Australia / Asia / Pacific
- Middle East / Africa
- Azure Government
| Region | Virtual network flow logs | Traffic analytics | Log Analytics workspace |
|---|---|---|---|
| Brazil South | ✓ | ✓ | ✓ |
| Brazil Southeast | ✓ | ✓ | ✓ |
| Canada Central | ✓ | ✓ | ✓ |
| Canada East | ✓ | ✓ | ✓ |
| Central US | ✓ | ✓ | ✓ |
| Chile Central | ✓ | ✓ | ✓ |
| East US | ✓ | ✓ | ✓ |
| East US 2 | ✓ | ✓ | ✓ |
| Mexico Central | ✓ | ✓ | |
| North Central US | ✓ | ✓ | ✓ |
| South Central US | ✓ | ✓ | ✓ |
| West Central US | ✓ | ✓ | ✓ |
| West US | ✓ | ✓ | ✓ |
| West US 2 | ✓ | ✓ | ✓ |
| West US 3 | ✓ | ✓ | ✓ |
Note
If flow logs are supported in a region, but Log Analytics workspace isn't supported in that region for traffic analytics, you can use a Log Analytics workspace from any other supported region. In this case, there won't be any additional cross-region data transfer charges for using a Log Analytics workspace from another region.
Pricing
For pricing details, see Network Watcher pricing and Azure Monitor pricing.
Traffic analytics FAQ
To get answers to the most frequently asked questions about traffic analytics, see Traffic analytics FAQ.