Microsoft Sentinel solution for SAP® applications - SAP Audit Controls workbook (Preview)
This article describes the SAP Audit Controls workbook, which is provided to you as part of the Microsoft Sentinel solution for SAP® applications.
Important
The Microsoft Sentinel SAP Audit Controls workbook is currently in PREVIEW. The Azure Preview Supplemental Terms include additional legal terms that apply to Azure features that are in beta, preview, or otherwise not yet released into general availability.
This workbook helps you check your SAP® environment's security controls for compliance with your chosen control framework, be it SOX, NIST, or a custom framework of your choice.
The workbook provides tools for you to assign analytics rules in your environment to specific security controls and control families, monitor and categorize the incidents generated by the SAP solution-based analytics rules, and report on your compliance.
The workbook provides the following capabilities for your compliance program:
- See recommendations on which analytics rules to enable, and enable them in-place with proper pre-set configuration.
- Associate your analytics rules to the SOX or NIST control framework, or apply your own custom control framework.
- Review incidents and alerts summarized by control, according to the selected control framework.
- Export relevant incidents for further analysis, for auditing and reporting purposes.
Start using the workbook
From the Microsoft Sentinel portal, select Workbooks from the Threat management menu.
In the Workbooks gallery, go to Templates and enter SAP in the search bar, and select SAP Audit Controls from among the results.
Select View template to use the workbook as is, or select Save to create an editable copy of the workbook. When the copy is created, select View saved workbook.
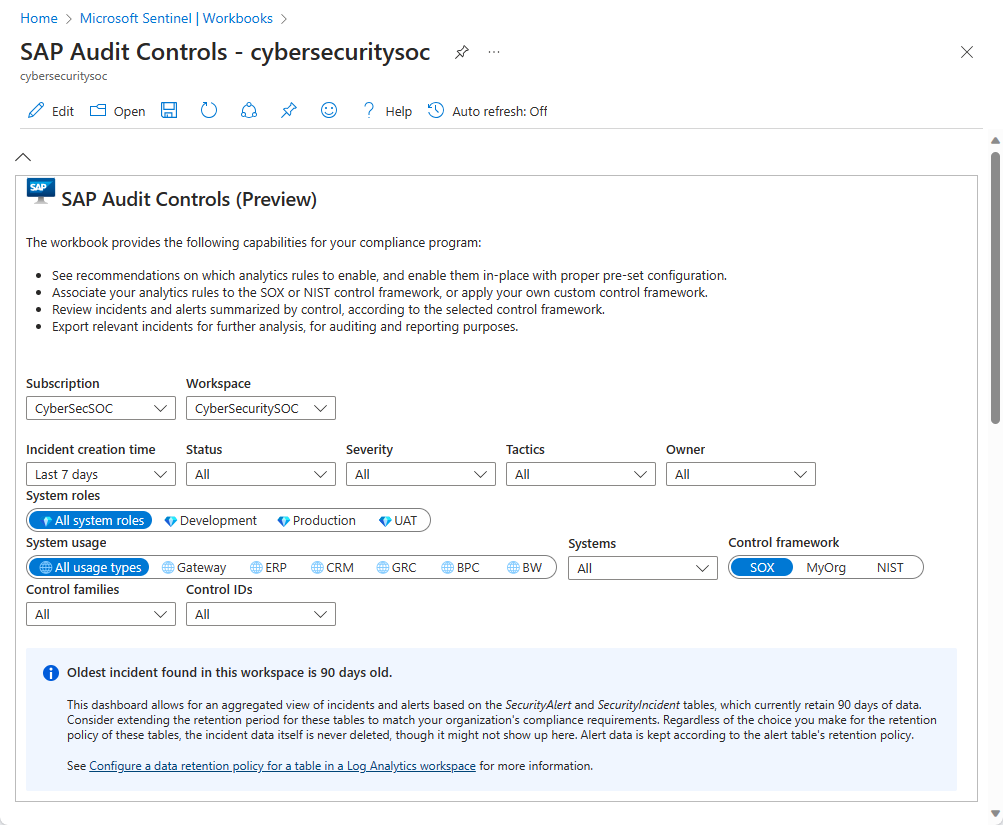
Select the following fields to filter the data according to your needs:
- Subscription and Workspace. Select the workspace whose SAP systems' compliance you wish to audit. This can be a different workspace than where Microsoft Sentinel is deployed.
- Incident creation time. Select a range from the last four hours to the last 30 days, or a custom range that you determine.
- Other incident attributes—Status, Severity, Tactics, Owner. For each of these, select from the available choices, which correspond to the values represented in the incidents in the selected time range.
- System roles. The SAP system roles, for example: Production.
- System usage. For example: SAP ERP.
- Systems. You can select all SAP system IDs, a specific system ID, or multiple system IDs.
- Control framework, Control families, Control IDs. Select these according to the control framework by which you want to evaluate your coverage, and the specific controls by which you want to filter the workbook data.
The dashboards in this workbook allow for an aggregated view of incidents and alerts based on the SecurityAlert and SecurityIncident tables, which by default retain 30 days of data. Consider extending the retention period for these tables to match your organization's compliance requirements. Regardless of the choice you make for the retention policy of these tables, the incident data itself is never deleted, though it might not show here. Alert data is kept according to the table's retention policy.
The actual retention policy of these two tables may well be defined as something other than the default 30 days. See the notice on the blue-shaded background in the workbook (shown in the screenshot above), showing the actual time range of data in the tables according to their current retention policy.
See Configure a data retention policy for a table in a Log Analytics workspace for more information.
Workbook overview
The workbook is separated into three tabs:
- Configure
- Monitor
- Report
Configure tab
Create analytics rules from yet-unused templates
The Templates ready to be used table shows the analytics rule templates, from the Microsoft Sentinel solution for SAP® applications, that have not yet been implemented as active rules. You may need to create these rules to achieve compliance.

The Solution templates to configure control shows the installed solutions whose analytics rules you can evaluate here for compliance with your chosen control framework. By default, only the SAP solution is selected, but you can select any or all others from this drop-down.
Select the View link in the Properties column of a particular rule template's line in the table to see the template's entire configuration in the pop-up Details pane. (This view is read-only.)
The Recommended configuration column shows the purpose of the rule: is it meant to create incidents for investigation? Or only to create alerts to be held aside and added to other incidents to be used as evidence in their investigations?
Select Activate rule (in the description pane) to create an analytics rule from the template, with the recommended configuration already built in. This functionality saves you the trouble of having to guess at the right configuration and define it manually.
View or change security control assignments of your analytics rules
In the Select a rule to configure table, you'll see the list of activated analytics rules relevant to SAP.

The counts and graph lines of Incidents and Alerts generated by each rule are displayed. (Identical counts suggest that alert grouping is disabled.)
Also shown are columns indicating that the rule's incident creation setting is enabled (the Incidents column), and what the source of the rule is (the Source column)—Gallery, Content hub, or Custom.
If the Recommended configuration for that rule is "As alert only," then you should consider disabling the incident creation setting in the rule (see below).
When you select a rule, a details panel appears with information about the rule.

The upper part of this side panel has recommendations regarding enabling or disabling incident creation in the analytics rule configuration, as mentioned above.
The next section shows which security controls and control families the rule is identified with, for each of the available frameworks. For the SOX and NIST frameworks, you can customize the control assignment by choosing a different control or control family from the relevant drop-downs. For custom frameworks, write in controls and control families of your choosing in the MyOrg text boxes. If you make any changes, select Save changes.
If a particular analytics rule hasn't been assigned a security control or control family for a given framework, a recommendation to set the controls will appear. After you select the controls, select Save changes.
- To see the rest of the details of the selected rule as currently defined, select Rule overview. This will open the same Details pane described earlier in this document.
Monitor tab
This tab contains several graphical representations of various groupings of the incidents in your environment that match the filters at the top of the workbook.
A trend line graph, labeled Incidents trend, shows the numbers of incidents over time. These incidents are grouped (represented by different colored lines and shadings) by default according to the control family represented by the rule that generated them. You can select alternate groupings for these incidents from the Detail incidents by drop-down.

The Incidents hive graph shows numbers of incidents grouped in two ways. The defaults (for the SOX framework) are first by SOX Control family (the "honeycomb" array of cells) and then by System ID (each cell in the "honeycomb"). You can select different criteria by which to display the groupings, using the Drill by and And then by selectors.
Zoom in to the hive graph to make the text big enough to read clearly, and zoom out to see all the groupings together. Drag the whole graph to see different parts of it.

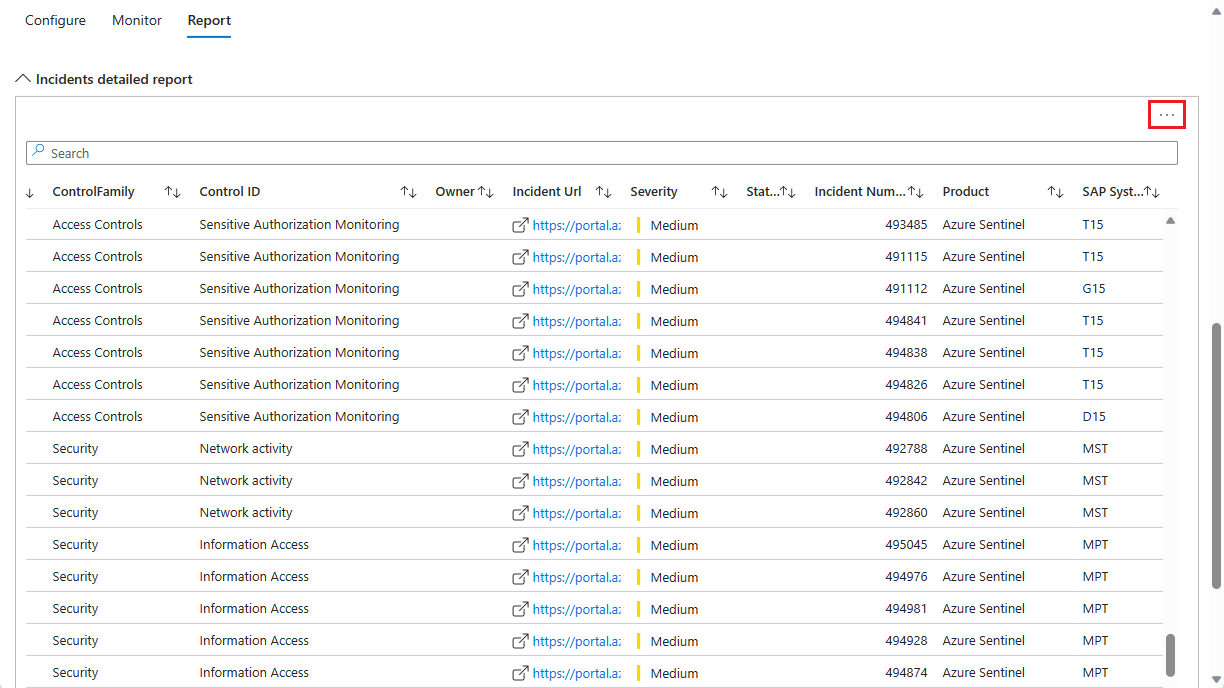
Report tab
Finally, the Report tab contains a list of all the incidents in your environment that match the filters at the top of the workbook.
The incidents are grouped by control family and control ID.
The link in the Incident URL column opens a new browser window open to the incident investigation page for that incident. This link is persistent, and will work regardless of the retention policy for the SecurityIncident table.
Scroll down to the end of the window (the outer scroll bar) to see the horizontal scroll bar, which you can use to see the rest of the columns in the report.
Export this report to a spreadsheet by selecting the ellipsis (the three dots) in the upper right-hand corner of the report, then selecting Export to Excel.


Next steps
For more information, see:
- Deploying Microsoft Sentinel solution for SAP® applications
- Microsoft Sentinel solution for SAP® applications logs reference
- Monitor the health of your SAP system
- Prerequisites for deploying the Microsoft Sentinel solution for SAP® applications
- Troubleshooting your Microsoft Sentinel solution for SAP® applications deployment
See this YouTube video, on the Microsoft Security Community YouTube channel, for a demonstration of this workbook.
Feedback
Coming soon: Throughout 2024 we will be phasing out GitHub Issues as the feedback mechanism for content and replacing it with a new feedback system. For more information see: https://aka.ms/ContentUserFeedback.
Submit and view feedback for