Note
Access to this page requires authorization. You can try signing in or changing directories.
Access to this page requires authorization. You can try changing directories.
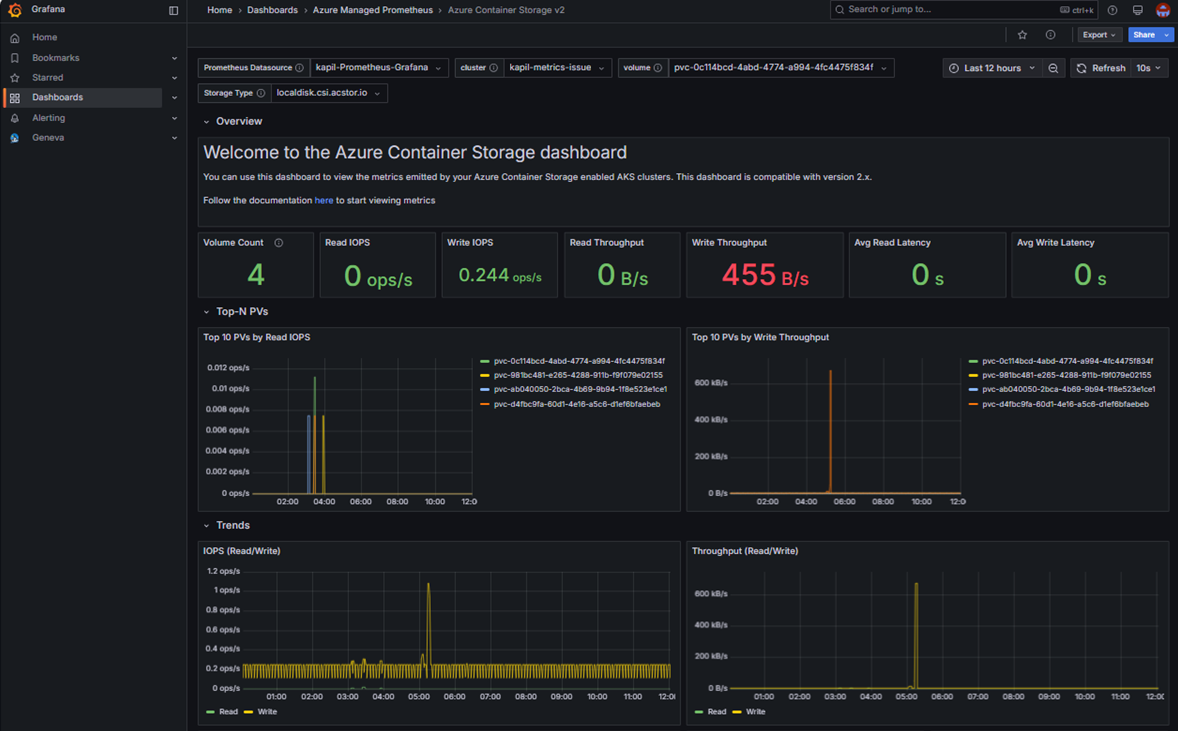
Azure Monitor dashboards with Grafana allow you to view and create Grafana dashboards directly in the Azure portal. This article describes how to use the default dashboard for Azure Container Storage for monitoring with Azure Monitor.
Prerequisites
The Azure Kubernetes Service (AKS) cluster that already has Azure Container Storage installed must be enabled for Azure Monitor. See Enable monitoring for AKS clusters.
To open the dashboards, you must have read access to the logs and Azure Monitor workspace holding the log and metric data. You can query analytics tier logs using the Kubernetes cluster as its scope, so direct access to the Log Analytics workspace isn't required. Basic logs only support workspace scoped queries, so access to the Log Analytics workspace is required.
Open Azure Container Storage dashboard
Azure Managed Grafana includes managed dashboards that are pre-provisioned and automatically updated to help you get started quickly with monitoring Azure Kubernetes Service and other Azure services. These dashboards are identified with an Azure-managed tag.
Follow these steps to use the default Azure Container Storage Grafana dashboard in the Azure portal.
Sign in to the Azure portal and navigate to your AKS Cluster.
Under Monitoring, select Dashboards with Grafana.
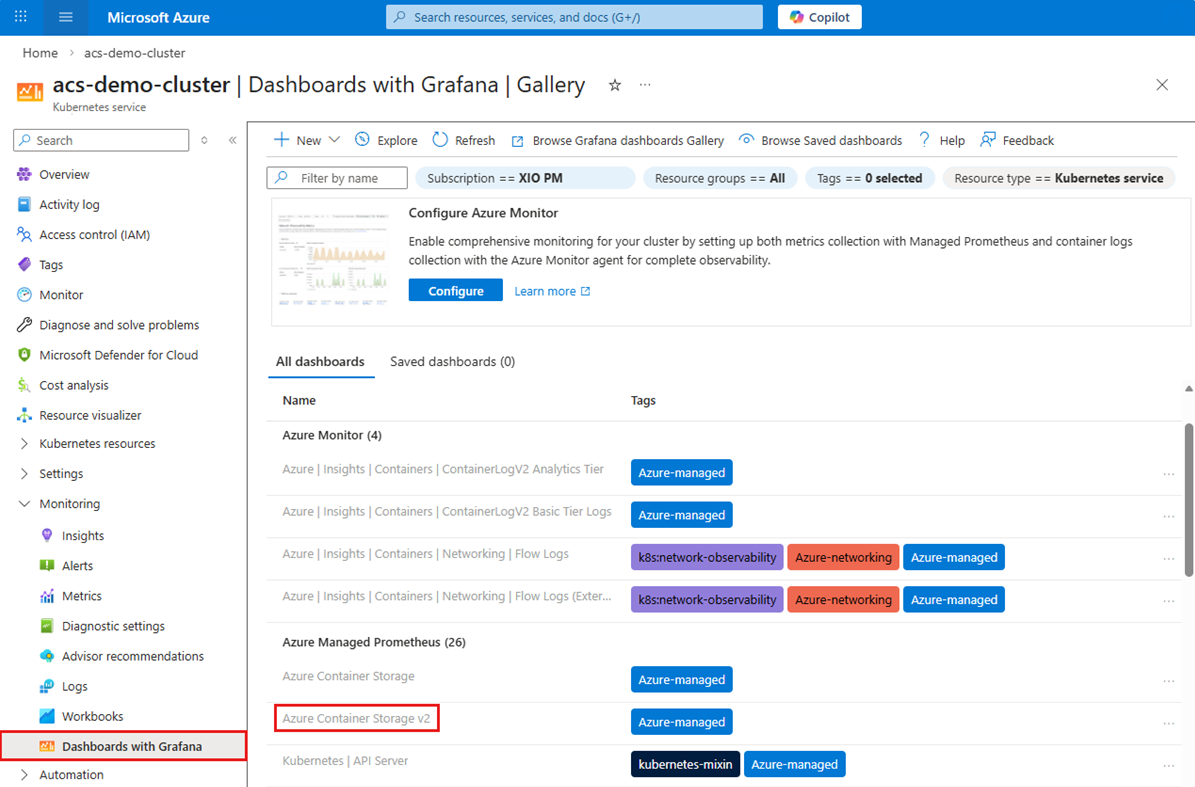
Browse the list of available dashboards and select Azure Container Storage v2 under Azure Managed Prometheus.
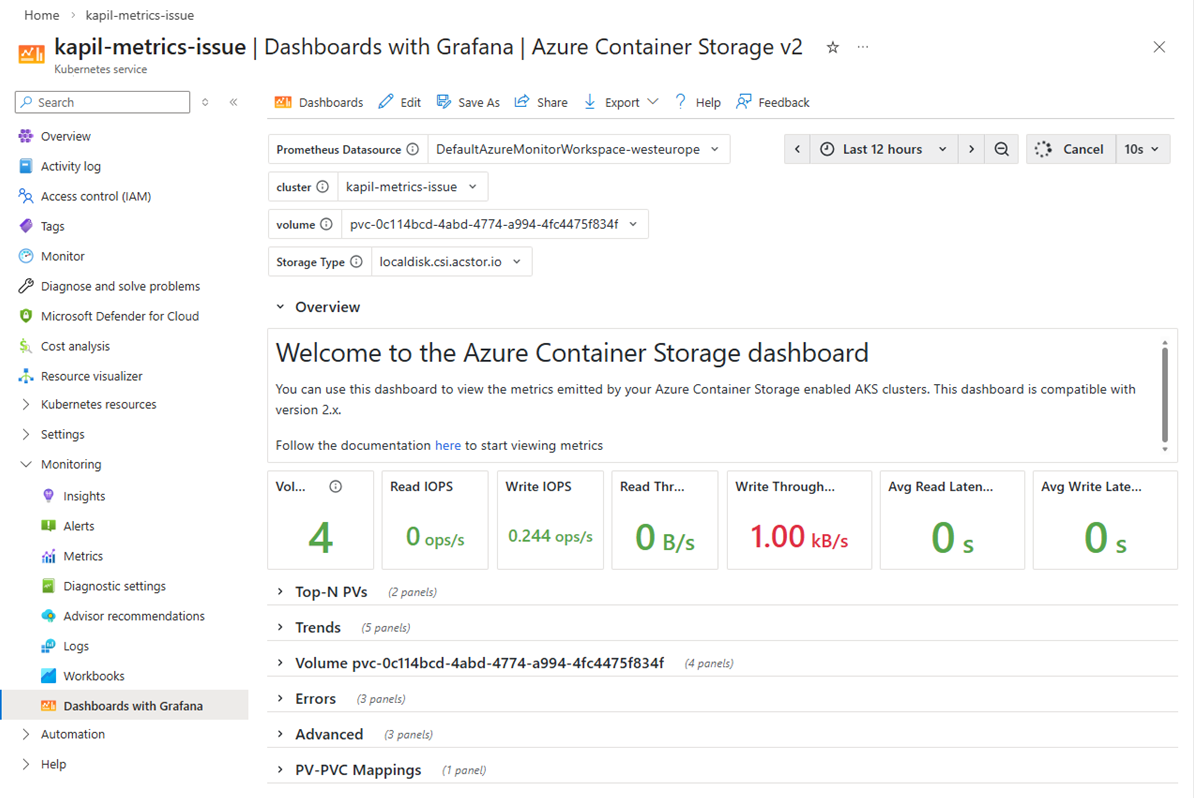
After you select the Azure Container Storage v2 dashboard, you should see the dashboard overview.
Open Azure Container Storage dashboard using linked Grafana instances
Follow these steps to open the Azure Container Storage dashboard using a linked Grafana instance.
Sign in to the Azure portal and navigate to your AKS cluster.
Under Monitoring, select Insights.
Select View Grafana.
Select the linked Grafana instance.
Click on the endpoint URL in the next window to browse the dashboards.
From the Azure Managed Grafana window, select the Azure Container Storage v2 dashboard.