Note
Access to this page requires authorization. You can try signing in or changing directories.
Access to this page requires authorization. You can try changing directories.
Applies to: ✔️ Linux VMs ✔️ Windows VMs
Benchmarking is the process of simulating different workloads and measuring the performance that a storage system can achieve under those conditions. By running benchmarking tools on virtual machines connected to Azure Elastic SAN, you can measure the IOPS (Input/Output Operations Per Second) and throughput achievable under different workload patterns.
In this article, you find examples of how to benchmark Azure Elastic SAN volumes from both Linux and Windows virtual machines by using common benchmarking tools like fio and DiskSpd. These tools enable you to simulate various workload characteristics, including I/O size, access pattern (sequential or random), and concurrency level. You can evaluate performance across different application scenarios.
Test environment
Use the following environment for benchmarking:
- Virtual machine: Standard E32bs v5
- Operating systems: Ubuntu 22.04 (Linux) and Windows Server
- Elastic SAN capacity: 20 TiB
- Volume sizes: 1,024 GiB
- Deployment: Windows and Linux VMs and Elastic SAN deployed in the same region and availability zone
Configure the VM and Elastic SAN setup by using the best practices outlined in the best practices article.
Setting up a test environment with Terraform
To help customers deploy an equivalent benchmarking environment, Microsoft published a Terraform setup kit that provisions the required Azure resources in their own Azure subscription, preconfigured according to Azure Elastic SAN best practices. The Terraform setup kit deploys an environment similar to the one used in this article, including a 20 TiB Elastic SAN, a 1,024 GiB volume, and a virtual machine configured with recommended performance settings such as Accelerated Networking, Multipath I/O (MPIO), 32 iSCSI sessions per volume, and optimized iSCSI client settings.
Deployment times can vary depending on subscription quotas, regional capacity availability, and other Azure subscription constraints.
Benchmark tooling
DISKSPD
DISKSPD is a native Windows benchmarking tool that you can use to evaluate storage performance on Windows virtual machines. Download the DISKSPD tool on the VM.
Baseline test parameters (DiskSpd)
- Block size (-b): Specifies the amount of data transferred in each I/O operation.
- Queue depth (-o): Defines the number of outstanding I/O requests issued per thread.
- Threads (-t): Controls the number of worker threads generating I/O operations.
- Access pattern (-r, -si, -w): Determines whether the workload is random or sequential, and the read/write mix.
- Test duration (-d): Specifies how long the test runs.
- Direct I/O (-Sh): Disables software and hardware caching to measure storage performance directly.
I/O intensive workload example
Windows (DiskSpd)
Run the following command on the VM:
diskspd.exe -c100G -b4K -r -o64 -t8 -w0 -d120 -Sh -L E:\esan_test.dat
Parameters:
- -b4K – 4 KB I/O size
- -r – Random I/O pattern
- -t8 – Eight threads
- -o64 – Queue depth of 64 per thread
- -w0 – 100% read workload
- -d120 – 120 second runtime
- -c100G – 100 GB test file
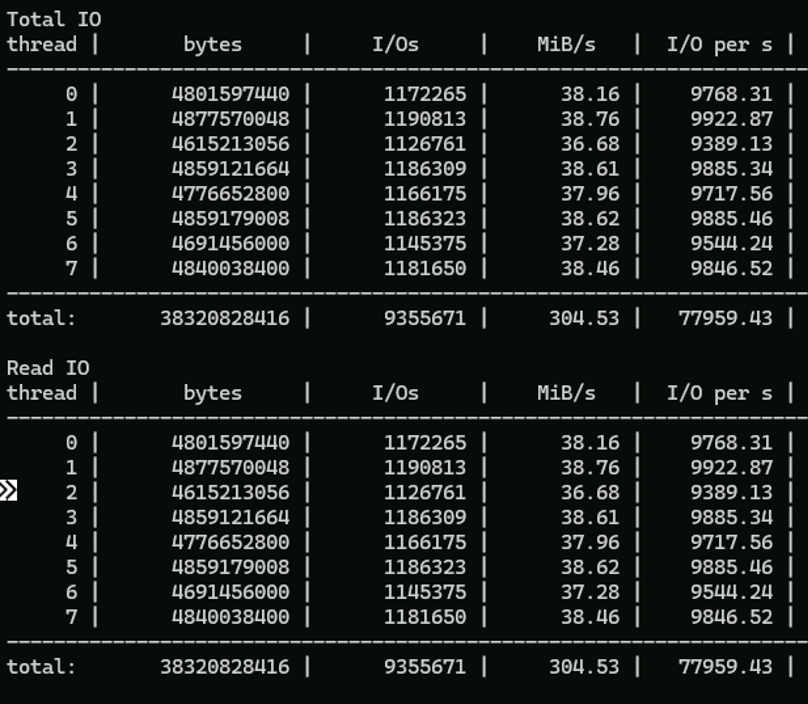
Results:
| I/O Pattern | I/O Size | Threads per VM | Queue Depth | IOPS Achieved | MBps Achieved |
|---|---|---|---|---|---|
| Random (Read 100%) | 4K | 8 | 512 | ~77,959 | ~304 MB/s |
This workload represents small-block, IOPS-intensive scenarios, such as transactional databases and metadata-heavy applications where low-latency, high-frequency operations are critical.
Throughput-intensive workload example
Windows (DiskSpd)
diskspd.exe -c100G -b1M -si -o32 -t4 -w0 -d120 -Sh -L E:\esan_test.dat
Parameters:
- -b1M → 1 MB I/O size
- -si → Sequential access pattern
- -t4 → Four threads
- -o32 → Queue depth per thread
- -w0 → 100% read workload
- -d120 → 120 second runtime
- -c100G → 100 GB test file
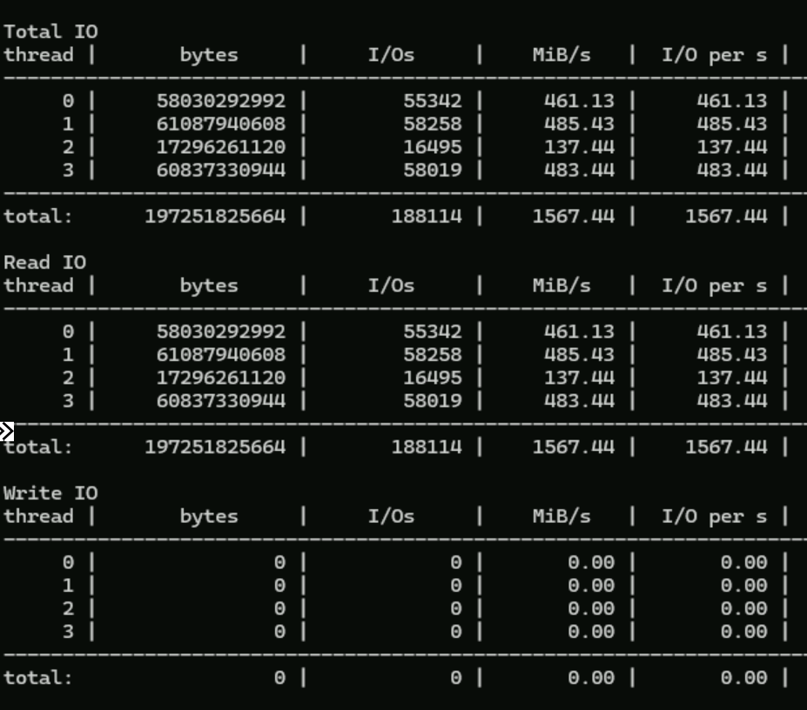
Results:
| I/O Pattern | I/O Size | Threads per VM | Queue Depth | IOPS Achieved | MBps Achieved |
|---|---|---|---|---|---|
| Sequential (Read 100%) | 1M | 4 | 128 | ~1567.44 | ~1,567.44 MB/s |
This workload represents throughput-oriented scenarios, such as large-scale data processing, backup, and file scanning workloads where bandwidth utilization is the primary requirement.
FIO
FIO is a commonly used tool for benchmarking storage on Linux virtual machines. It allows you to configure I/O size, access pattern, and concurrency to simulate different workload scenarios. It spawns worker threads or processes to perform the specified I/O operations. You can specify the type of I/O operations each worker thread must perform using job files. The following examples show one job file per scenario.
Before starting, download FIO and install it on your virtual machine.
Run the following command for Ubuntu:
apt-get update
apt-get install fio
Baseline test parameters (FIO)
- Block size (--bs): Defines the size of each I/O operation.
- Queue depth (--iodepth): Specifies the number of outstanding I/O operations per job.
- Threads (--numjobs): Controls the number of parallel worker jobs issuing I/O.
- Access pattern (--rw): Determines the type of I/O (random or sequential read/write).
- Test duration (--runtime, --time_based): Controls how long the test runs.
- File size (--size): Specifies the size of the test file used during benchmarking.
- Direct I/O (--direct): Bypasses OS caching to measure storage performance.
- Aggregated results (--group_reporting): Combines results from all jobs into a single summary.
I/O intensive workload example
fio --name=randread --rw=randread --bs=4k --iodepth=64 --numjobs=8 --size=100G --time_based --runtime=120 --direct=1 --ioengine=libaio --group_reporting --filename=/mnt/esan/testfile
Parameters:
- bs=4k — 4 KB I/O size
- rw=randread — Random read workload (100% read)
- numjobs=8 — Eight parallel threads
- iodepth=64 — Queue depth per thread
- runtime=120 — 2-minute test duration
- size=100G — Test file size
- direct=1 — Bypass OS cache
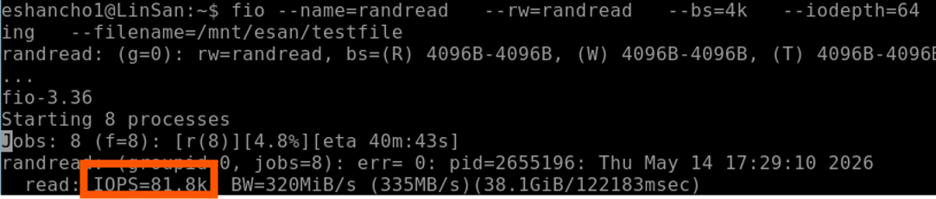
Results:
| I/O Pattern | I/O Size | Threads per VM | Queue Depth | IOPS Achieved | MBps Achieved |
|---|---|---|---|---|---|
| Random (Read 100%) | 4K | 8 | 512 | 81.8K | ~320 MB/s |
This workload models IOPS-driven application patterns, where high concurrency and small I/O sizes stress the storage system's ability to handle large numbers of operations per second.
Throughput-intensive workload example
Linux (fio)
fio --name=readseq --rw=read --bs=1M --iodepth=32 --numjobs=4 --size=100G --time_based --runtime=120 --direct=1 --ioengine=libaio --group_reporting --filename=/mnt/esan/testfile
Parameters:
- bs=1M — 1 MB I/O size
- rw=read — Sequential read workload
- numjobs=4 — Four parallel threads
- iodepth=32 — Queue depth per thread
- runtime=120 — 2-minute test duration
- size=100G — Test file size
- direct=1 — Bypass OS cache
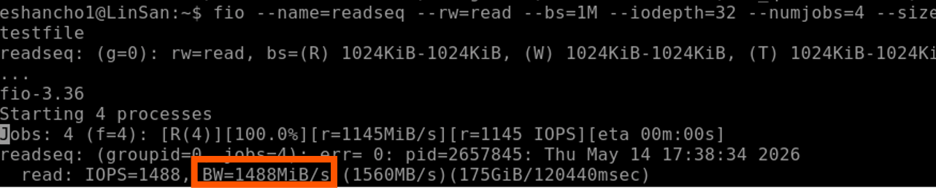
Results:
| I/O Pattern | I/O Size | Threads per VM | Queue Depth | IOPS Achieved | MBps Achieved |
|---|---|---|---|---|---|
| Sequential (Read 100%) | 1M | 4 | 128 | ~1,488 | ~1,488 MB/s |
Next steps
- Review Elastic SAN performance behavior and allocation: How performance works when VMs connect to Elastic SAN volumes
- Review configuration guidance and client optimizations: Optimize the performance of your Elastic SAN
- Review scale and performance targets: Scale targets for Elastic SAN
- Learn how to connect from Linux: Connect to an Azure Elastic SAN volume - Linux
- Learn about available Elastic SAN metrics (including E2E latency): Metrics for Azure Elastic SAN