Note
Access to this page requires authorization. You can try signing in or changing directories.
Access to this page requires authorization. You can try changing directories.
This article provides an overview of the Syntax Visualizer tool that ships as part of the .NET Compiler Platform ("Roslyn") SDK. The Syntax Visualizer is a tool window that helps you inspect and explore syntax trees. It's an essential tool to understand the models for code you want to analyze. It's also a debugging aid when you develop your own applications using the .NET Compiler Platform (“Roslyn”) SDK. Open this tool as you create your first analyzers. The visualizer helps you understand the models used by the APIs. You can also use tools like SharpLab or LINQPad to inspect code and understand syntax trees.
Installation instructions - Visual Studio Installer
There are two different ways to find the .NET Compiler Platform SDK in the Visual Studio Installer:
Install using the Visual Studio Installer - Workloads view
The .NET Compiler Platform SDK is not automatically selected as part of the Visual Studio extension development workload. You must select it as an optional component.
- Run Visual Studio Installer
- Select Modify
- Check the Visual Studio extension development workload.
- Open the Visual Studio extension development node in the summary tree.
- Check the box for .NET Compiler Platform SDK. You'll find it last under the optional components.
Optionally, you'll also want the DGML editor to display graphs in the visualizer:
- Open the Individual components node in the summary tree.
- Check the box for DGML editor
Install using the Visual Studio Installer - Individual components tab
- Run Visual Studio Installer
- Select Modify
- Select the Individual components tab
- Check the box for .NET Compiler Platform SDK. You'll find it at the top under the Compilers, build tools, and runtimes section.
Optionally, you'll also want the DGML editor to display graphs in the visualizer:
- Check the box for DGML editor. You'll find it under the Code tools section.
Familiarize yourself with the concepts used in the .NET Compiler Platform SDK by reading the overview article. It provides an introduction to syntax trees, nodes, tokens, and trivia.
Syntax Visualizer
The Syntax Visualizer enables inspection of the syntax tree for the C# or Visual Basic code file in the current active editor window inside the Visual Studio IDE. The visualizer can be launched by clicking on View > Other Windows > Syntax Visualizer. You can also use the Quick Launch toolbar in the upper right corner. Type "syntax", and the command to open the Syntax Visualizer should appear.
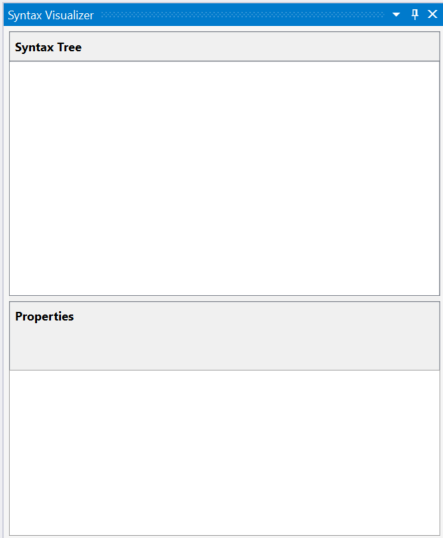
This command opens the Syntax Visualizer as a floating tool window. If you don't have a code editor window open, the display is blank, as shown in the following figure.
Dock this tool window at a convenient location inside Visual Studio, such as the left side. The Visualizer shows information about the current code file.
Create a new project using the File > New Project command. You can create either a Visual Basic or C# project. When Visual Studio opens the main code file for this project, the visualizer displays the syntax tree for it. You can open any existing C# / Visual Basic file in this Visual Studio instance, and the visualizer displays that file's syntax tree. If you have multiple code files open inside Visual Studio, the visualizer displays the syntax tree for the currently active code file, (the code file that has keyboard focus.)
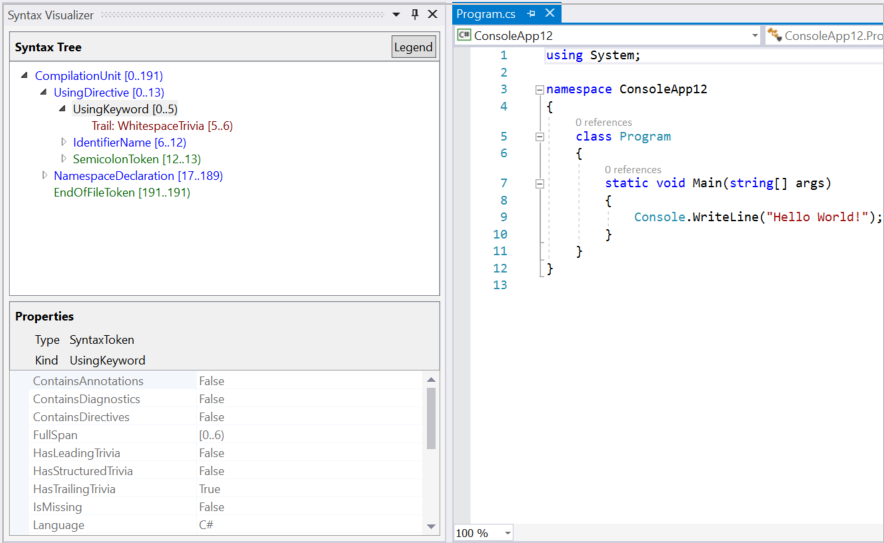
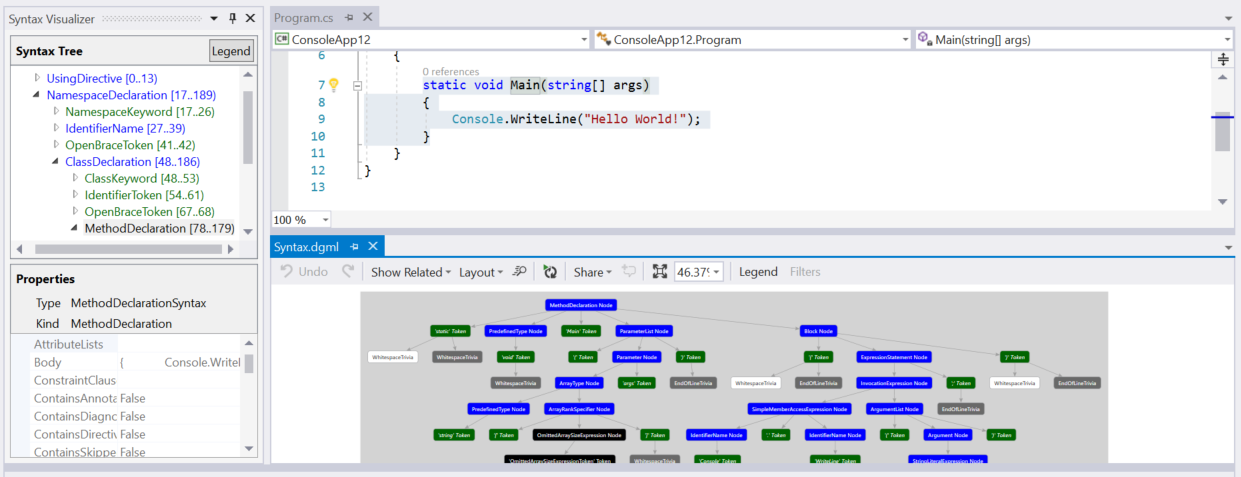
As shown in the preceding images, the visualizer tool window displays the syntax tree at the top and a property grid at the bottom. The property grid displays the properties of the item that is currently selected in the tree, including the .NET Type and the Kind (SyntaxKind) of the item.
Syntax trees comprise three types of items – nodes, tokens, and trivia. You can read more about these types in the Work with syntax article. Items of each type are represented using a different color. Click on the ‘Legend’ button for an overview of the colors used.
Each item in the tree also displays its own span. The span is the indices (the starting and ending position) of that node in the text file. In the preceding C# example, the selected “UsingKeyword [0..5)” token has a Span that is five characters wide, [0..5). The "[..)" notation means that the starting index is part of the span, but the ending index is not.
There are two ways to navigate the tree:
- Expand or click on items in the tree. The visualizer automatically selects the text corresponding to this item’s span in the code editor.
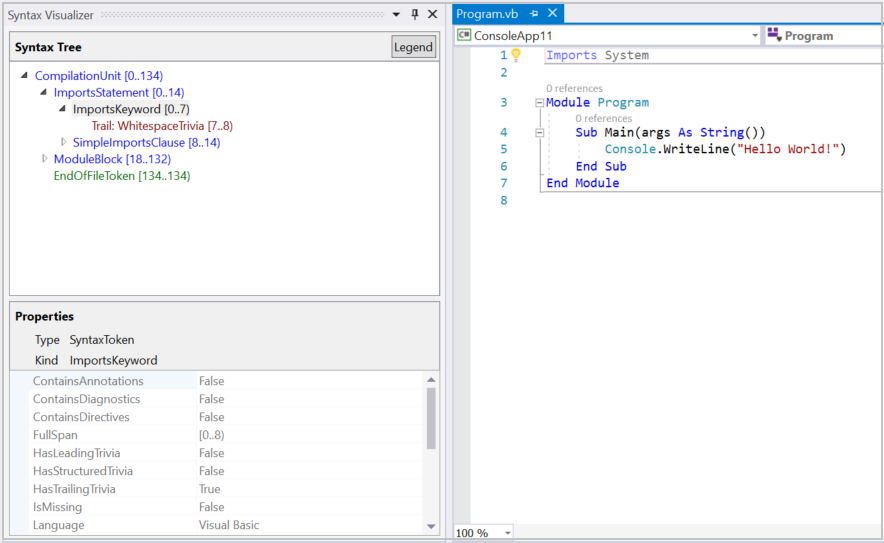
- Click or select text in the code editor. In the preceding Visual Basic example, if you select the line containing "Module Module1" in the code editor, the visualizer automatically navigates to the corresponding ModuleStatement node in the tree.
The visualizer highlights the item in the tree whose span best matches the span of the text selected in the editor.
The visualizer refreshes the tree to match modifications in the active code file. Add a call to Console.WriteLine() inside Main(). As you type, the visualizer refreshes the tree.
Pause typing once you have typed Console.. The tree has some items colored in pink. At this point, there are errors (also referred to as ‘Diagnostics’) in the typed code. These errors are attached to nodes, tokens, and trivia in the syntax tree. The visualizer shows you which items have errors attached to them highlighting the background in pink. You can inspect the errors on any item colored pink by hovering over the item. The visualizer only displays syntactic errors (those errors related to the syntax of the typed code); it doesn't display any semantic errors.
Syntax Graphs
Right click on any item in the tree and click on View Directed Syntax Graph.
The visualizer displays a graphical representation of the subtree rooted at the selected item. Try these steps for the MethodDeclaration node corresponding to the Main() method in the C# example. The visualizer displays a syntax graph that looks as follows:
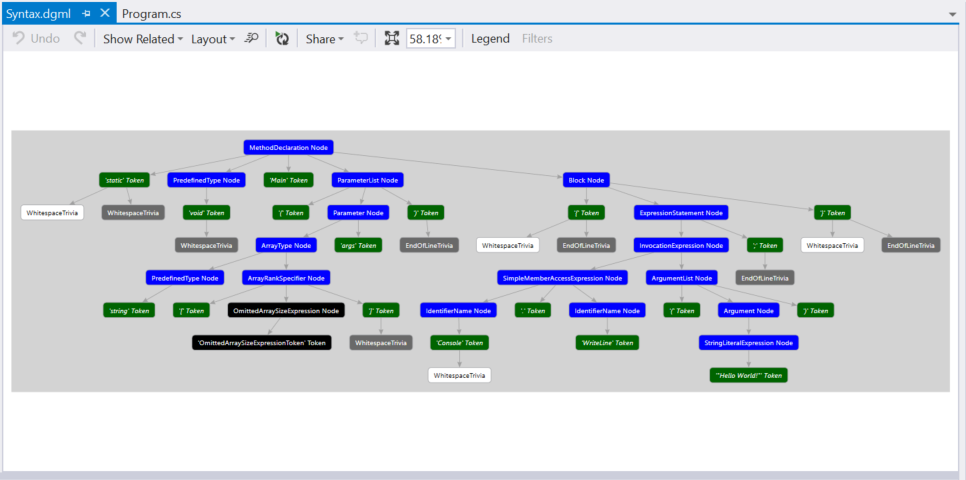
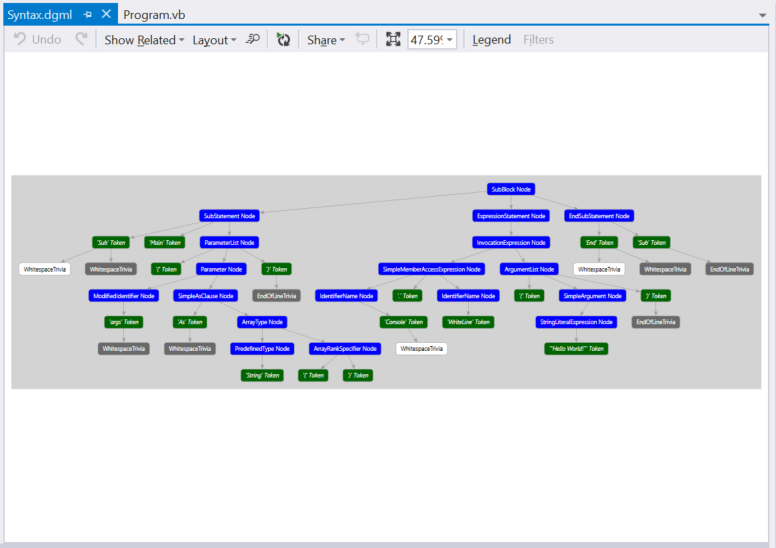
The syntax graph viewer has an option to display a legend for its coloring scheme. You can also hover over individual items in the syntax graph with the mouse to view the properties corresponding to that item.
You can view syntax graphs for different items in the tree repeatedly and the graphs will always be displayed in the same window inside Visual Studio. You can dock this window at a convenient location inside Visual Studio so that you don’t have to switch between tabs to view a new syntax graph. The bottom, below code editor windows, is often convenient.
Here is the docking layout to use with the visualizer tool window and the syntax graph window:
Another option is to put the syntax graph window on a second monitor, in a dual monitor setup.
Inspecting semantics
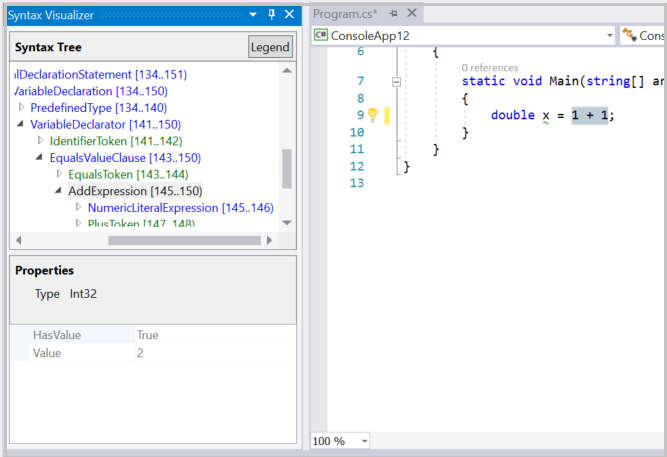
The Syntax Visualizer enables rudimentary inspection of symbols and semantic information. Type double x = 1 + 1; inside Main() in the C# example. Then, select the expression 1 + 1 in the code editor window. The visualizer highlights the AddExpression node in the visualizer. Right click on this AddExpression and click on View Symbol (if any). Notice that most of the menu items have the "if any" qualifier. The Syntax Visualizer inspects properties of a Node, including properties that may not be present for all nodes.
The property grid in the visualizer updates as shown in the following figure: The symbol for the expression is a SynthesizedIntrinsicOperatorSymbol with Kind = Method.

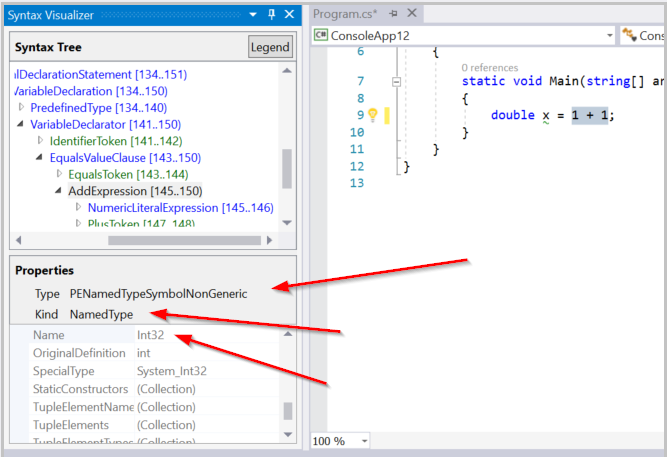
Right-click the same AddExpression node and select View TypeSymbol (if any). The property grid in the visualizer updates as shown in the following figure, indicating that the type of the selected expression is Int32.
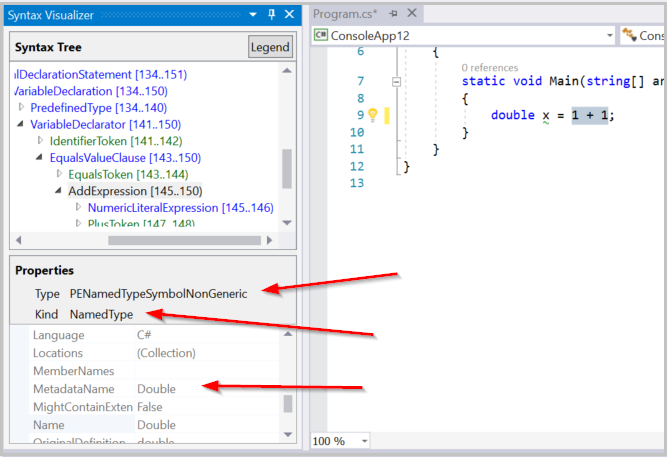
Right-click the same AddExpression node and select View Converted TypeSymbol (if any). The property grid updates indicating that although the type of the expression is Int32, the converted type of the expression is Double as shown in the following figure. This node includes converted type symbol information because the Int32 expression occurs in a context where it must be converted to a Double. This conversion satisfies the Double type specified for the variable x on the left-hand side of the assignment operator.
Finally, right-click the same AddExpression node and select View Constant Value (if any). The property grid shows that the value of the expression is a compile time constant with value 2.
The preceding example can also be replicated in Visual Basic. Type Dim x As Double = 1 + 1 in a Visual Basic file. Select the expression 1 + 1 in the code editor window. The visualizer highlights the corresponding AddExpression node in the visualizer. Repeat the preceding steps for this AddExpression and you should see identical results.
Examine more code in Visual Basic. Update your main Visual Basic file with the following code:
Imports C = System.Console

Module Program
    Sub Main(args As String())
        C.WriteLine()
    End Sub
End Module
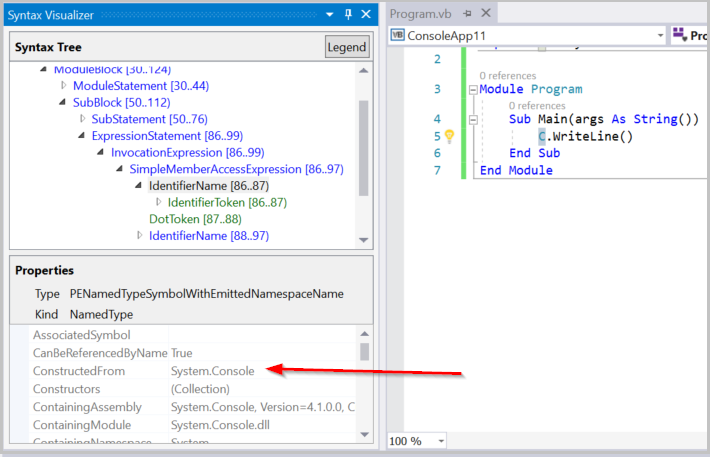
This code introduces an alias named C that maps to the type System.Console at the top of the file and uses this alias inside Main(). Select the use of this alias, the C in C.WriteLine(), inside the Main() method. The visualizer selects the corresponding IdentifierName node in the visualizer. Right-click this node and click on View Symbol (if any). The property grid indicates that this identifier is bound to the type System.Console as shown in the following figure:
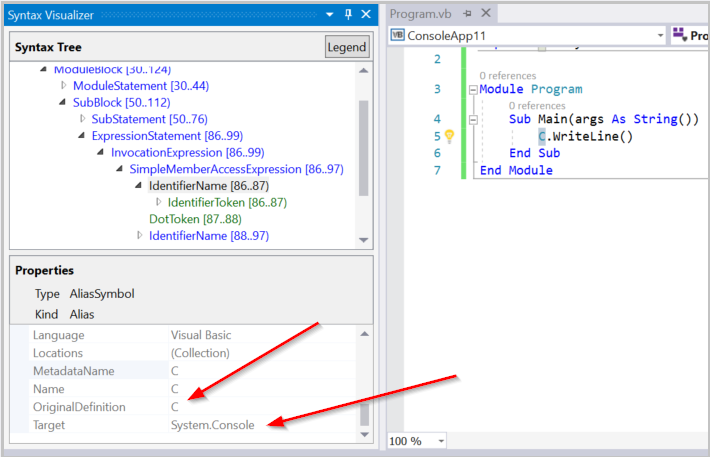
Right-click the same IdentifierName node and select View AliasSymbol (if any). The property grid indicates the identifier is an alias with name C that is bound to the System.Console target. In other words, the property grid provides information regarding the AliasSymbol corresponding to the identifier C.
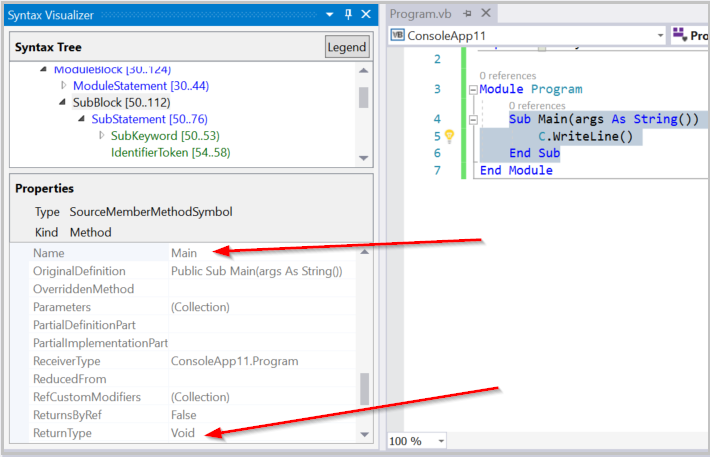
Inspect the symbol corresponding to any declared type, method, property. Select the corresponding node in the visualizer and right-click to access View Symbol (if any). Select the method Sub Main(), including the body of the method. Right-click the corresponding SubBlock node in the visualizer and select View Symbol (if any). The property grid shows the MethodSymbol for this SubBlock has name Main with return type Void.
The above Visual Basic examples can be easily replicated in C#. Type using C = System.Console; in place of Imports C = System.Console for the alias. The preceding steps in C# yield identical results in the visualizer window.
Semantic inspection operations are only available on nodes. They are not available on tokens or trivia. Not all nodes have interesting semantic information to inspect. When a node doesn't have interesting semantic information, right-clicking and selecting View * Symbol (if any) shows a blank property grid.
You can read more about APIs for performing semantic analysis in the Work with semantics overview document.
Closing the syntax visualizer
You can close the visualizer window when you are not using it to examine source code. The syntax visualizer updates its display as you navigate through code, editing and changing the source. It can get distracting when you are not using it.
Collaborate with us on GitHub
The source for this content can be found on GitHub, where you can also create and review issues and pull requests. For more information, see our contributor guide.