View copilot analytics report
Copilot in Dynamics 365 Customer Service helps agents to complete tasks related to conversations, cases, and email more easily. With the Copilot analytics dashboard, supervisors and customer service managers can identify the impact that Copilot has across their customer service operations.
The system stores the copilot interaction data in the msdyn_copilotinteraction, msdyn_copilotinteractiondata, msdyn_copilottranscript, and msdyn_copilottranscriptdata tables. You can use the information to build custom metrics in reporting and analytics and understand how Copilot is being used in your organization.
To view the Copilot report, select Copilot analytics in the Customer Service workspace app.
Copilot report
You can use filters to focus on the information that's important to you:
- Duration: Filters the data by the selected value of day, week, or month.
- Time zone: Filters the data for the selected time zone.
The Copilot report displays the following metrics.
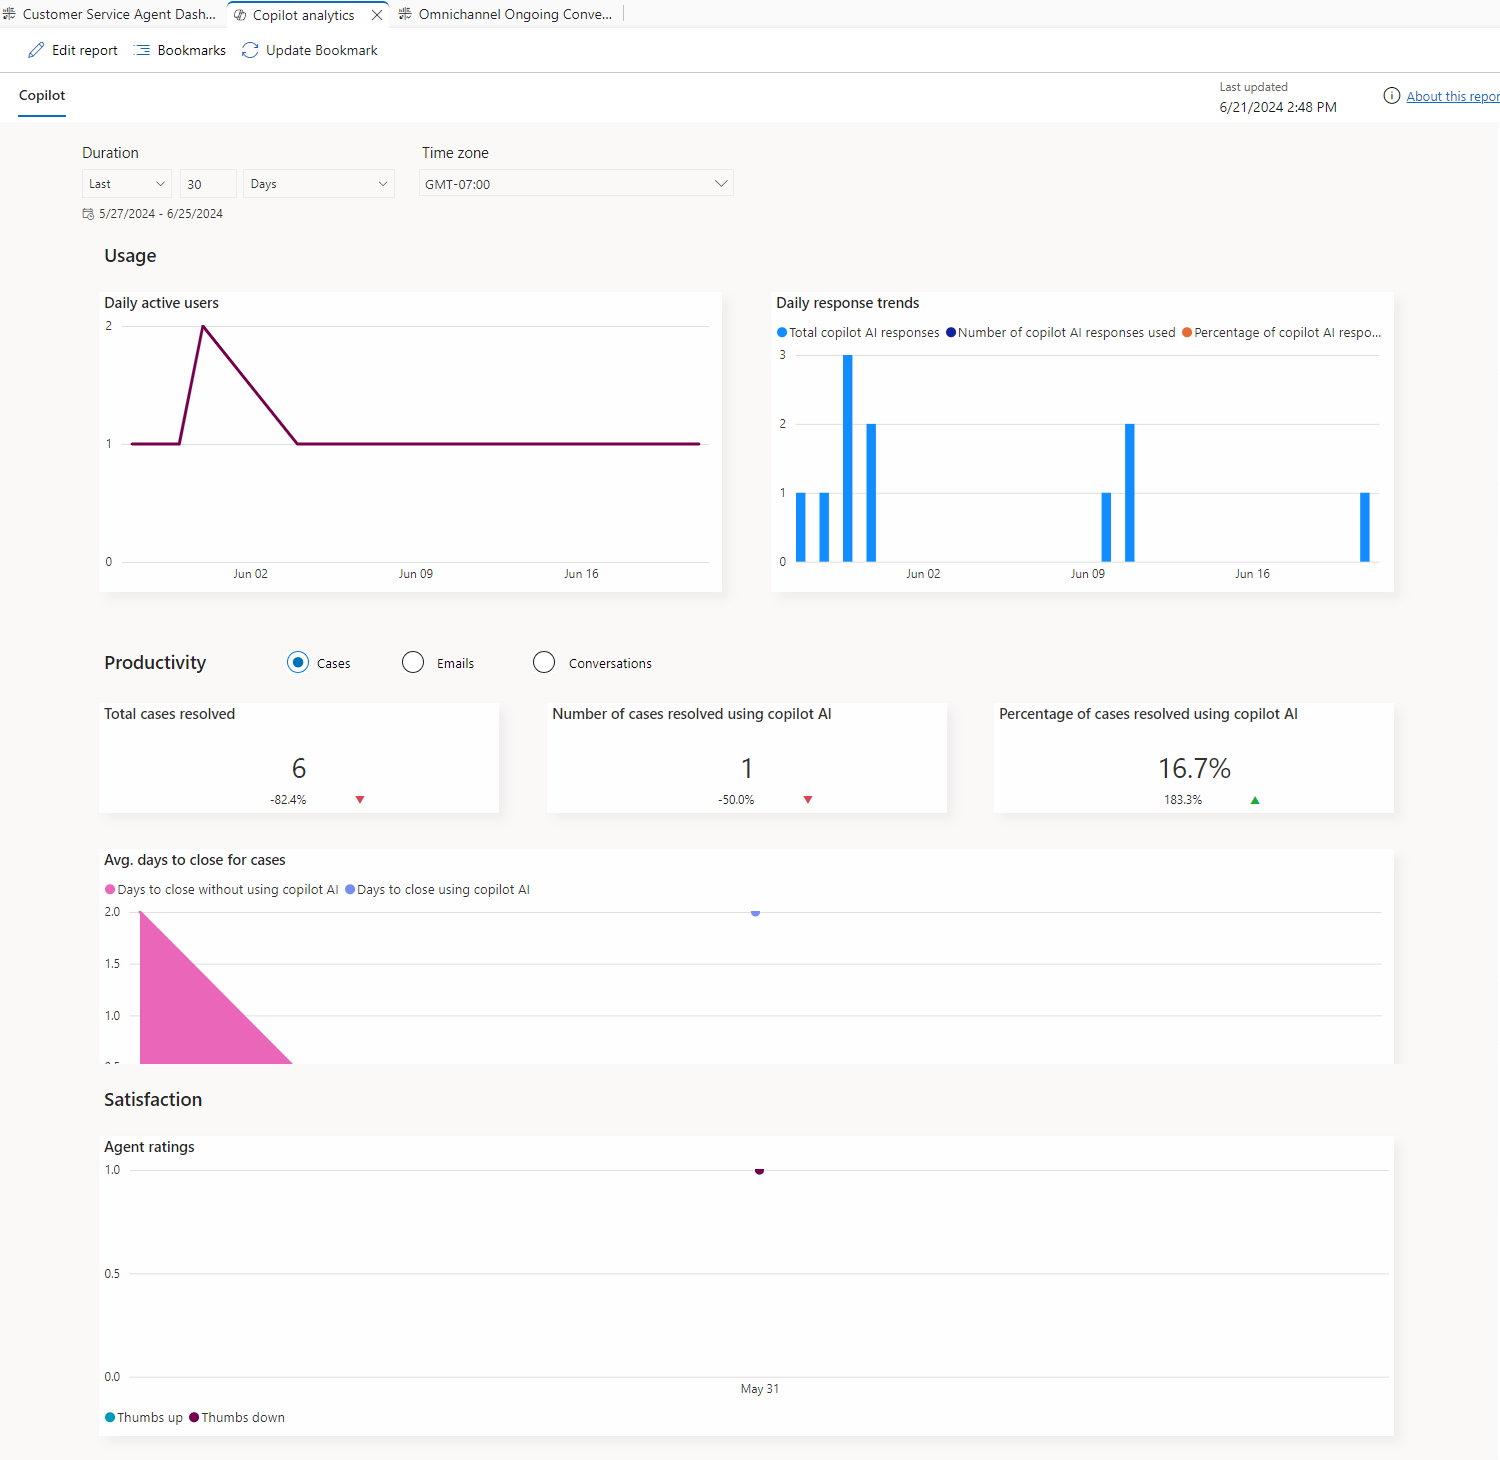
Usage
| Metric | Description |
|---|---|
| Daily active users | The number of unique agents who used Copilot at least once in the last day. |
| Total copilot AI responses | The total number of responses that Copilot provided. |
| Number of copilot AI responses used | The number of times that text from a Copilot response was copied. |
| Percentage of copilot AI responses used | The percentage of responses that were used. |
Productivity: Cases
| Metric | Description |
|---|---|
| Total cases resolved | The number of cases that were resolved when Copilot was used. |
| Number of cases resolved using copilot AI | The number of cases that were resolved when Copilot was used. |
| Percentage of cases resolved using copilot AI | The percentage of cases that were resolved when Copilot was used |
| Avg. days to close for cases | The average time that elapsed after the case was created and until it was resolved. Displays data when Copilot was used and when it wasn't. This metric is also known as case resolution time. |
| Case throughput | The number of cases that were resolved on an average per day; displays data when Copilot was used and when it wasn't. |
Productivity: Emails
| Metric | Description |
|---|---|
| Total emails | The number of emails that were drafted when Copilot was used. |
| Number of emails using copilot AI | The number of emails that were sent with content drafted using Copilot. |
| Percentage of emails using copilot AI | The percentage of emails that were sent when Copilot was used |
| Avg. email response time (min) | Average email response time when Copilot is engaged; displays data when Copilot was used and when it wasn't. |
| Email throughput | The number of emails that were sent on an average per day; displays data when Copilot was used and when it wasn't. |
Productivity: Conversations
| Metric | Description |
|---|---|
| Total conversations with copilot AI available | The total number of conversations in which the agent engaged with the customer at least once using Copilot; doesn't include email and voice. |
| Number of conversations using copilot AI | The number of engaged conversations that used Copilot; lists only closed conversations. |
| Percentage of conversations using copilot AI | The percentage of engaged conversations that have used Copilot. |
| Avg conversation handle time (min) | The average time that elapsed after a conversation started until it ended; displays data when Copilot was used and when it wasn't. |
| Conversation throughput | The number of conversations, excluding email and voice, completed on an average per day; displays data when Copilot was used and when it wasn't. |
Satisfaction
| Metric | Description |
|---|---|
| Agent ratings | The number of times agents rated a Copilot response positively or negatively by providing a thumbs-up or thumbs-down. |
Next Steps
You can view the transcripts of interactions between agents and Copilot.
See also
Use copilot features
Configure copilot
Enable historical analytics for Copilot
Feedback
Coming soon: Throughout 2024 we will be phasing out GitHub Issues as the feedback mechanism for content and replacing it with a new feedback system. For more information see: https://aka.ms/ContentUserFeedback.
Submit and view feedback for