Apache Spark application detail monitoring
With Microsoft Fabric, you can use Apache Spark to run notebooks, jobs, and other kinds of applications in your workspace. This article explains how to monitor your Apache Spark application, allowing you to keep an eye on the recent run status, issues, and progress of your jobs.
View Apache Spark applications
You can view all Apache Spark applications from Spark job definition, or notebook item context menu shows the recent run option -> Recent runs.

You can select the name of the application you want to view in the application list, in the application details page you can view the application details.
Monitor Apache Spark application status
Open the Recent runs page of the notebook or Spark job definition, you can view the status of the Apache application.
- Success

- Queued

- Stopped

- Canceled

- Failed

Jobs
Open an Apache Spark application job from the Spark job definition or notebook item context menu shows the Recent run option -> Recent runs -> select a job in recent runs page.
In the Apache Spark application monitoring details page, the job runs list is displayed in the Jobs tab, you can view the details of each job here, including Job ID, Description, Status, Stages, Tasks, Duration, Processed, Data read, Data written and Code snippet.
- Clicking on Job ID can expand/collapse the job.
- Click on the job description, you can jump to job or stage page in spark UI.
- Click on the job Code snippet, you can check and copy the code related to this job.

Resources (Preview)
The executor usage graph visually displays the allocation of Spark job executors and resource usage. Currently, only the runtime information of spark 3.4 and above will display this feature. Select Resources (Preview), then four types curves about executor usage are drafted, including Running, Idled, Allocated, Maximum instances.

For Allocated, refers to the core situation that is allocated during the running of Spark application.
For Maximum instances, refers to the maximum number of cores allocated to the Spark application.
For Running, refers to the actual number of cores used by the Spark application when it is running. Click at a point in time while the spark application is running. You can see the running executor core allocation details at the bottom of the graph.
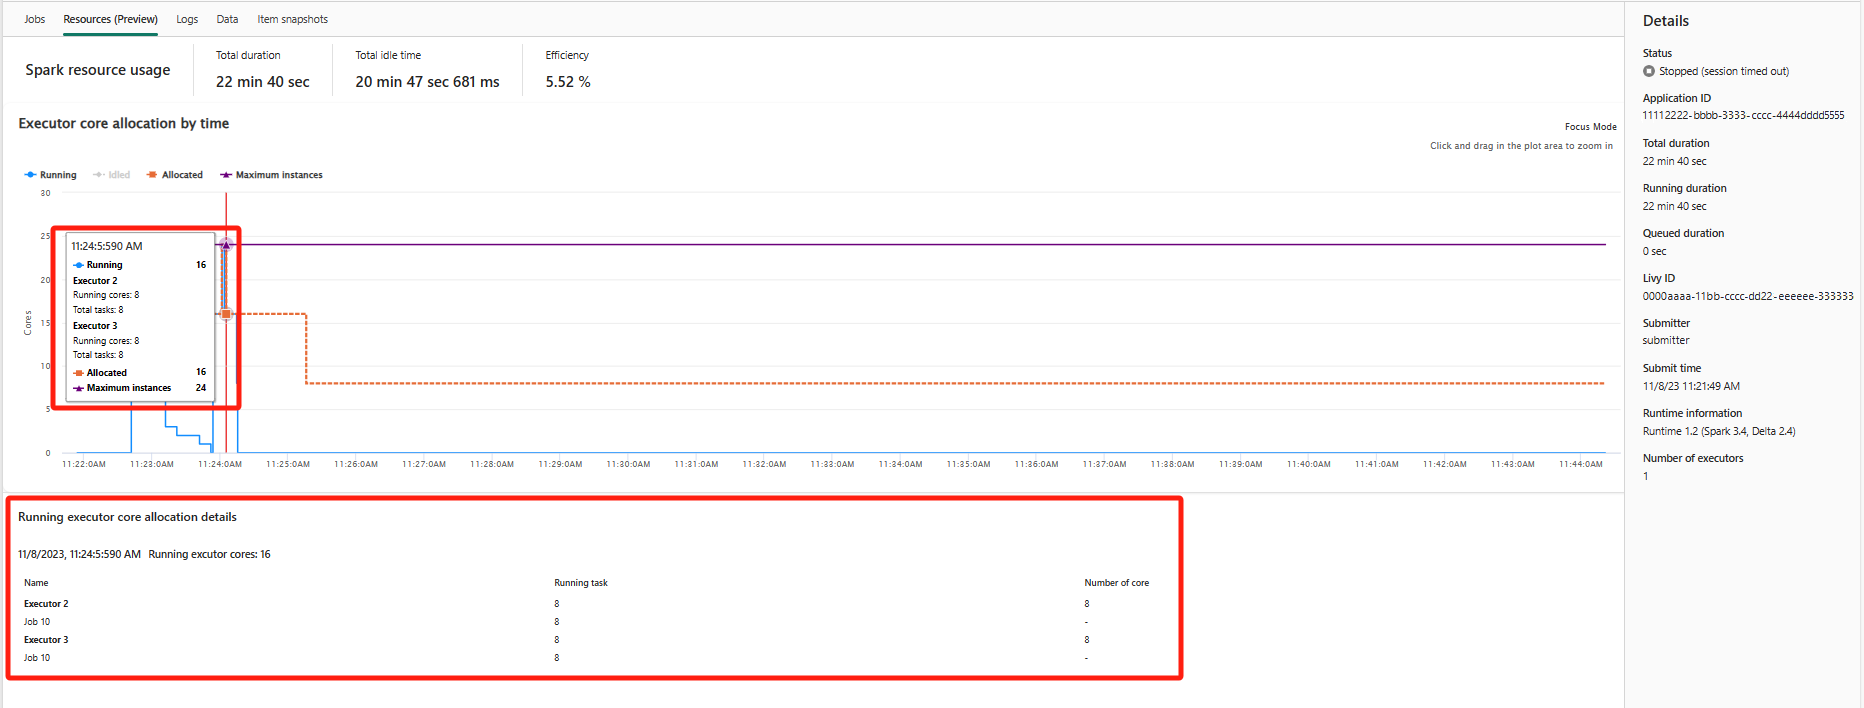
For Idled, it is the number of unused cores while the Spark application is running.

In some cases, at some time points the number of tasks might exceed the capacity of the executor cores (i.e., task numbers > total executor cores / spark.task.cpus). This is as expected, because there's time gap between a task marked as running and it is actually running on an executor core. So some tasks might be shown as running, but it does not run on any core.
Select the color icon to select or unselect the corresponding content in all graph.

Summary panel
In the Apache Spark application monitoring page, click the Properties button to open/collapse the summary panel. You can view the details for this application in Details.
- Status for this spark application.
- This Spark application's ID.
- Total duration.
- Running duration for this spark application.
- Queued duration for this spark application.
- Livy ID
- Submitter for this spark application.
- Submit time for this spark application.
- Number of executors.

Logs
For the Logs tab, you can view the full log of Livy, Prelaunch, Driver log with different options selected in the left panel. And you can directly retrieve the required log information by searching keywords and view the logs by filtering the log status. Click Download Log to download the log information to the local.
Sometimes no logs are available, such as the status of the job is queued and cluster creation failed.
Live logs are only available when app submission fails, and driver logs are also provided.

Data
For the Data tab, you can copy the data list on clipboard, download the data list and single data, and check the properties for each data.
- The left panel can be expanded or collapse.
- The name, read format, size, source and path of the input and output files will be displayed in this list.
- The files in input and output can be downloaded, copy path and view properties.

Related items
The Related items tab allows you to browse and view items associated with the Apache Spark application, including Notebooks, Spark job definition, and/or Pipelines. The related items page displays the snapshot of the code and parameter values at the time of execution for Notebooks. It also shows the snapshot of all settings and parameters at the time of submission for Spark job definitions. If the Apache Spark application is associated with a pipeline, the related item page also presents the corresponding pipeline and the Spark activity.
In the Related Items screen, you can:
- Browse and navigate the related items in the hierarchical tree.
- Click the 'A list of more actions' ellipse icon for each item to take different actions.
- Click the snapshot item to view its content.
- View the Breadcrumb to see the path from the selected item to the root.

Diagnostics
The diagnostic panel provides users with real-time recommendations and error analysis, which are generated by the Spark Advisor through an analysis of the user's code. With built-in patterns, the Apache Spark Advisor helps users avoid common mistakes and analyzes failures to identify their root cause.

Related content
The next step after viewing the details of an Apache Spark application is to view Spark job progress below the Notebook cell. You can refer to: