Note
Access to this page requires authorization. You can try signing in or changing directories.
Access to this page requires authorization. You can try changing directories.
This article walks through adding KQL data from Kusto tables, functions, and materialized views to Fabric Maps and configuring the resulting layer for visualization. For more information on Kusto integration, see Kusto integration in Fabric Maps.
Important
Embedded KQL querysets are deprecated for use in Fabric Maps. You can no longer create new map layers using KQL querysets or use Application Lifecycle Management (ALM) to import or export the queryset associated with a map layer, which is now no longer supported.
Existing map layers created from KQL querysets will continue to function until June 29, 2026.
To ensure continued support, migrate your existing layers to Kusto functions, which also work with ALM. For more information, see Migrate KQL Queryset to Kusto function.
Prerequisites
Before you begin, ensure that:
- You have access to a KQL database in Microsoft Fabric.
- The target table, function, or materialized view returns geometry columns.
- You have permission to create and edit maps in Fabric.
Limitations
The following limitations apply when creating layers from Kusto data in Fabric Maps:
- Kusto result dataset: Supports up to 100,000 features returned by the query.
Create a data layer from a KQL database
Open your map in Edit mode.
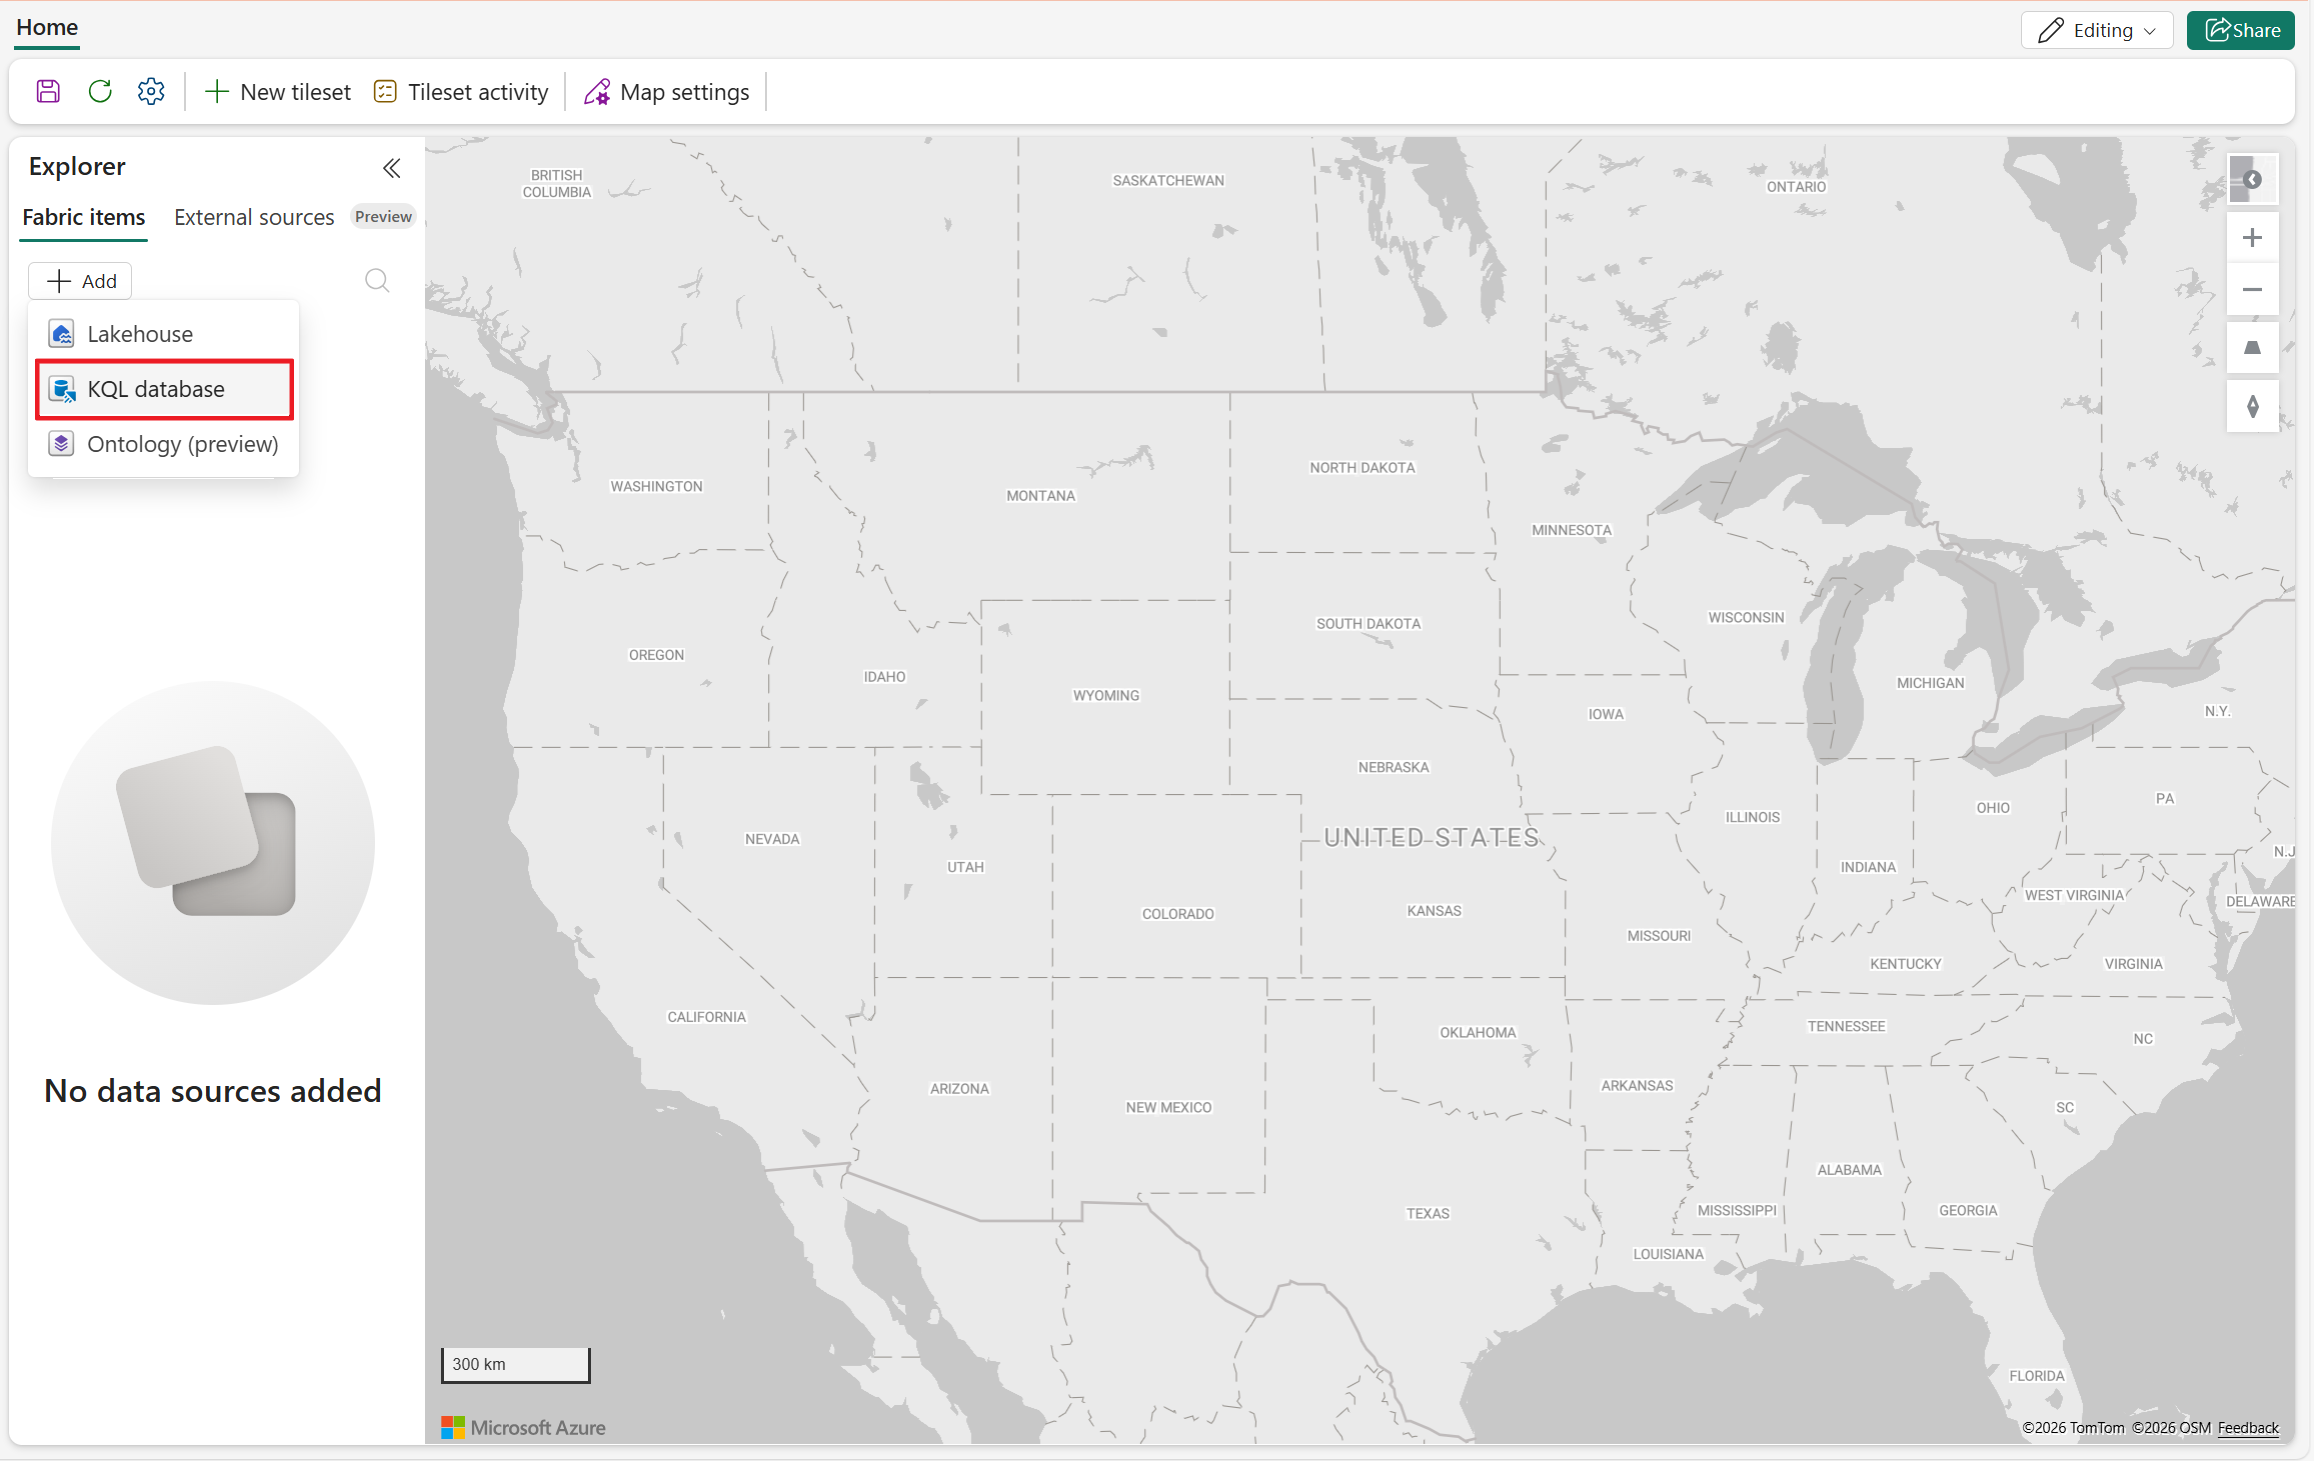
In the Explorer, select the Fabric items tab
Select the Add button, then select KQL database from the drop-down list.
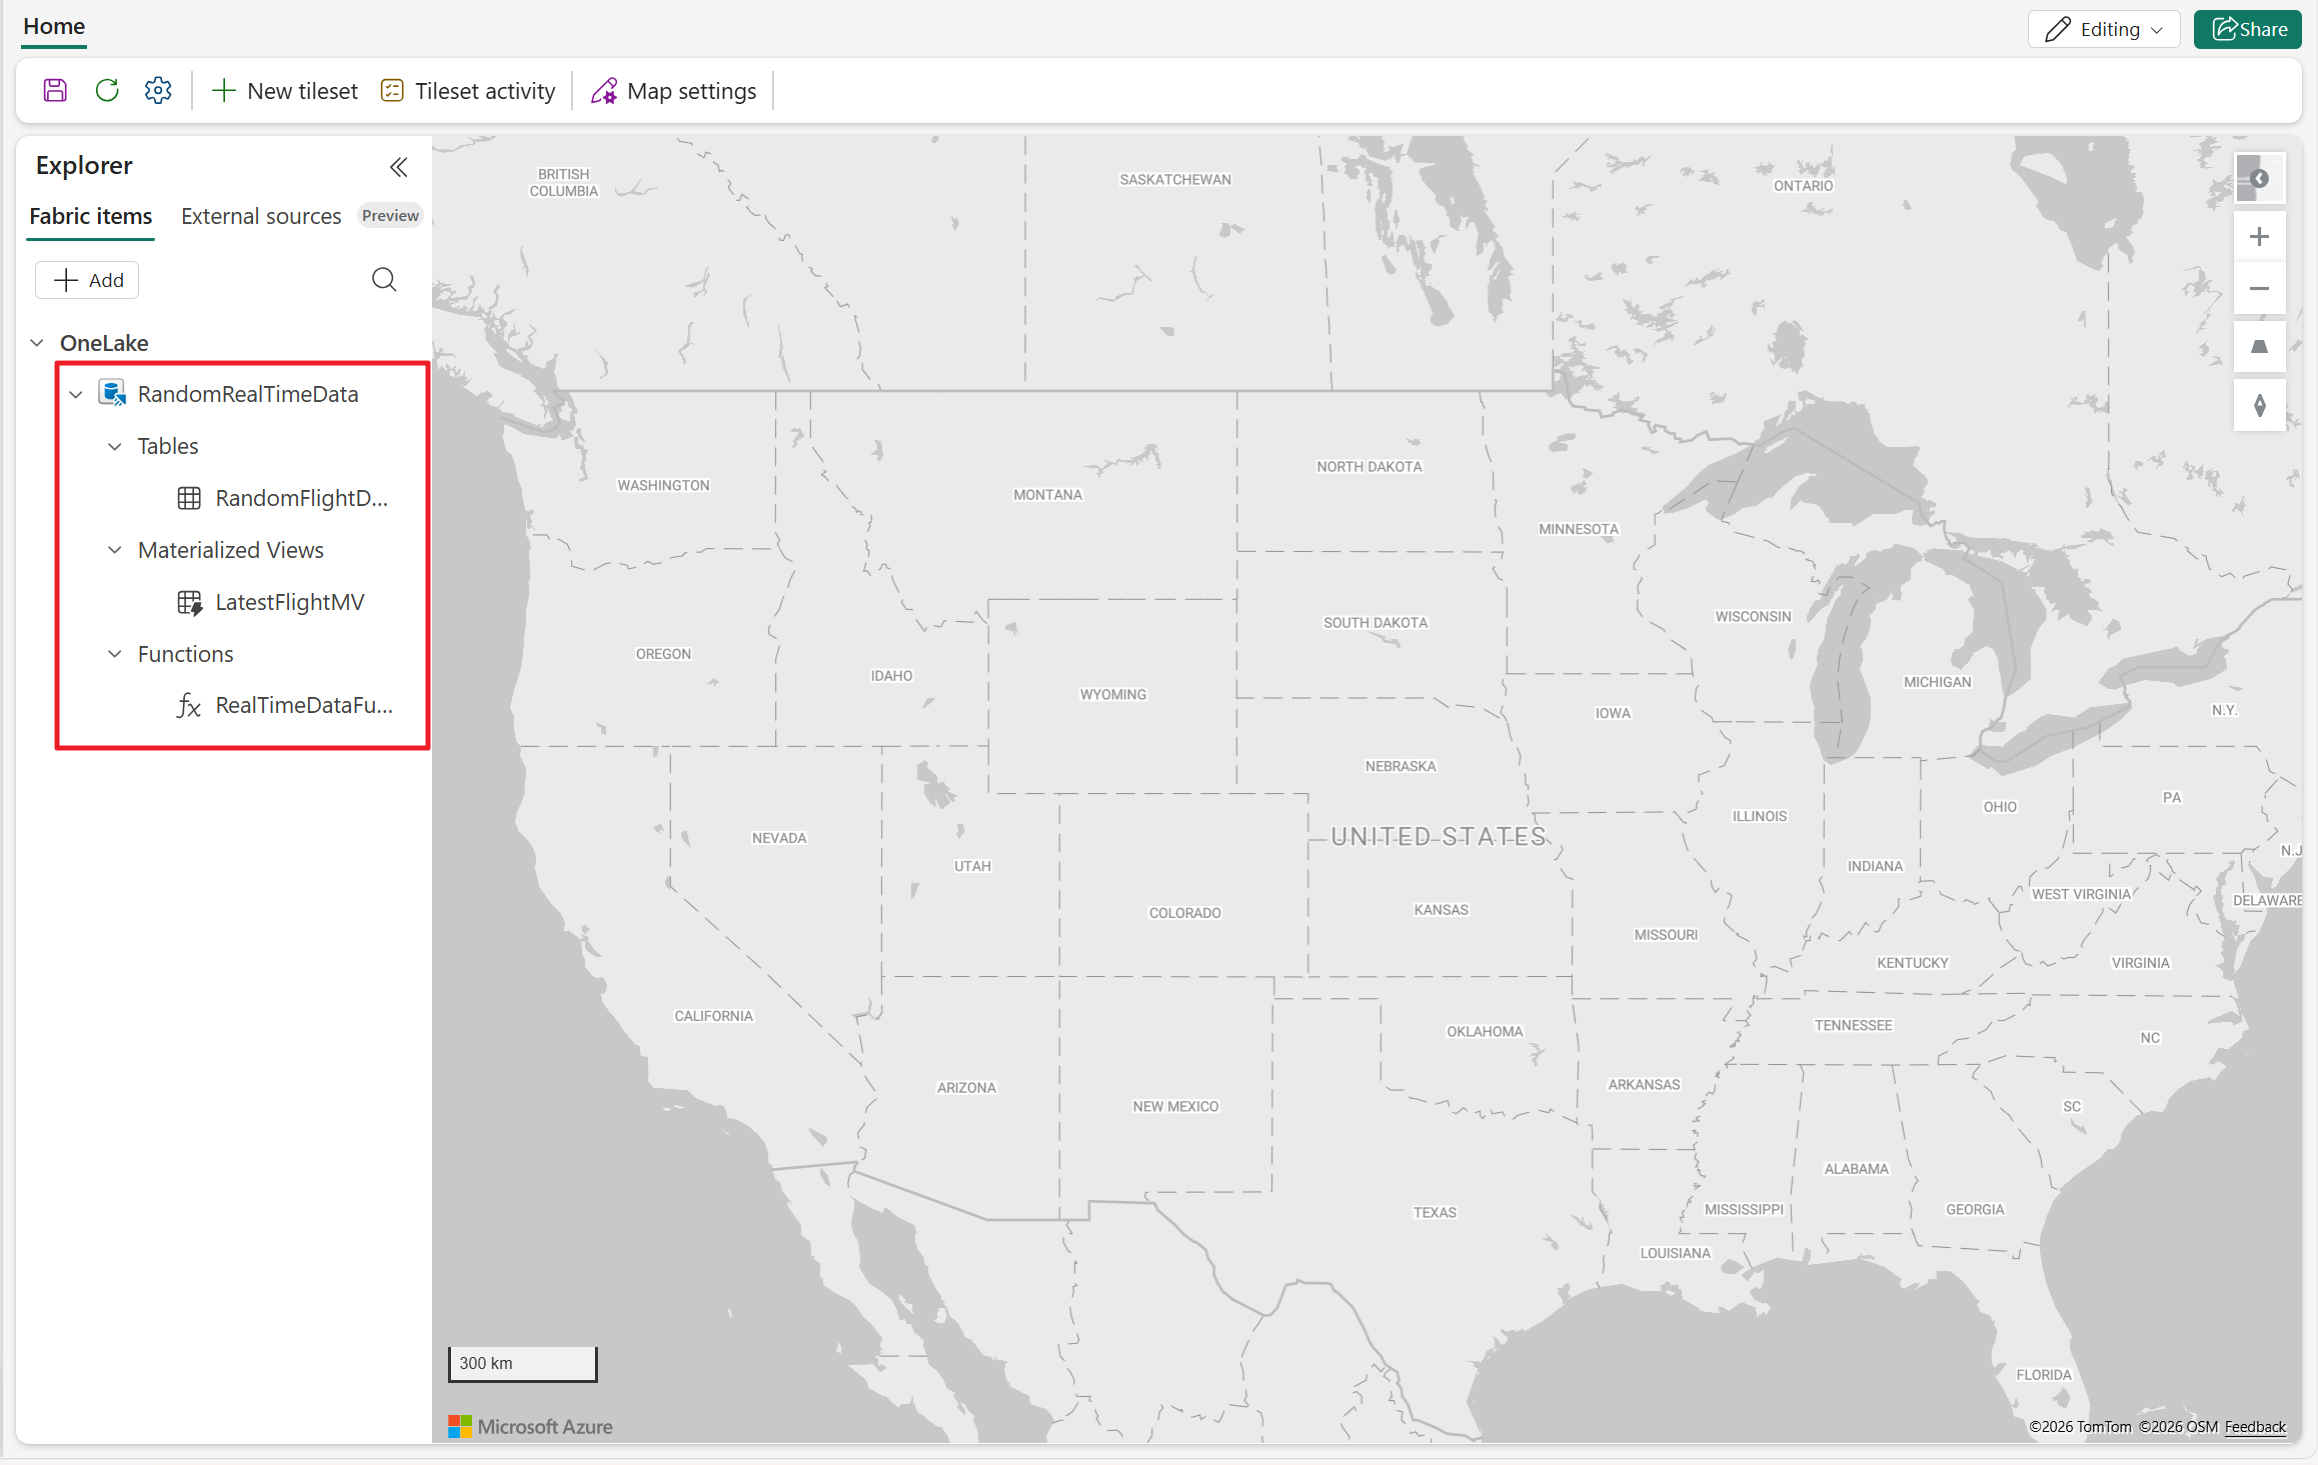
Expand your connected KQL database, then expand Tables, Functions, or Materialized views.
Right‑click the target entity, and select Show on map.
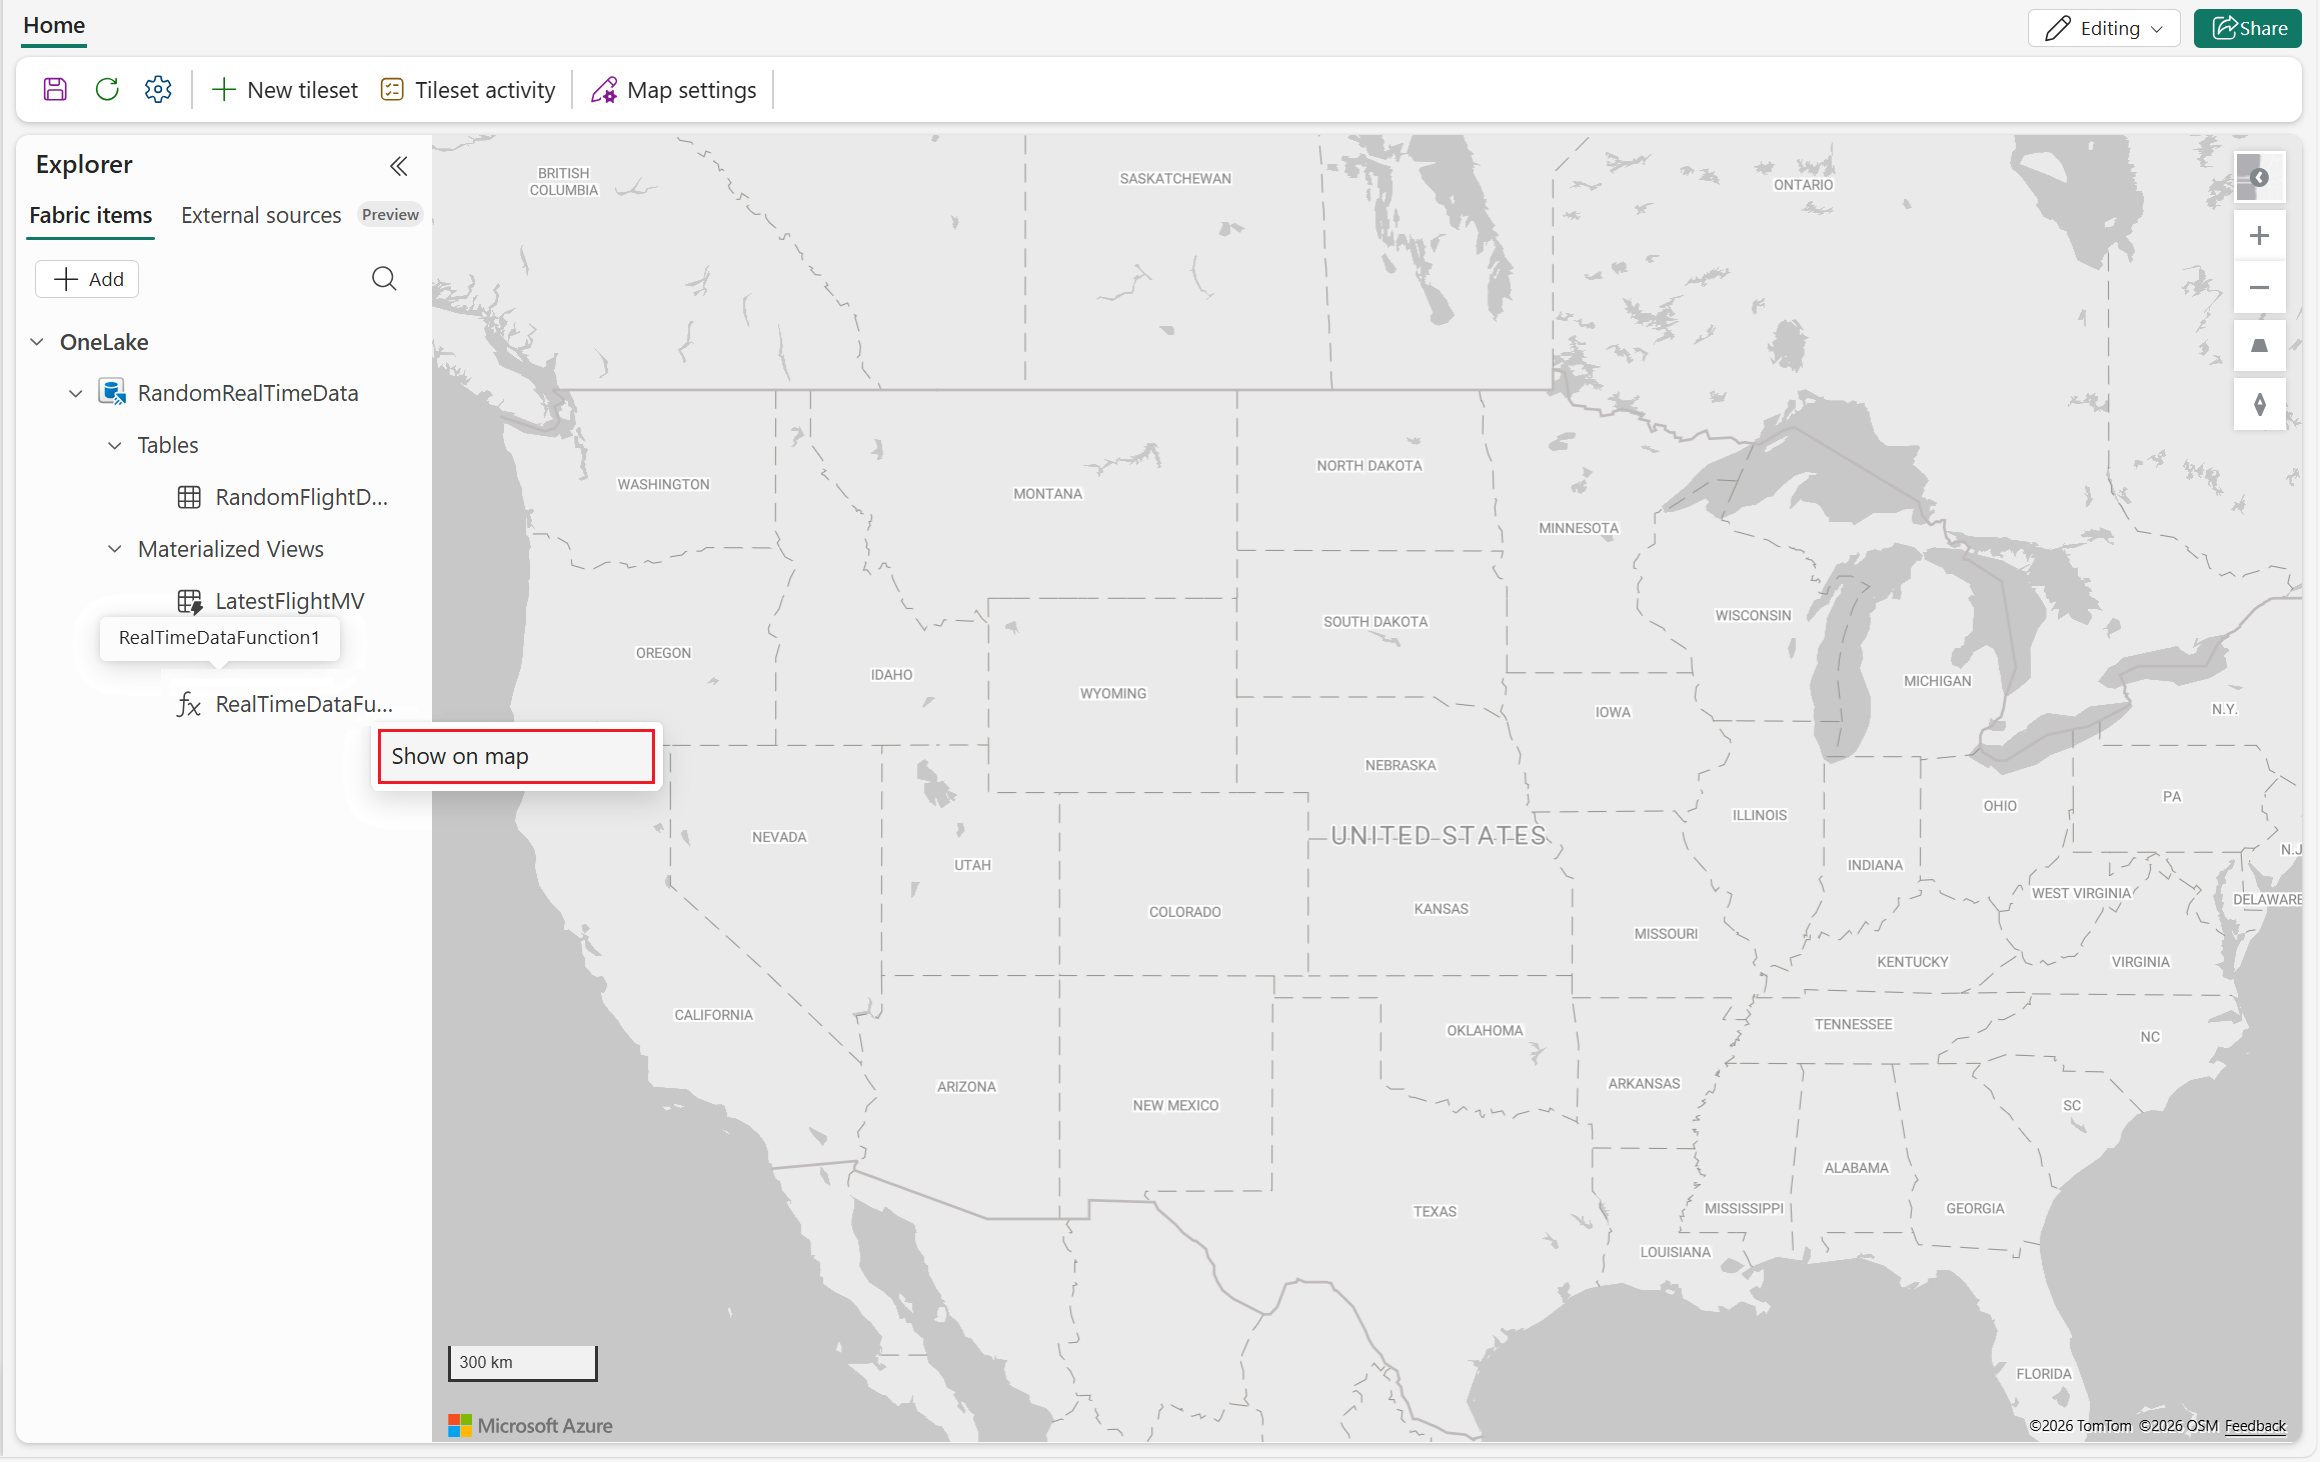
This action launches the data layer configuration wizard.
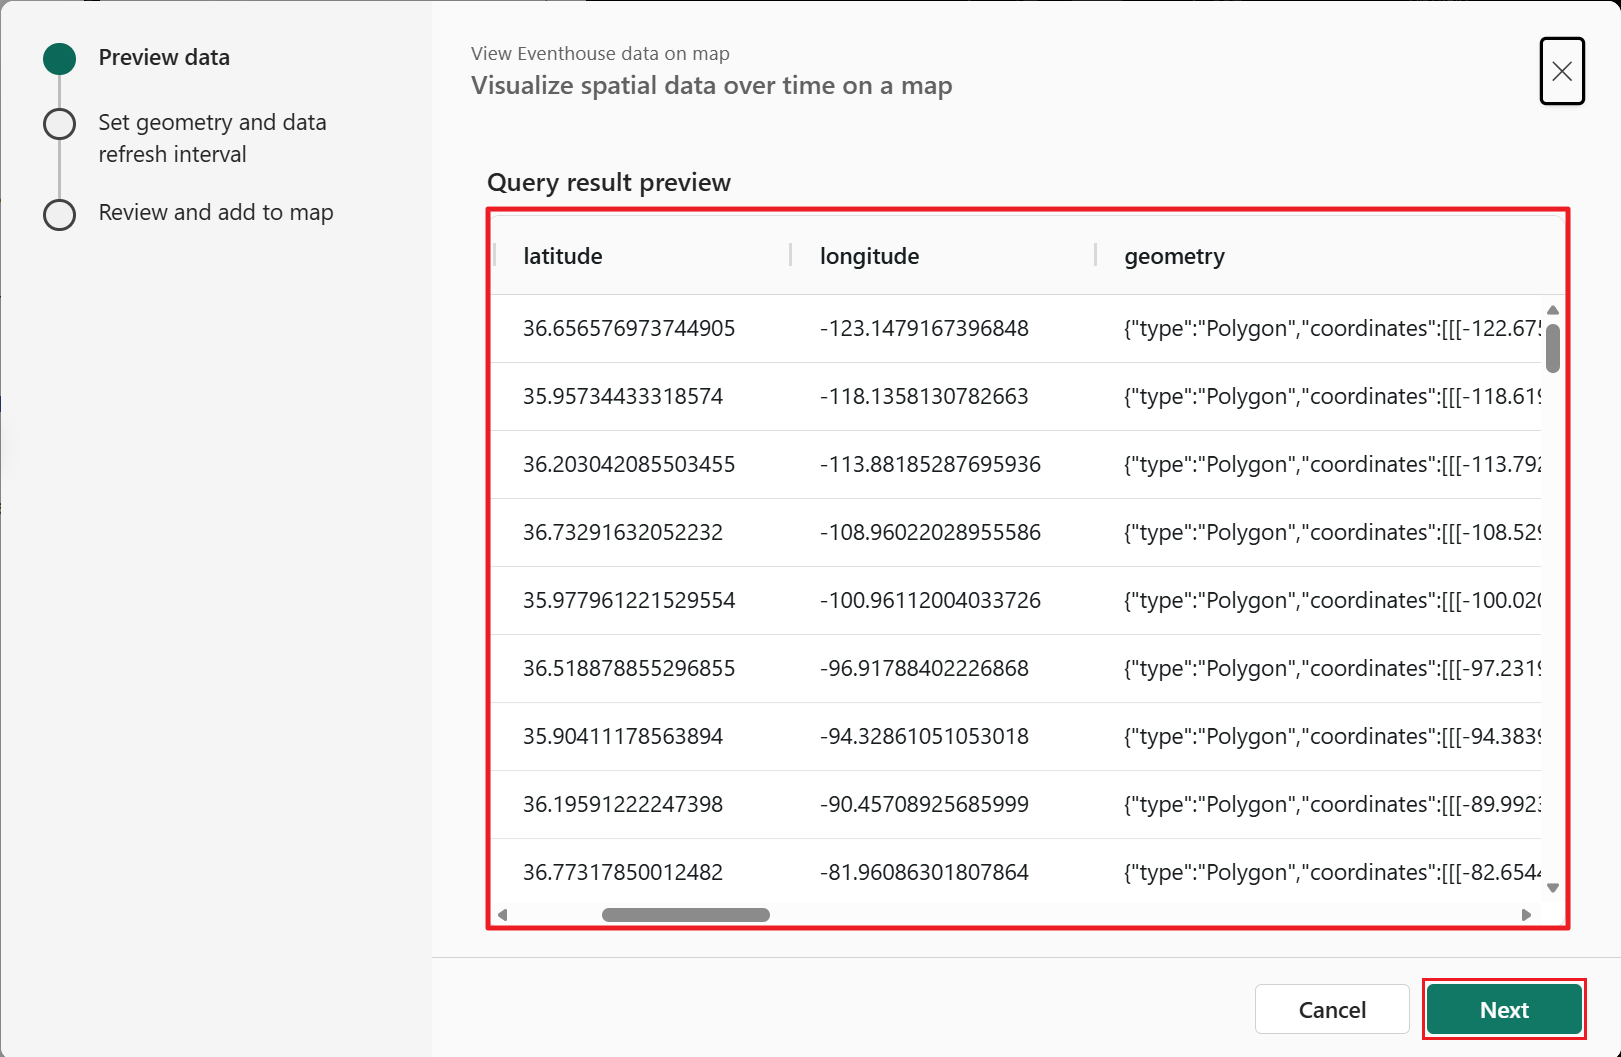
In the Preview data step, review the query output to confirm that the expected columns and values are returned. This preview reflects the data that is rendered on the map. Once confirmed, select Next.
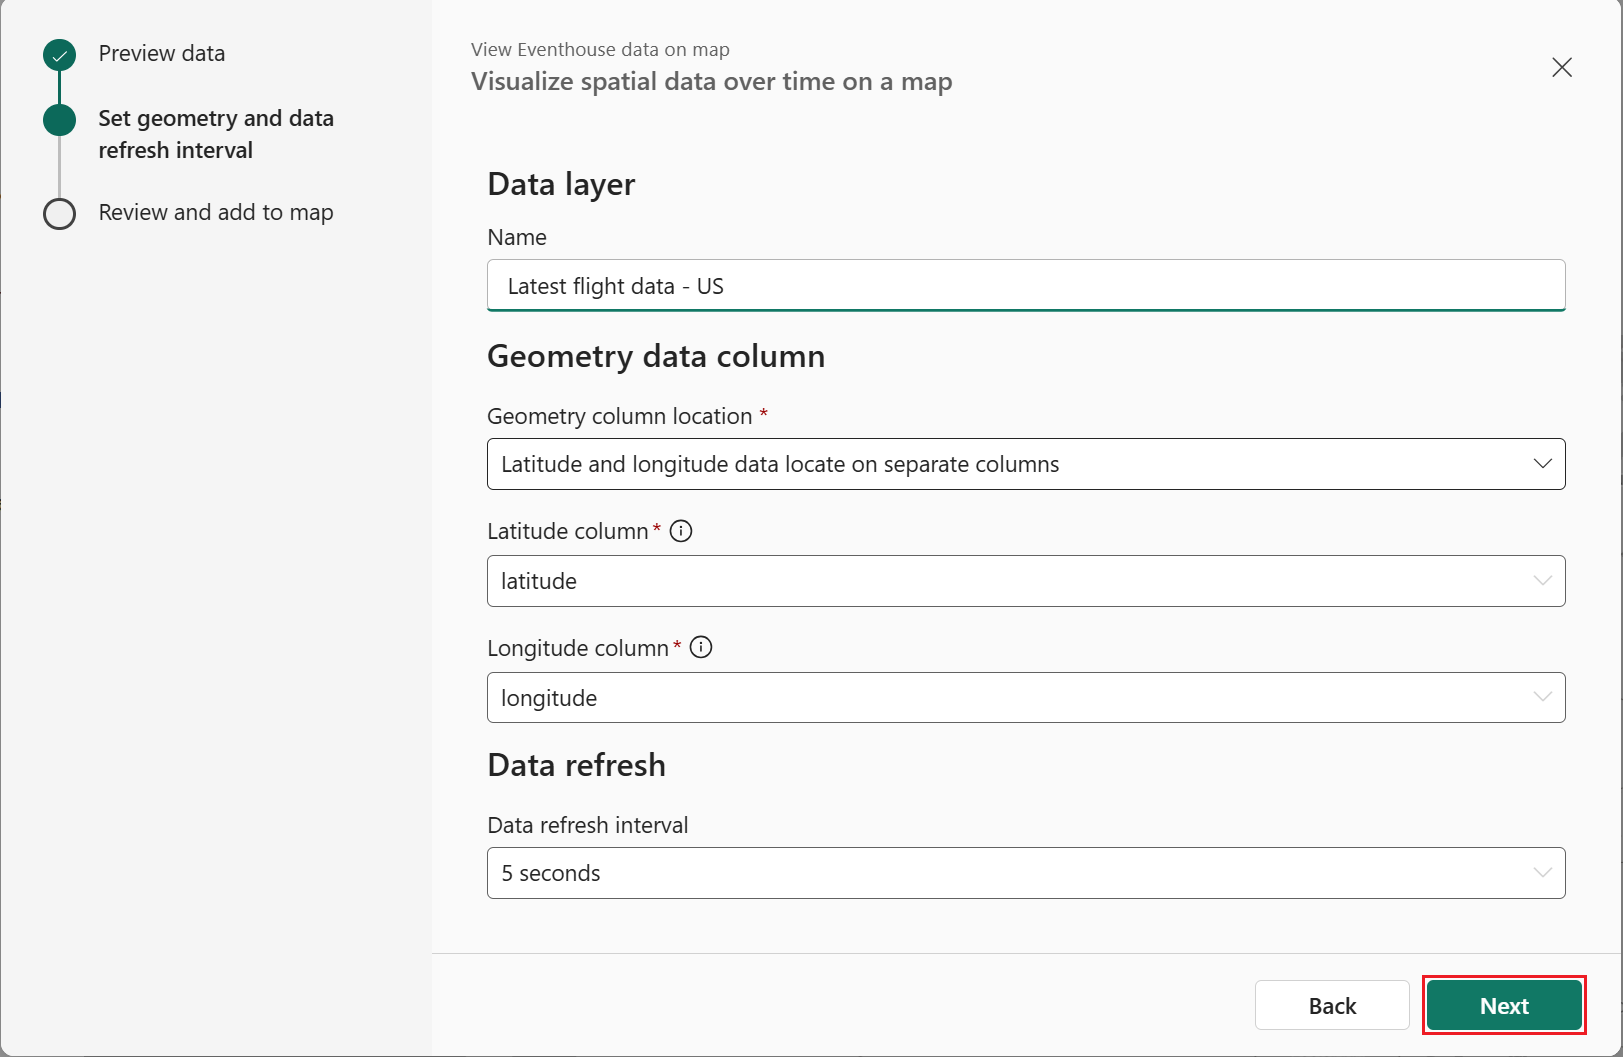
In the the Fabric Maps Set geometry and data refresh interval configuration step, Specify how geometry is defined, then select Next.
There are two options for defining geometry:
Latitude and longitude data are stored in separate columns
- Select Latitude and longitude data located in separate columns.
- Choose the latitude and longitude columns from the list.
- Select your desired data refresh interval.
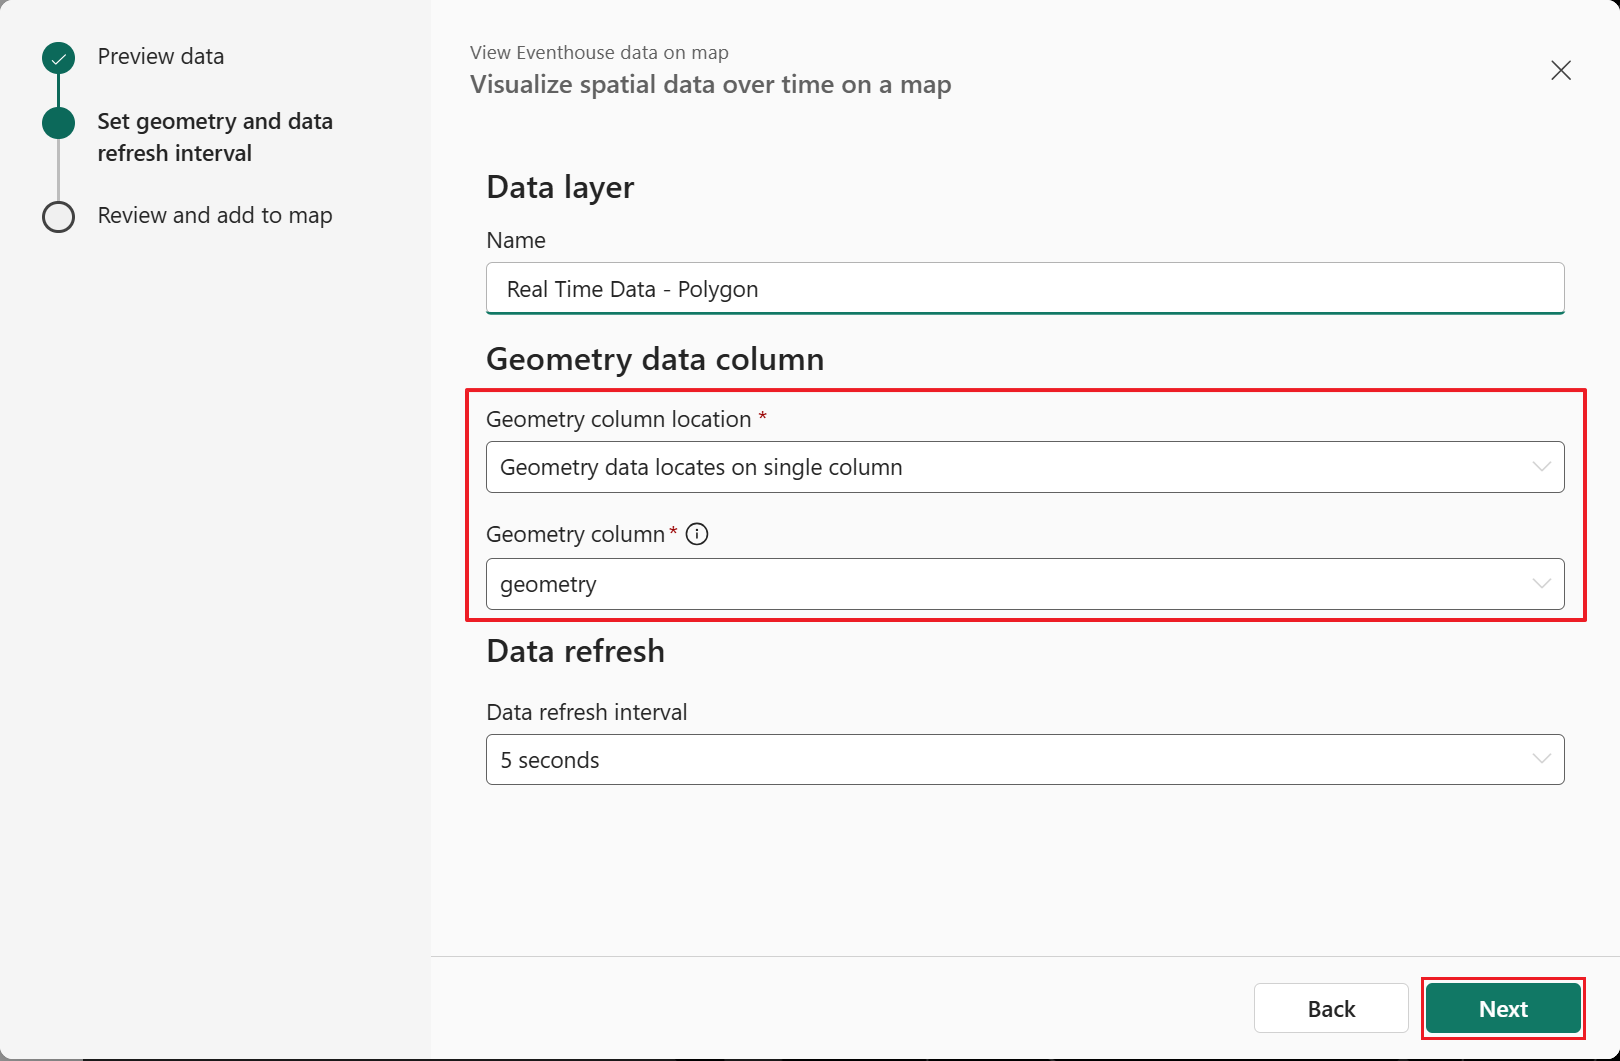
Geometry data is stored in a single column
- Select Geometry data locates on single column.
- Choose the geometry column from the list.
- Select your desired data refresh interval.
Tip
When to use dynamic geometry
Use a dynamic geometry column when your Kusto function returns non‑point geometries—such as lines or polygons—or when geometry is represented as GeoJSON. Dynamic geometry is well suited for routes, boundaries, and areas where latitude and longitude columns aren't sufficient. For more information, see The dynamic data type
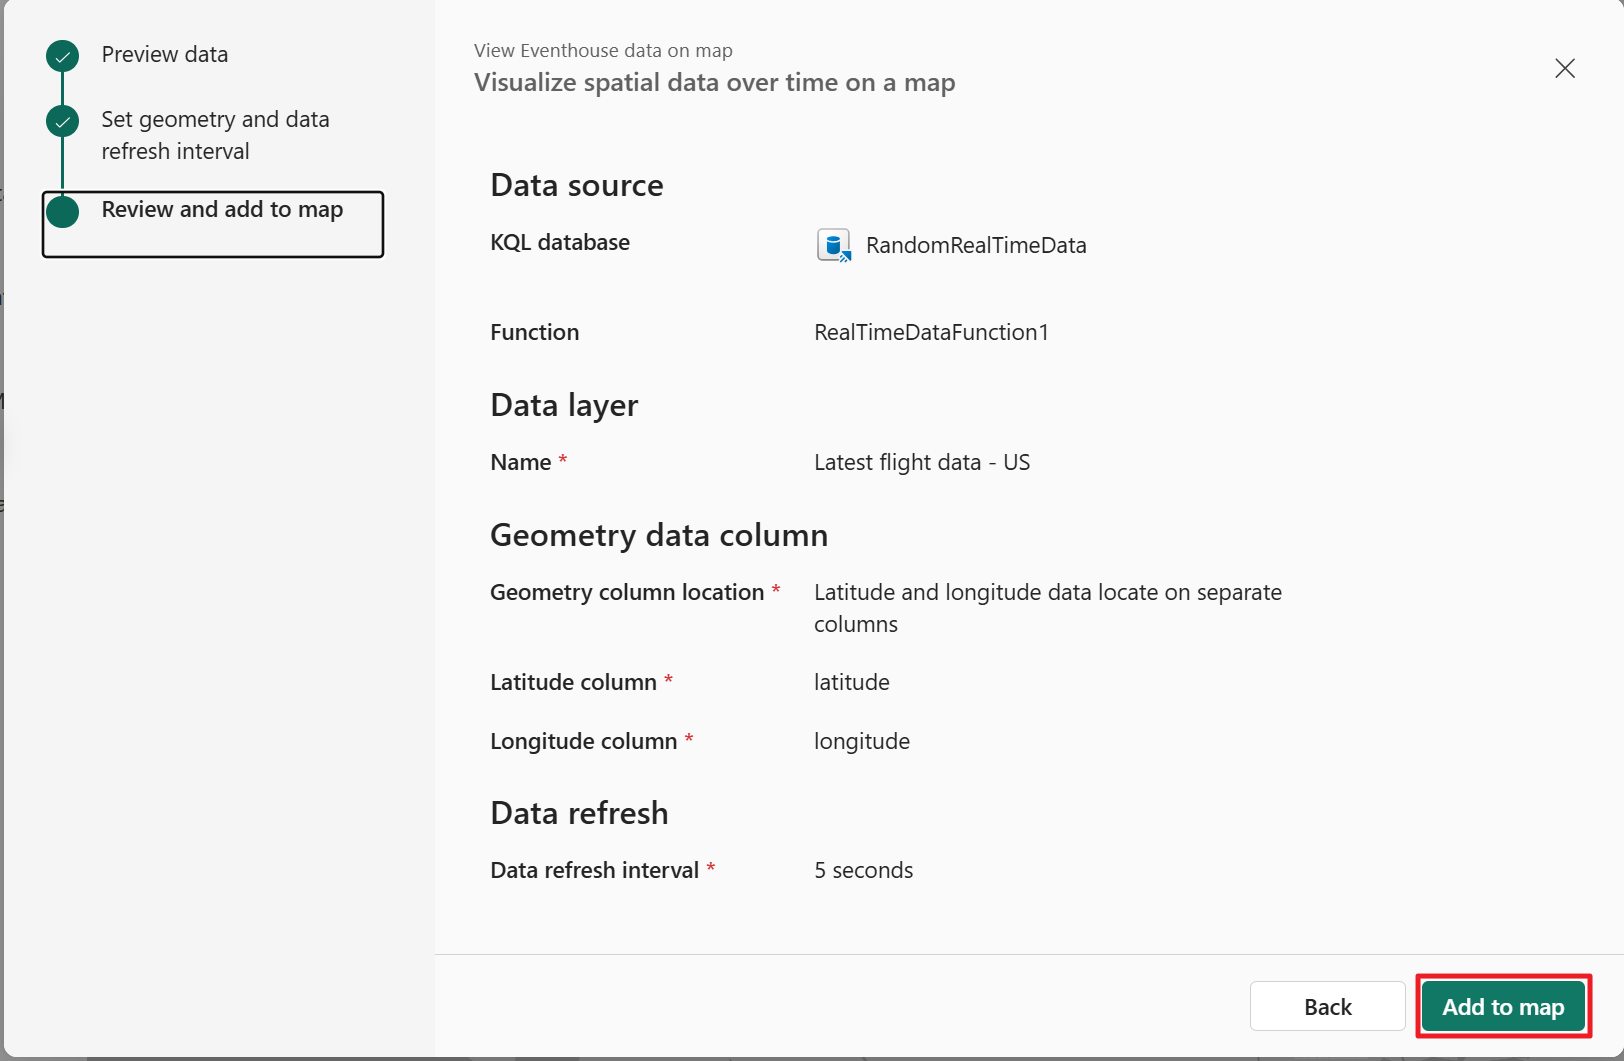
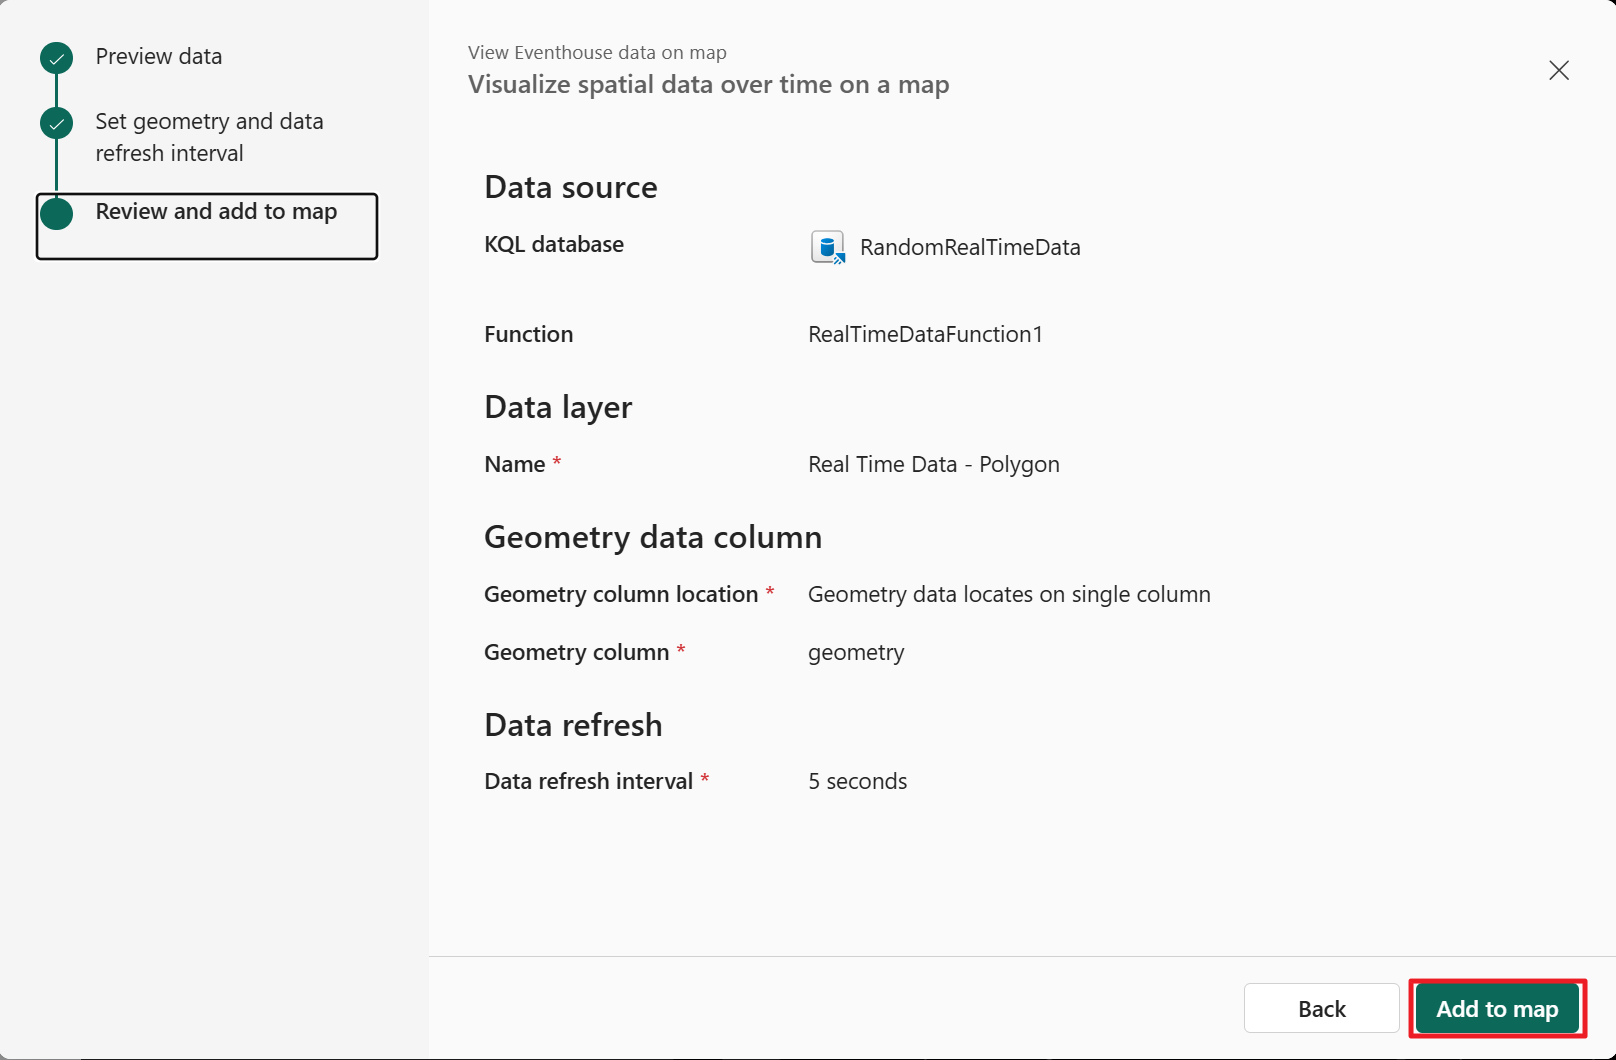
In the Review and add to map step, confirm the settings as expected. Once confirmed, select Add to map.
With Geometry data in two columns:
With Geometry data in a single column:
Note
Kusto-based layers support up to 100,000 features returned by the query. If your dataset exceeds this limit, refine your query to reduce the result size.
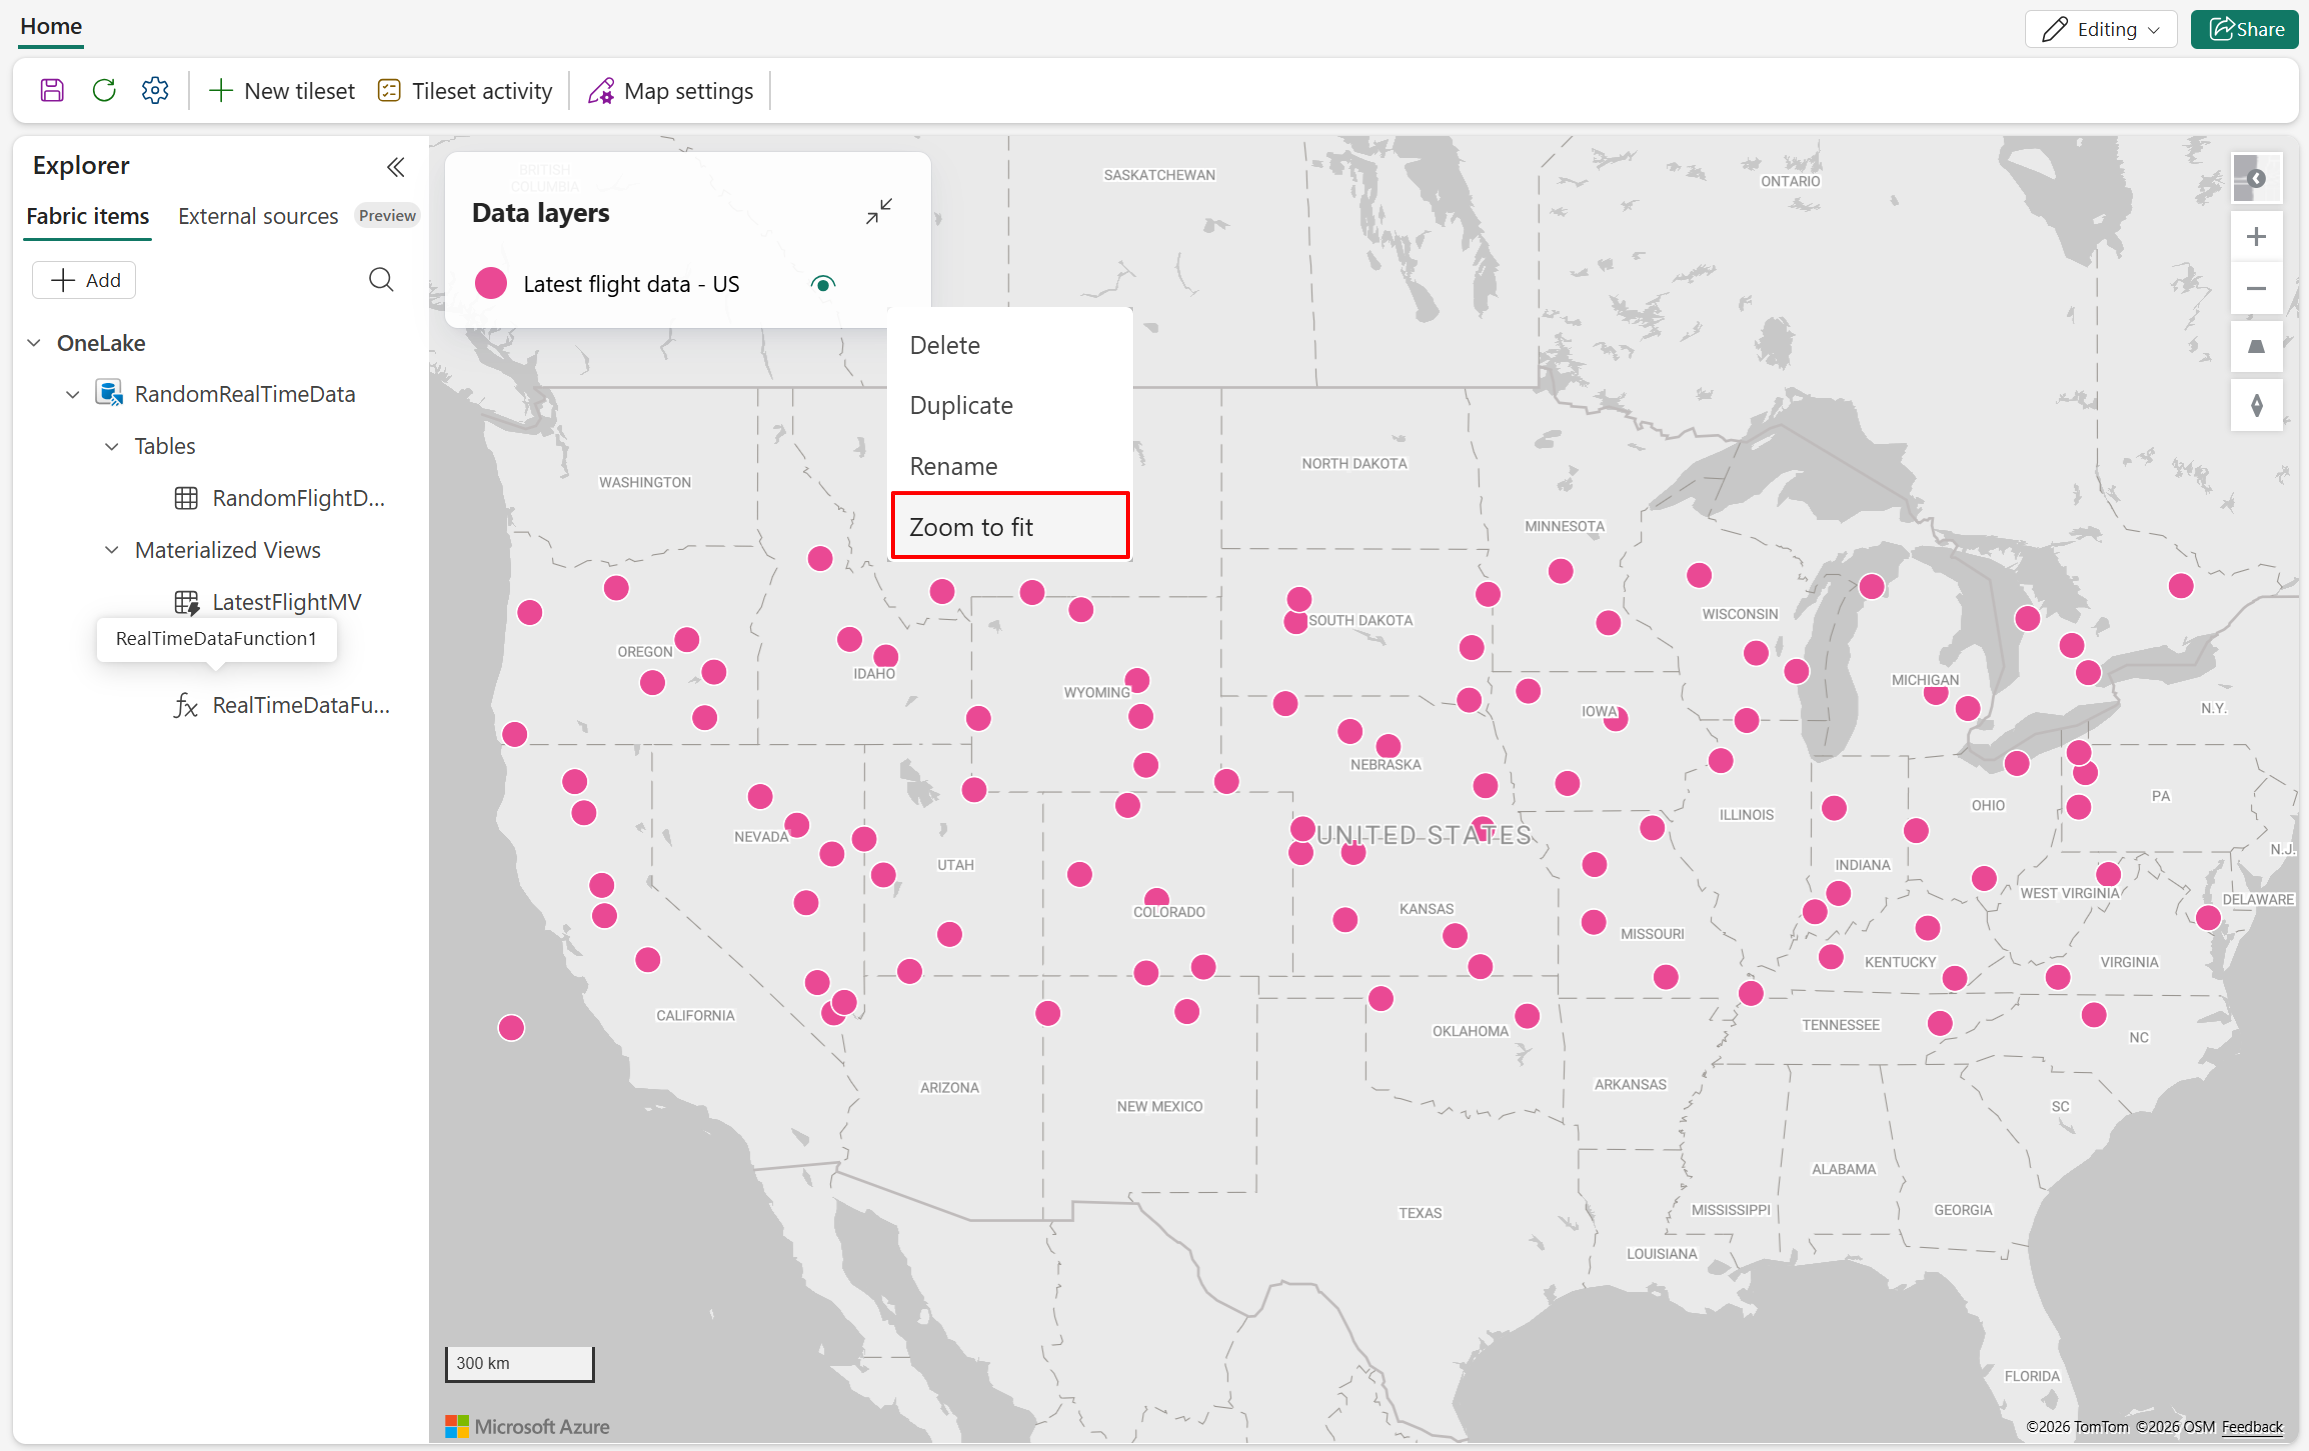
Once your layer is created, you can focus the map to zoom into where the data elements are located. To do this. select the data layer context menu (...) then Zoom to fit.
Configure styling and filtering
After the layer is added, you can:
- Change the layer type to Marker for point-based layers.
- Apply color, size, and rotation using data-driven styling.
- Enable clustering for dense datasets.
- Add filters to restrict the displayed features based on field values.
These options allow you to tailor the visualization to your scenario without modifying the underlying KQL entity.
- For more information on layer styling, see Customize a map.
- For more information on data filtering in layers, see Data filtering in Fabric Maps.
The following screenshot demonstrates a polygon-based data layer that autorefreshes every 5 seconds:
The following screenshot demonstrates a point-based data layer that autorefreshes every 5 seconds:
Next steps
To learn more about custom styling:
To learn more about data filtering: