Application reliability in Endpoint analytics
The application reliability report provides insight into potential issues for desktop applications on managed devices. You can quickly identify the top applications that are impacting end-user productivity, and see aggregate app usage along with app failure metrics for these applications. From the report, drill into specific device data and view a timeline of app reliability events to troubleshoot end-user impacting issues.
Prerequisites
- Devices are enrolled in Endpoint analytics.
- Enroll Configuration Manager devices
- Enroll Intune devices
- After enrollment, client devices require a restart to fully enable all analytics.
- Devices enrolled from Configuration Manager need client version 2006, or later installed
App reliability score
The App reliability score provides a high-level view of desktop application robustness across your environment. As with other Endpoint analytics scores, the App reliability score is a number between 0 and 100. The score is calculated from the app reliability scores of each desktop application in your environment that's found in the App performance tab.
Each application on the App performance tab is assigned an App reliability score based on:
- Crash frequency: For each of app, the total number of crashes and the total usage duration over a 14 day rolling window is used to calculate the Mean time to failure value. This calculation normalizes the crash rate allowing for direct comparison of the relative frequency of crash events across different applications. This value is the primary contributor to an app's reliability score.
- Total usage duration: Factoring in the usage duration across all enrolled devices helps ensure the most disruptive application issues are prioritized.
App performance tab
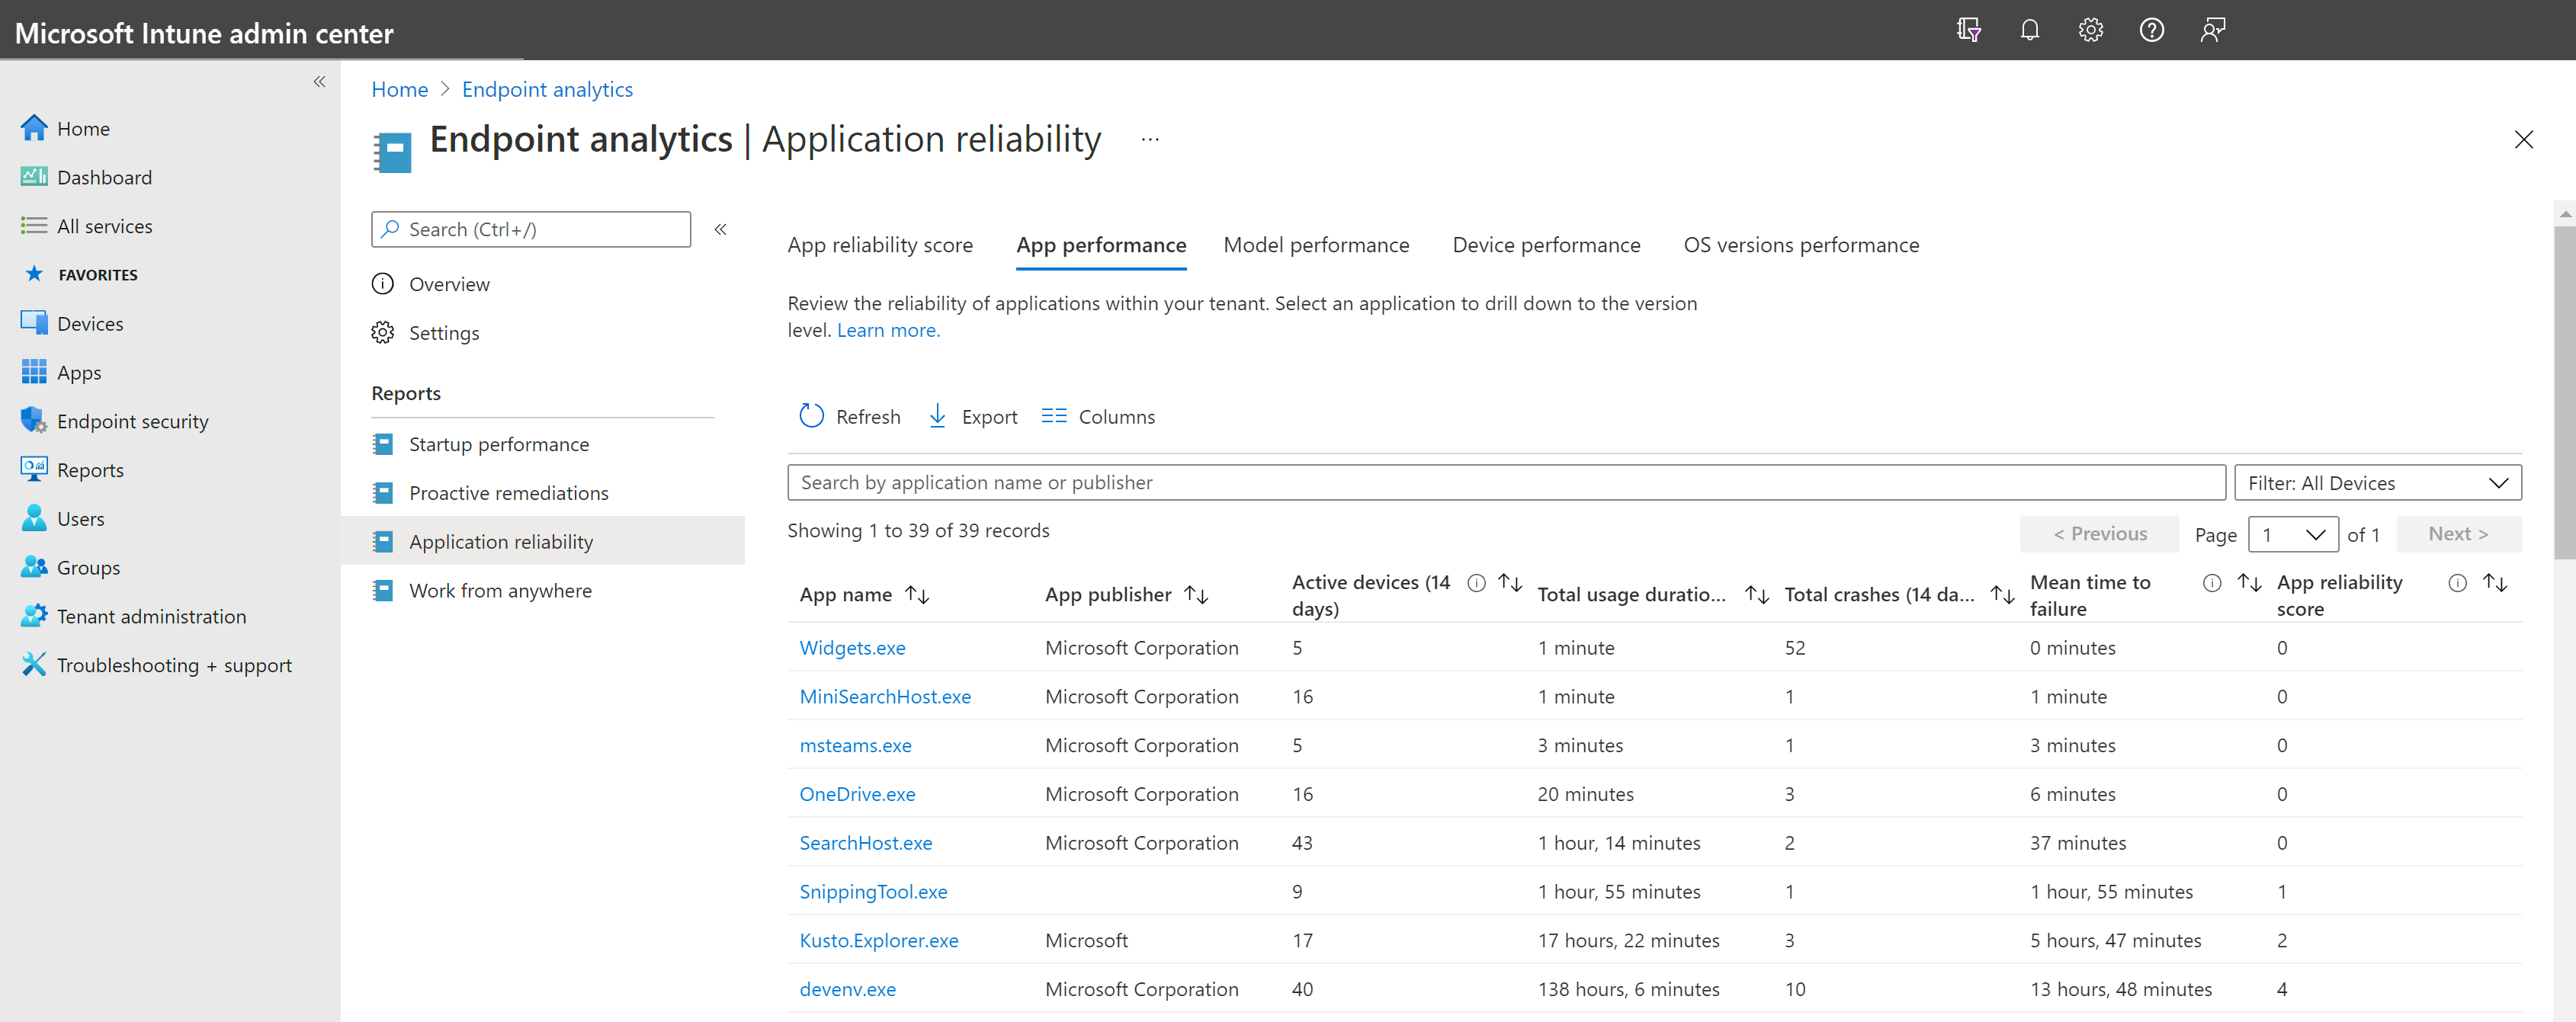
The App performance tab uses data from the past 14 days to show reliability insights for each desktop application in your organization. The following applications are included in the report:
Foreground applications with a measurable amount of usage in your organization. Including these applications ensures that the report is focused on end-user impacting issues.
Applications with either an active device count that's greater than 5, or a count greater than 2% of the total number of your tenant's enrolled devices, whichever is larger. Including these applications helps to filter out noise and ensures that calculations are made across a sufficient number of devices to be meaningful.
For each application in the report, the following data is provided:
App name: The app identifier in the file manifest provided by your client devices. The app name is typically in executable (or .exe) format.
App display name: The friendly name of the application reported in the file manifest. This column is hidden by default since the data isn't always available.
App publisher: The publisher of the executable reported in the file manifest. Limited cleanup occurs on the app publisher. For instance, Microsoft Corporation and microsoft corporation are collapsed during cleanup. However, app metadata isn't added or modified in cases where it's unavailable, null, or potentially inaccurate.
Active devices (14 days): The total number of your tenant's enrolled devices that have launched this app at least once in the past 14 days.
Total usage duration (14 days): The cumulative usage duration of the application across all your tenant's enrolled devices over the past 14 days. Engagement time is used to determine usage duration. Engagement time is composed of both:
- Interactive time: The time when the user is actively engaging with an application, such as browsing the web
- Keep-alive time: Time when the application is requesting a keep-alive from the OS, such as when presenting a PowerPoint or watching a video.
Total crashes (14 days): The total number of application crash events reported across all enrolled devices in your tenant over the past 14 days.
Mean time to failure: The average amount of engagement time that an end user is able to use the application before a crash occurs over the past 14 days. This value is calculated by dividing Total usage duration (14 days) by Total crashes (14 days). By relating usage duration and crash counts, the frequency of crashes across different applications is normalized. Applications without crash events in your tenant over the past 14 days are given a mean time to failure value of No crash events.
App reliability score: A score between 0 and 100 that represents the relative reliability of the application in your tenant. This score is calculated based on Mean time to failure and Total usage duration (14 days). A score of 0 represents an unreliable app that is likely hampering end-user productivity. A score of 100 represents a reliable app that is likely contributing to end-user productivity.
Note
A maximum of 10 application crash events per application, per device, per day is used. This prevents excessive data collections from devices with severe application issues and helps prevent outlier devices from having undue influence over the reliability scores for individual applications.
Applications with an insignificant amount of foreground usage (about 10 minutes or fewer) on a particular device may not be captured.
App performance details
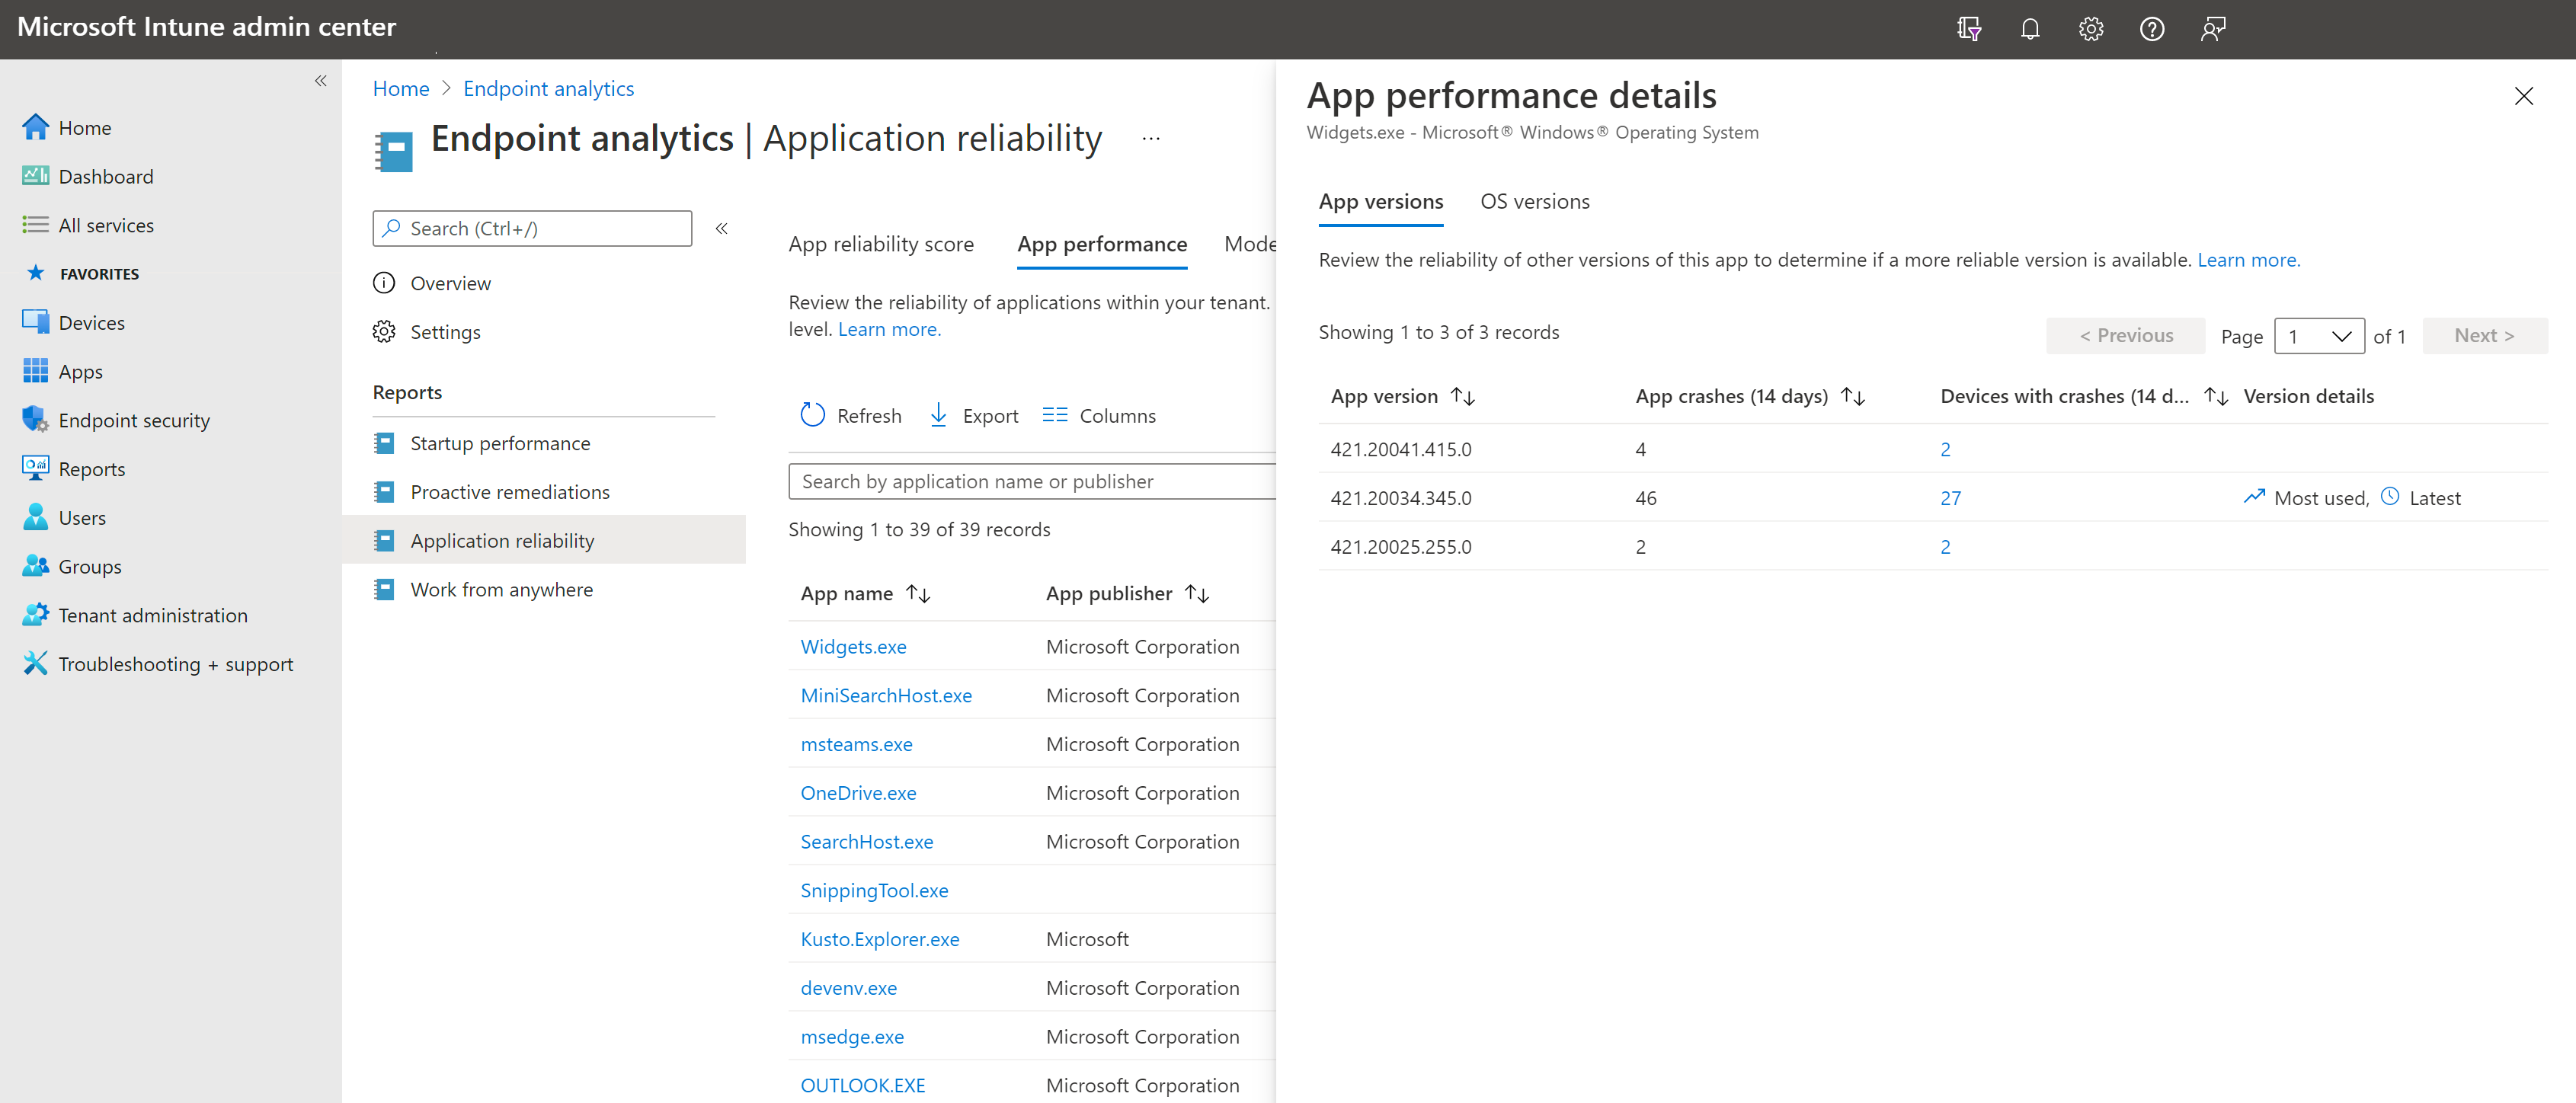
Selecting an app name in the table from App performance opens App performance details. App performance details contain two tabs:
- App versions: This tab allows you to compare the number of App crashes and number of unique Devices with crashes across different versions of the application over the past 14 days. This information can be useful in determining which version of an application is the most reliable. The information can assist with troubleshooting a potential issue with certain versions of an application. You might also find these insights valuable when deciding which version of an application to deploy, whether to install an update or roll back an update.
- OS versions: This tab compares the Mean time to failure for the application across different versions of Windows. This information can be helpful for identifying potential correlations between OS version and application issues.
Device performance tab
The Device performance tab displays application reliability insights for each eligible, enrolled device in your tenant. The Total app crashes (14 days) column represents the total number of app crash events from any app reported by the device over the past 14 days. These crash events can be associated with any application installed on the device and aren't necessarily all from the same application.
Important
App crash events are limited to 10 app crash events per application, per device, per day.
Selecting a device name opens the Application reliability tab for that device. This tab displays a timeline of app crash and app unresponsive events for the device over a specified period of time, up to 14 days. Use the Filter option at the top of the timeline to select a custom time range.
Note
In the Device performance tabs of Endpoint analytics, admins will only see devices they have access to according to their assigned Scope tags. To learn more about Scope tags, see Scope tags for distributed IT. Aggregated insights, such as scores and summary views are calculated using all enrolled devices in the tenant. To apply Scope tags to aggregated insights, see Device scopes in Endpoint analytics.
Known issues
Exported csv files display numerical values
When reporting data is exported to a .csv file, the exported data doesn't use the friendly names you're used to seeing in the online reports. Use the information below to map the data in the exported file into the meaning of the value:
Application reliability report
- The
TotalAppUsageDurationandMeanTimeToFailurecolumns in the.csvfile are integer values with a unit of minutes - A
MeanTimeToFailurevalue of 2147483647 meansNo crash events
Per device score report
A value of
-1or-2in theEndpointAnalyticsScore,StartupPerformanceScore, andAppReliabilityScorecolumns means the associated score is unavailableHealth status:
HealthStatus .csvvalueReport value 0 Unknown 1 Insufficient data 2 Needs attention 3 Meeting goals
Startup performance report
The CoreBootTime, GPBootTime, CoreLogonTime, GPLogonTime, DesktopUsableTime, Median, and TimePerProcess columns are integer values with a unit of seconds.
Work from anywhere report
Column name in
.csvfile: UpgradeEligibility
Report column name: Windows 11 readiness status.csvvalueReport value 0 Upgraded 1 Unknown 2 Not capable 3 Capable Column name in
.csvfile: GraphDeviceIsManaged
Report column name: Microsoft Entra registered
Some eligible, enrolled devices aren't appearing in the report due to a client certificate issue
Scenario: In certain uncommon situations, devices might be missing from the Application reliability report. You can determine how many devices are reporting application reliability data by looking at the number of records in the table on the Device performance tab of the Application reliability report.
Impacted devices: This issue affects devices enrolled in Endpoint analytics from Configuration Manager that are unable to download a required ServiceCertificate policy. Without this policy, devices can't report application reliability data to Endpoint analytics.
Important
This isn't a common issue. Before proceeding the mitigation, verify that your missing devices:
- Meet the prerequisites for the Application reliability report
- Are actively being used
- Have had sufficient time to start reporting data
Use the following script to determine if the issue impacts a device:
$query = "SELECT * FROM CCM_PendingPolicyState WHERE PolicyID=""B27D9CFC-84AD-0AF8-9DF1-23EE05E8C05D"""
$obj = Get-WmiObject -Query $query -Namespace "root\ccm\policyagent"

foreach ($value in $obj)
{
    if ($value.State  -eq 1)
    {
        Write-Host "Found ServiceCertificate policy in the pending policy list."
    }
}
Mitigation: Run the following script on affected devices to force a download of the updated ServiceCertificate policy state. When you complete all the steps, the issue is resolved and allows the device to start uploading application reliability data. Allow up to 72 hours to start seeing data in the Endpoint analytics portal.
On Error Resume Next

Set WshShell = WScript.CreateObject("WScript.Shell")

'First, find the pending policy object
Set wmiService = GetObject("winmgmts:\\.\root\ccm\policyagent")
Set wmiObjs = wmiService.ExecQuery("SELECT * FROM CCM_PendingPolicyState WHERE PolicyID=""B27D9CFC-84AD-0AF8-9DF1-23EE05E8C05D""")

For Each wmiPendingPolicy In wmiObjs
    If wmiPendingPolicy.State = 1 Then

        WScript.Echo "Found ServiceCertificate policy in the pending policy list. Resetting the state to force re-download"

        wmiPendingPolicy.State = 0
        wmiPendingPolicy.Put_

        If Err.Number <> 0 Then
            WScript.Echo "Failed to update ServiceCertificate policy state. Error code = " & Err.Number
        Else
            WScript.Echo "Successfully updated ServiceCertificate policy state."
        End If

    End If
Next


