Introduction to the Performance tool
Runtime performance is how your page performs when it's running, as opposed to loading. The following tutorial teaches you how to use the DevTools Performance tool to analyze runtime performance.
The skills you learn in this tutorial are useful for analyzing loading, interactivity, and visual stability of your web content, which are also key indicators for Core Web Vitals. Each of the Core Web Vitals represents a distinct facet of the user experience, is measurable in the field, and reflects the real-world experience of a critical user-centric outcome. You can see these Core Web Vitals in the Performance tool.
See also:
Get started
In the following tutorial, you open DevTools on a "Sluggish Animation" demo page and use the Performance tool to find a performance bottleneck on the page.
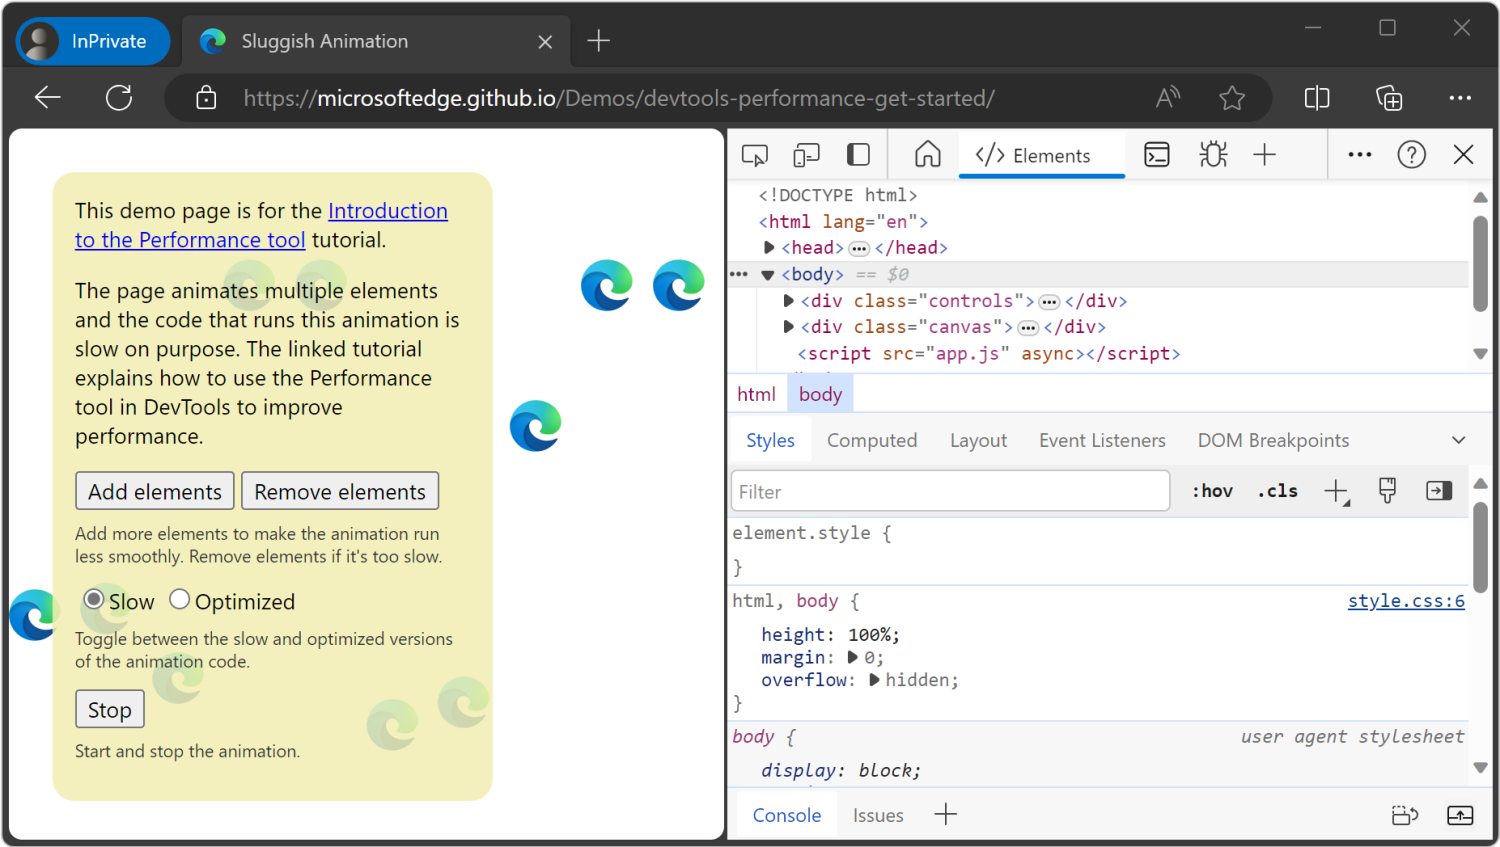
Open the Sluggish Animation demo page in your InPrivate tab or window. To do that, right-click the link and then select Open link in InPrivate window. You'll profile this page, which shows a variable number of icons moving up and down. For more information about InPrivate, see Browse InPrivate in Microsoft Edge
Source code: MicrosoftEdge / Demos > devtools-performance-get-started.
Press Ctrl+Shift+I (Windows, Linux) or Command+Option+I (macOS) to open DevTools:
For the rest of the screenshots, DevTools is shown undocked to a separate window.
Simulate a mobile CPU
Mobile devices have much less CPU power than desktops and laptops. Whenever you profile a page, use CPU Throttling to simulate how your page performs on mobile devices.
In DevTools, open the Performance tool.
Click Capture settings (
 ). DevTools reveals settings related to how it captures performance metrics.
For CPU, select 4x slowdown. DevTools throttles your CPU so that it's 4 times slower than usual.
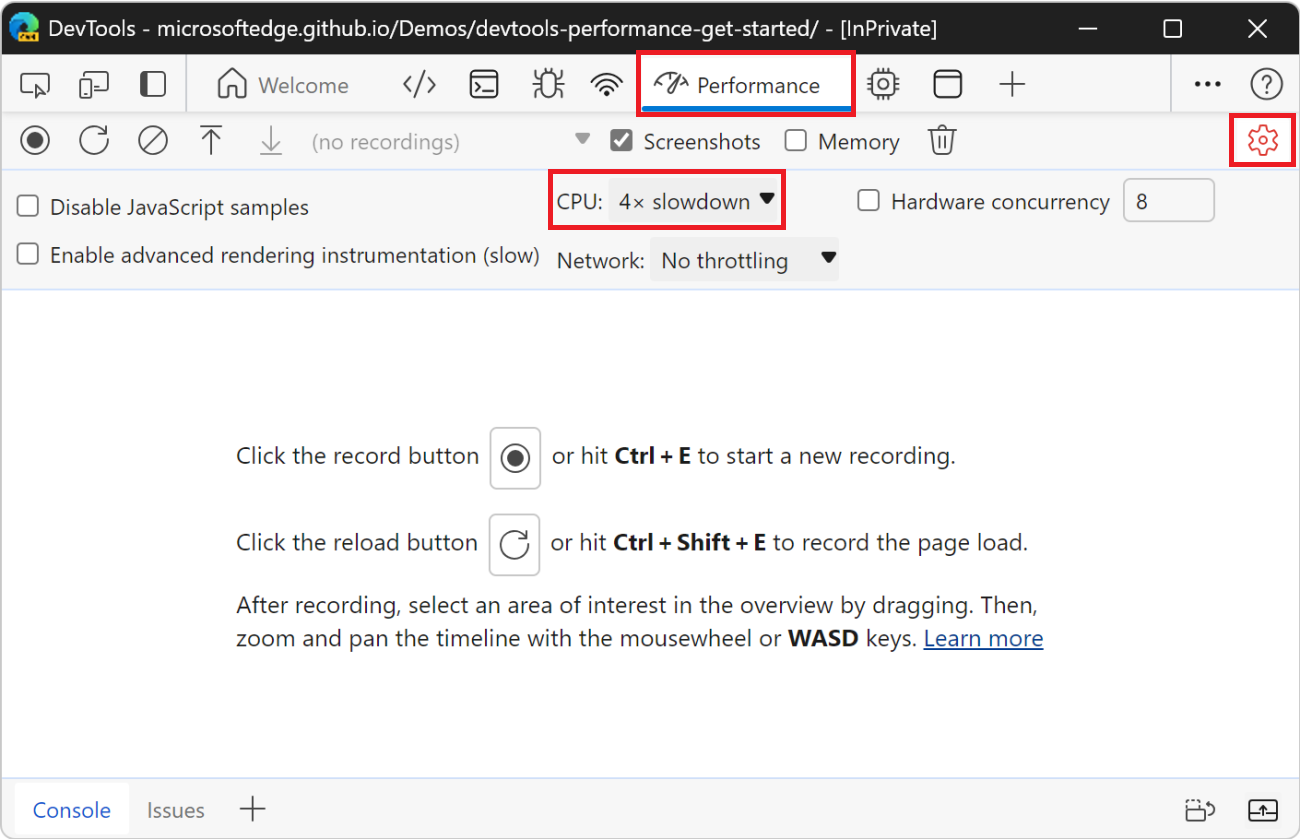
If you want to ensure that pages work well on low-end mobile devices, set CPU to 6x slowdown.
Set up the demo
The following section lets you customize the demo to make sure that your experience is relatively consistent with the screenshots and descriptions.
Click the Add elements button until the blue icons move noticeably slower than before. On a high-end machine, you can click it about 20 times.
Click Optimized. The blue icons should move faster and more smoothly.
To better display a difference between the optimized and unoptimized versions, click the Remove elements button a few times and try again. If you add too many blue icons, you could max out the CPU, and then you might not observe a major difference in the results for the two versions.
Click Slow. The blue icons move slower and with more sluggishness again.
Record runtime performance
When you ran the optimized version of the page, the blue icons move faster. Why is that? Both versions are supposed to move the icons the same amount of space in the same amount of time. Take a recording in the Performance tool to learn how to detect the performance bottleneck in the unoptimized version.
In DevTools, click Record (
 ). DevTools captures performance metrics as the page runs.
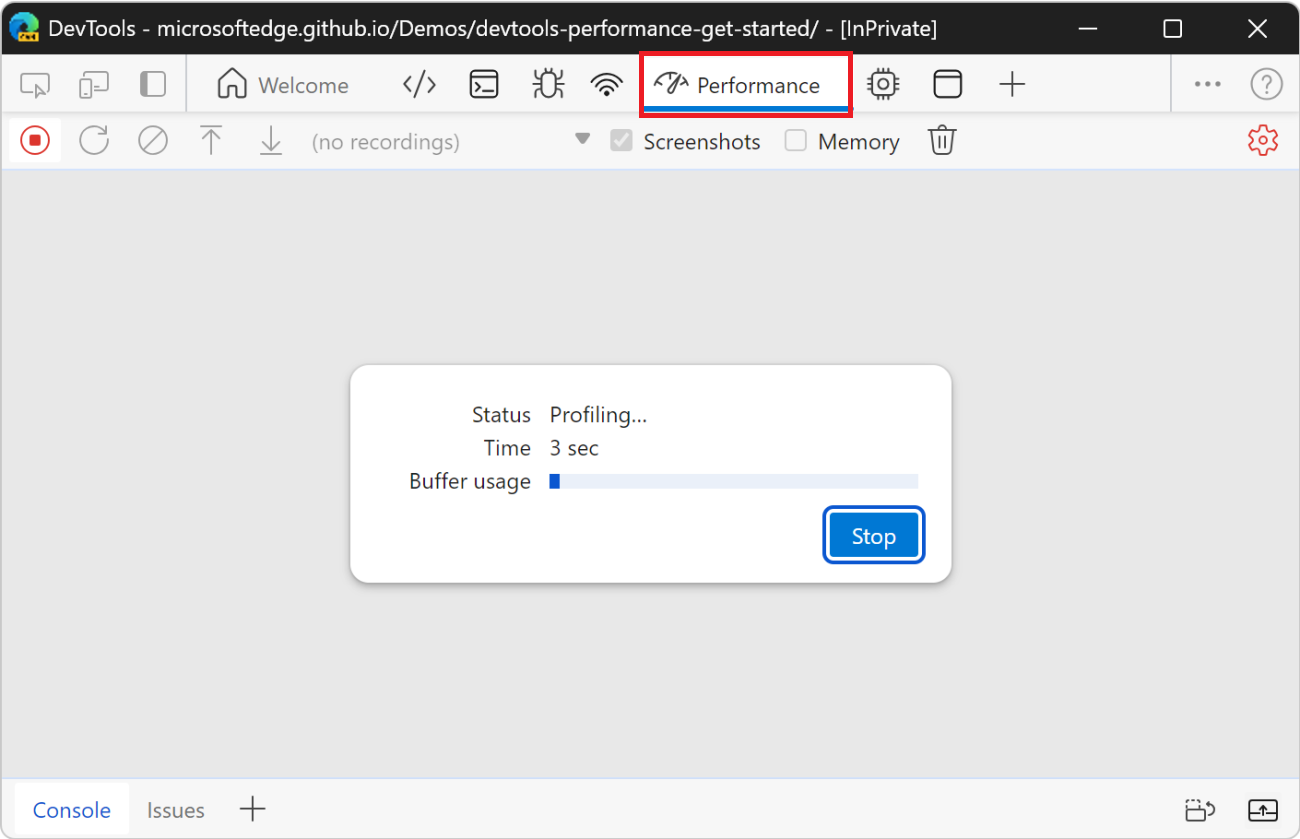
Wait a few seconds.
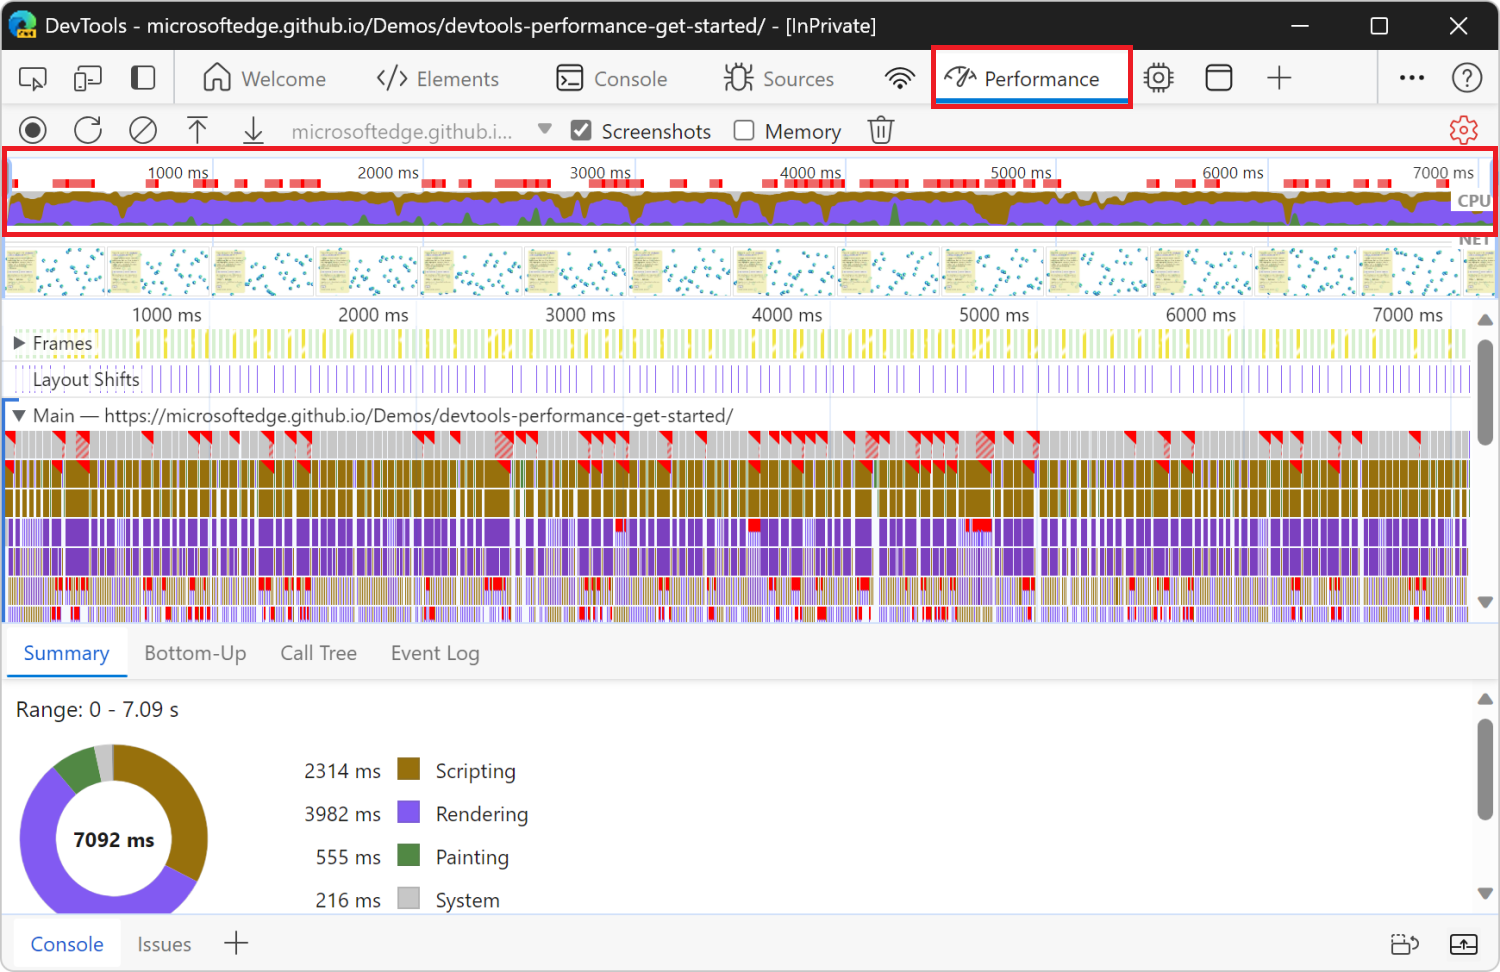
Click Stop. DevTools stops recording, processes the data, then displays the results in the Performance tool.
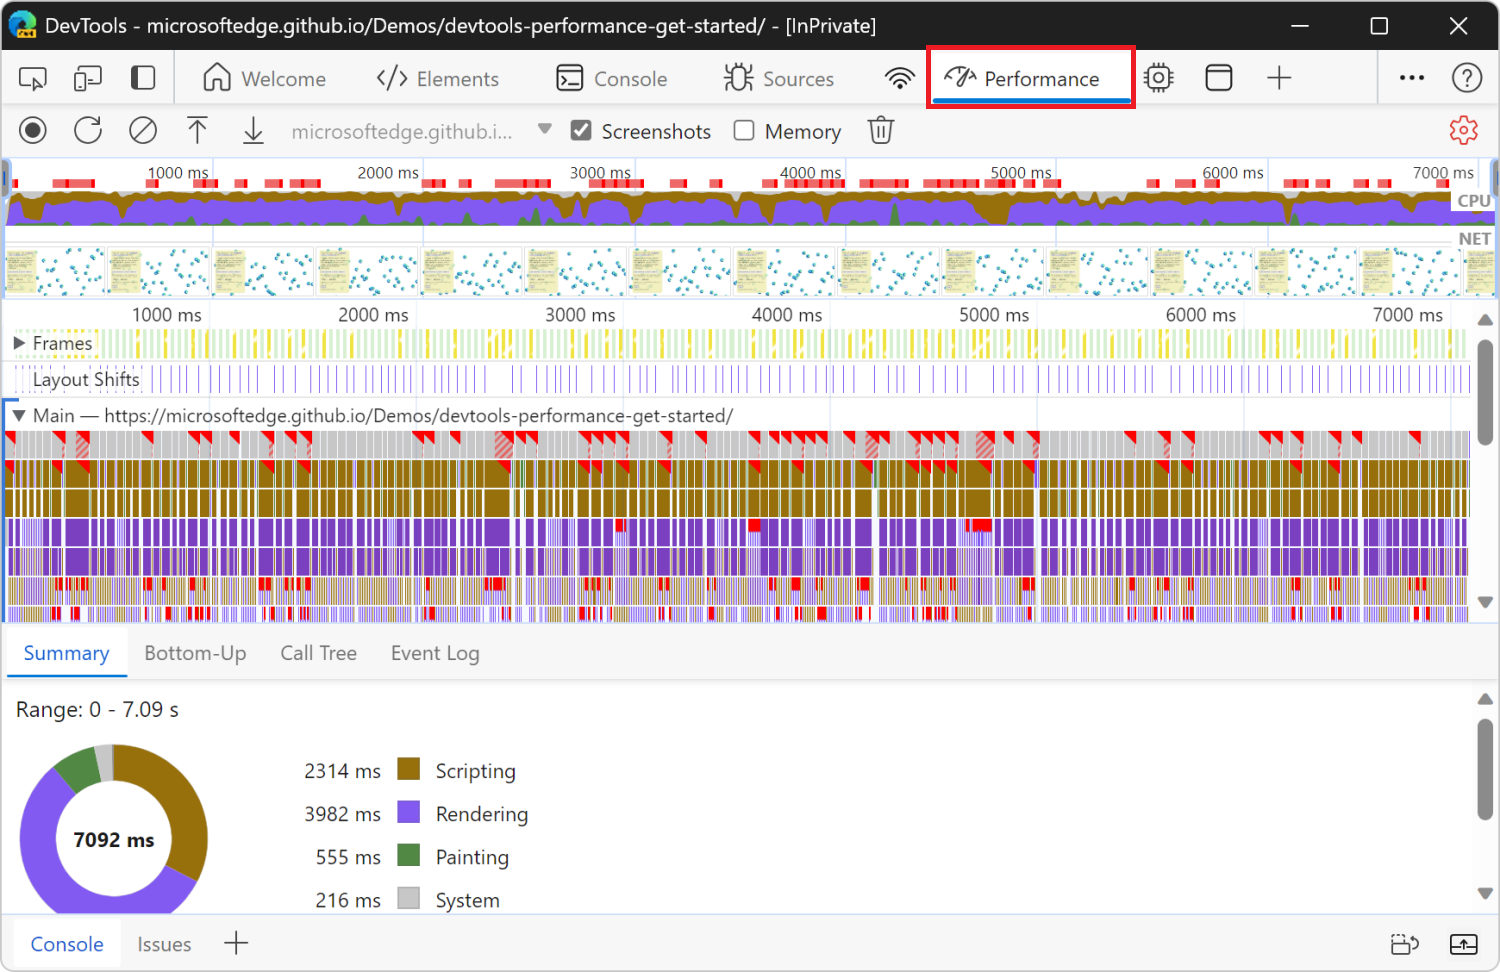
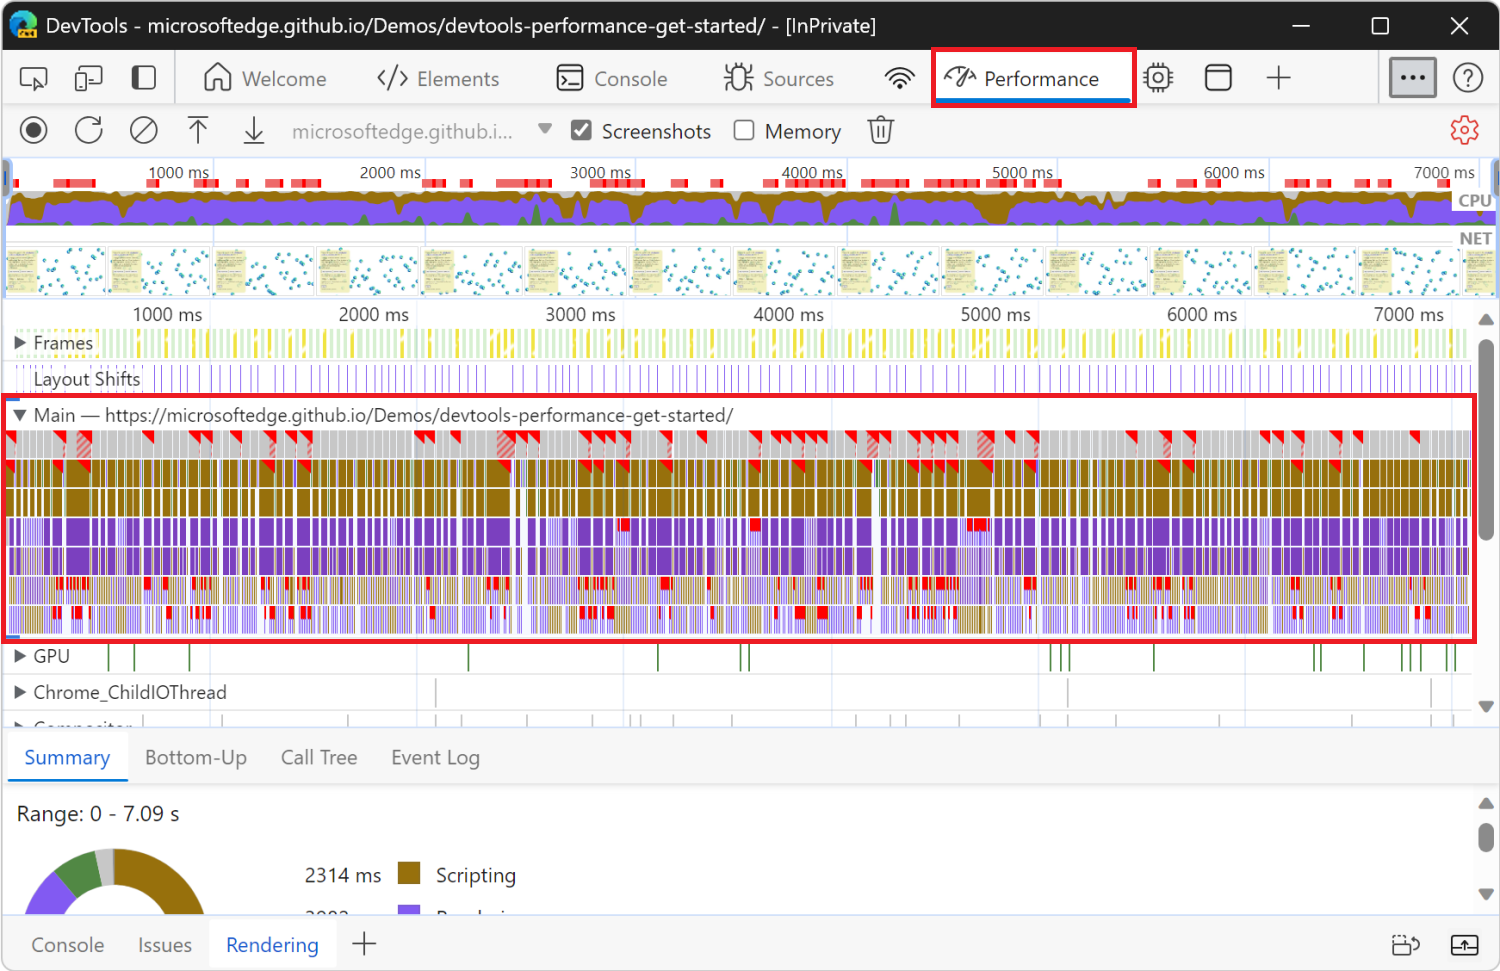
These performance results show an overwhelming amount of data, but it will all make more sense shortly.
Analyze the results
Once you have a recording of the page's performance, you can assess the page's performance and find the cause of any performance issues.
The CPU chart is displayed along the top. The colors in the CPU chart correspond to the colors in the Summary panel, at the bottom of the Performance tool. The CPU chart shows that these regions make up a large area, meaning that the CPU was maxed out during the recording. Whenever the CPU is maxed out for long periods, that's an indicator that the page is not performing well.
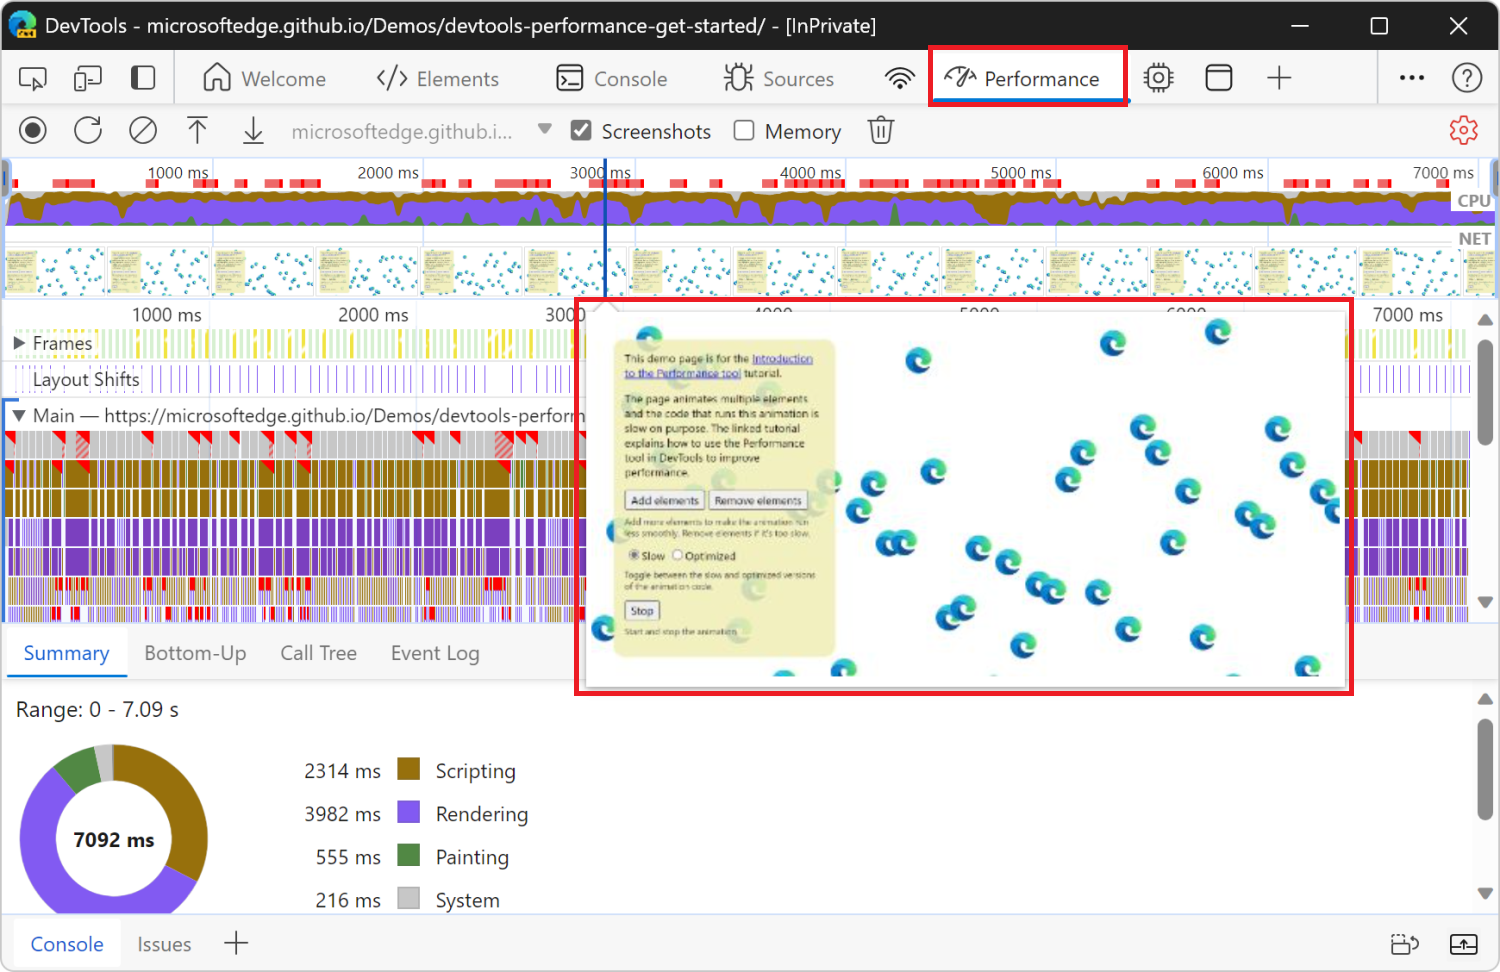
Hover over the CPU or NET charts. DevTools shows a screenshot of the page at that point in time. Move your mouse left and right to replay the recording. The action is called scrubbing, and it's useful for manually analyzing the progression of the performance recording.
Bonus: Open the Frame Rendering Stats overlay
Another handy tool is the Frame Rendering Stats overlay, which provides real-time estimates for FPS as the page runs. The Frame Rendering Stats overlay is not required for this tutorial but may provide helpful insight.
In DevTools, press Ctrl+Shift+P (Windows, Linux) or Command+Shift+P (macOS) to open the Command Menu.
Start typing
Renderingin the Command Menu and click Show Rendering.In the Rendering tool, turn on Frame Rendering Stats. A new overlay appears in the top-left of your webpage.
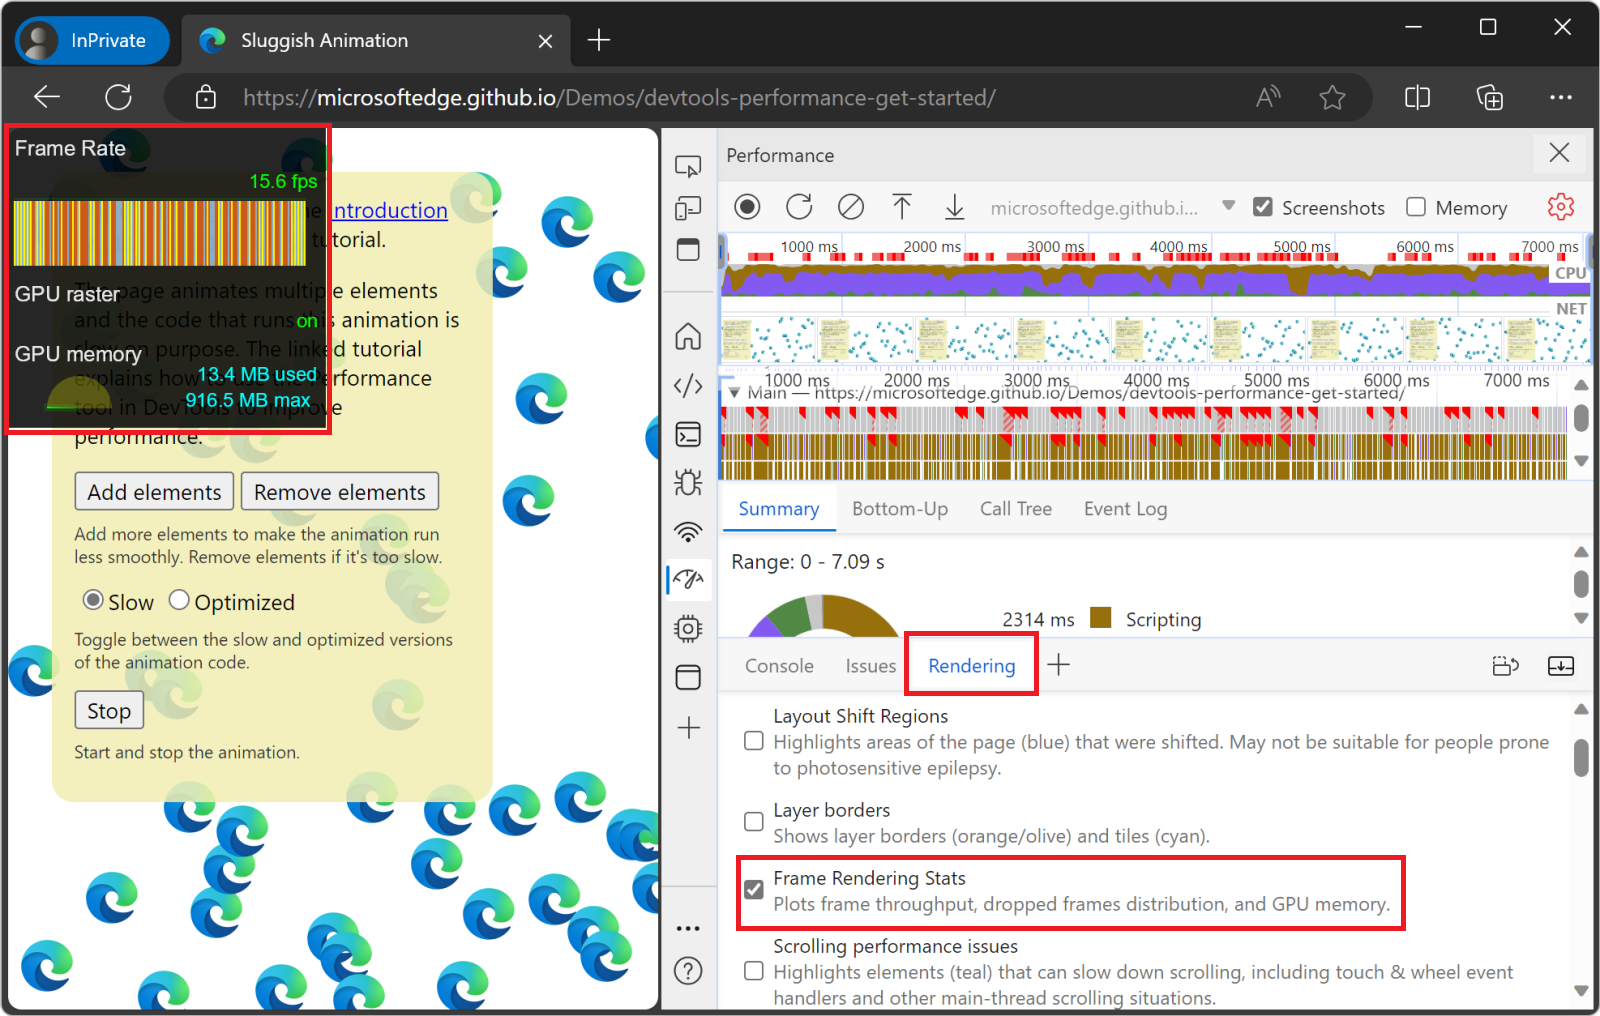
When you are done reviewing the FPS data, clear the Frame Rendering Stats checkbox to hide the overlay.
Find the bottleneck
After you verified that the animation isn't performing well, the next step is to answer the question "why?"
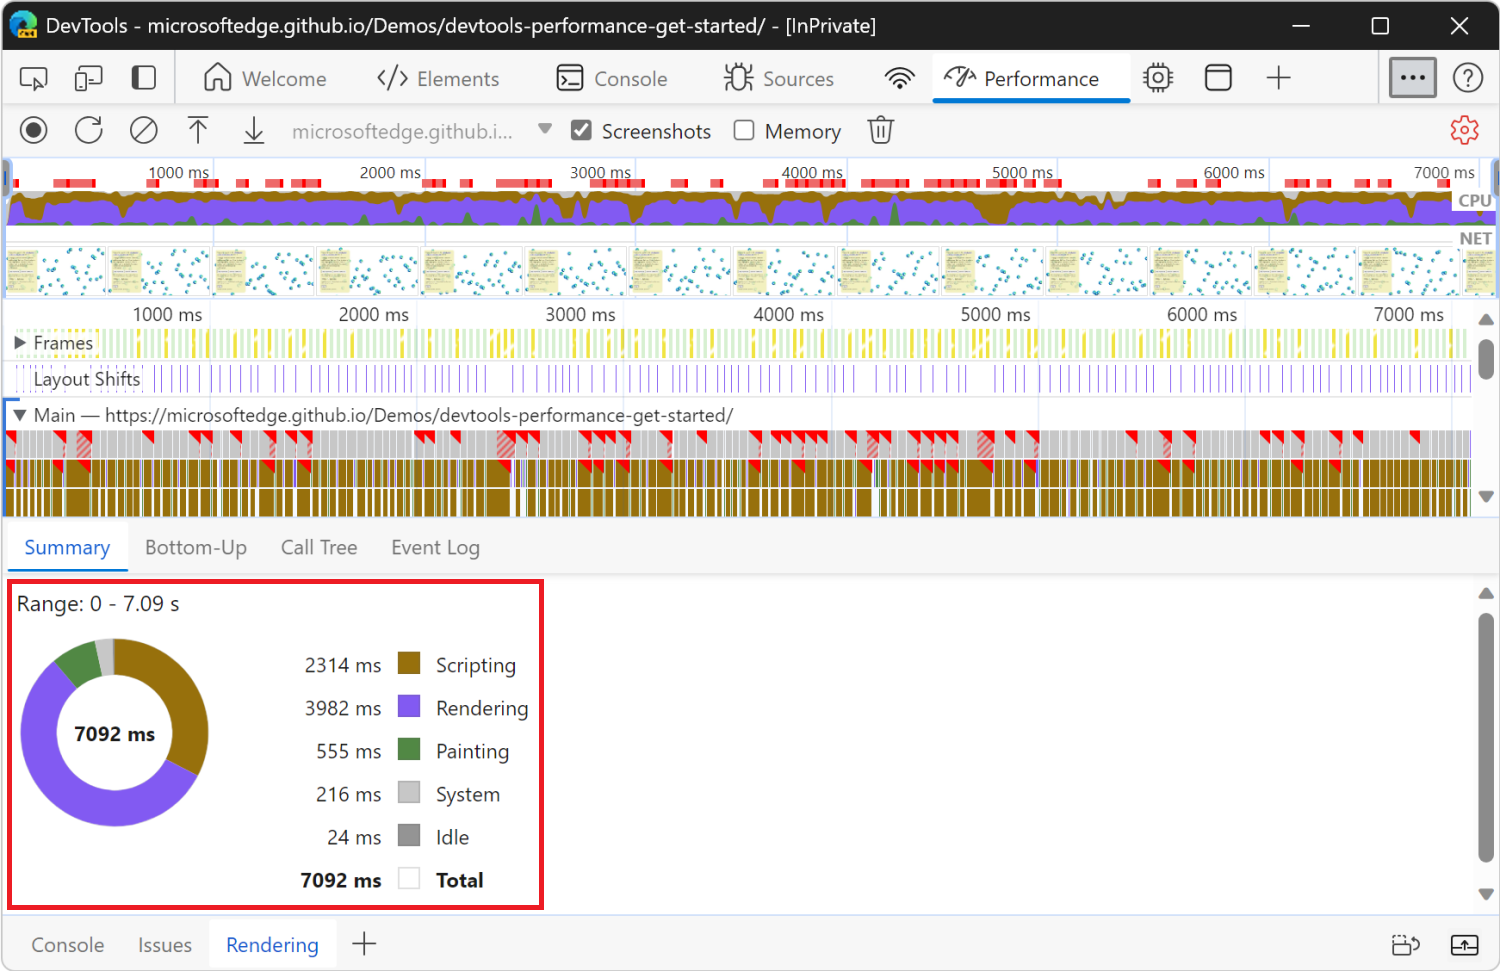
When no events are selected, the Summary panel shows you a breakdown of activity. The page spent most of the time rendering. Since performance is the art of doing less work, your goal is to reduce the amount of time spent doing rendering work.
Expand the Main section. DevTools shows you a flame chart of activity on the main thread, over time. The x-axis represents the recording, over time. Each bar represents an event. A wider bar means that event took longer. The y-axis represents the call stack. When events are stacked on top of each other, it means the upper events caused the lower events.
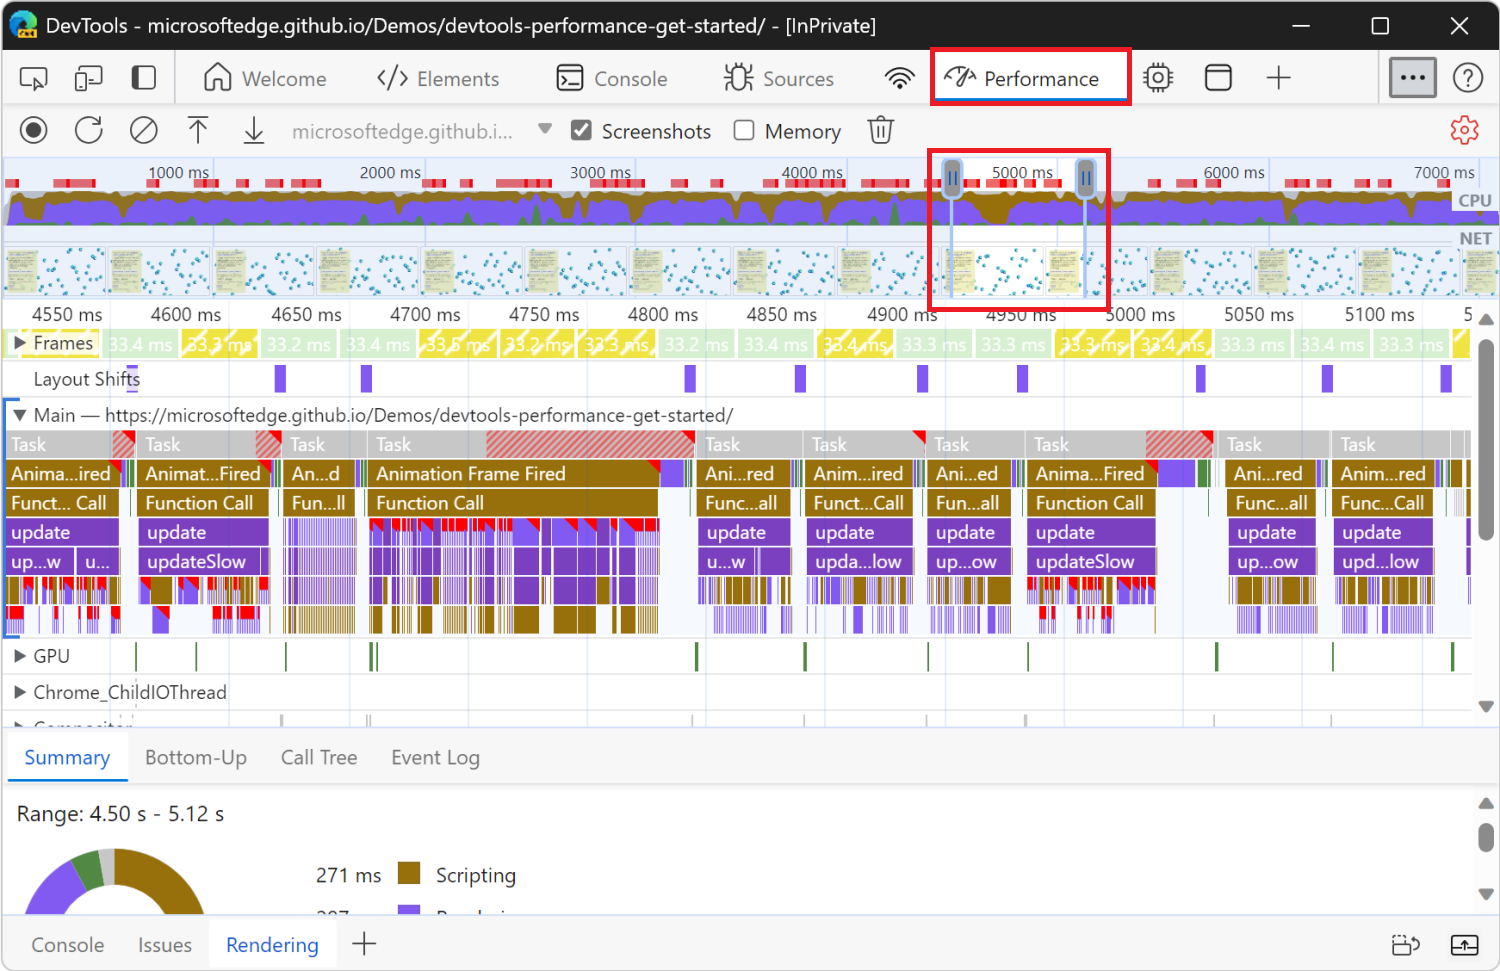
There is a lot of data in the recording. To zoom into a portion of the recording, click and drag in the Overview area toward the top of the Performance tool. The Overview area includes the CPU and NET charts (indicated on the right). The Main section and Summary panel only display information for the selected portion of the recording.
Another way to change the selected area is to put focus on the Main section, click the background or an event, and then press:
Wto zoom in,Sto zoom out.Ato move selection left,Dto move selection right.
Click an Animation Frame Fired event.
When a red triangle is displayed at the top right of an event, it's a warning that there might be an issue related to the event. The Animation Frame Fired event occurs whenever a requestAnimationFrame() callback is run.
The Summary panel displays information about that event:
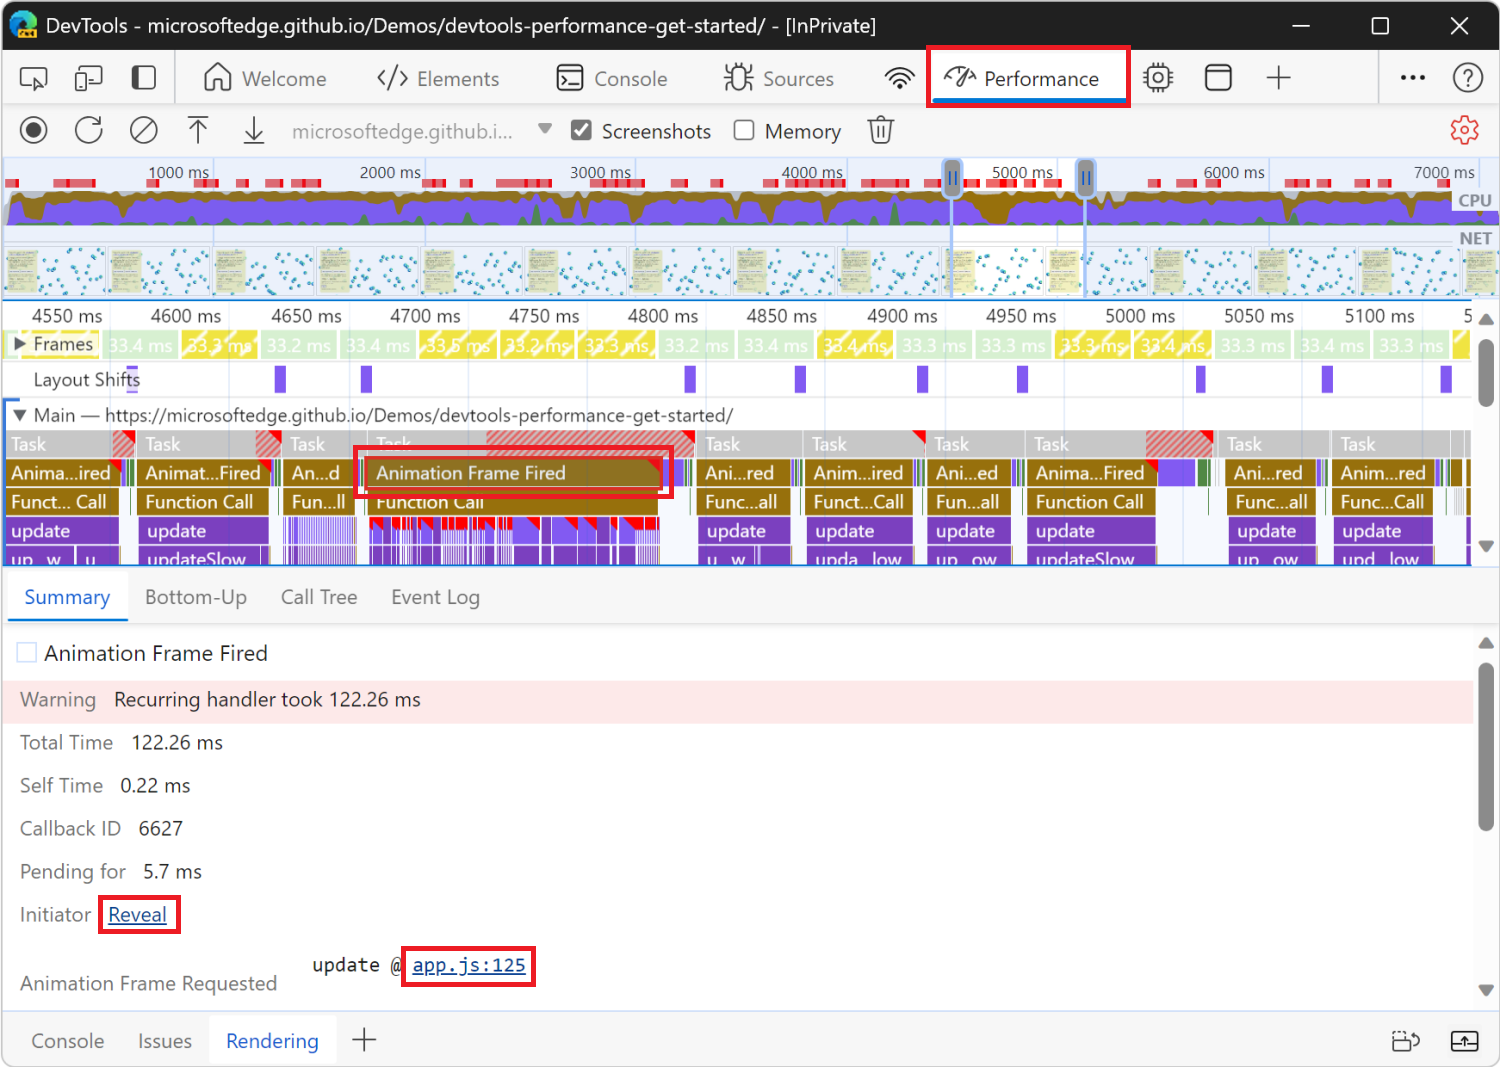
Click the Reveal link. DevTools highlights the event that initiated the Animation Frame Fired event.
Click the app.js:125 link. The relevant line of source code is displayed in the Sources tool.
Zoom in on the Animation Frame Fired event and its child events, by using the mouse wheel or trackpad. Or, press W.
You can now see the events that occur when a single frame of the animation is rendered. The update function is called, which, in turn, calls the updateSlow function, which triggers many Recalculate Style and Layout events:
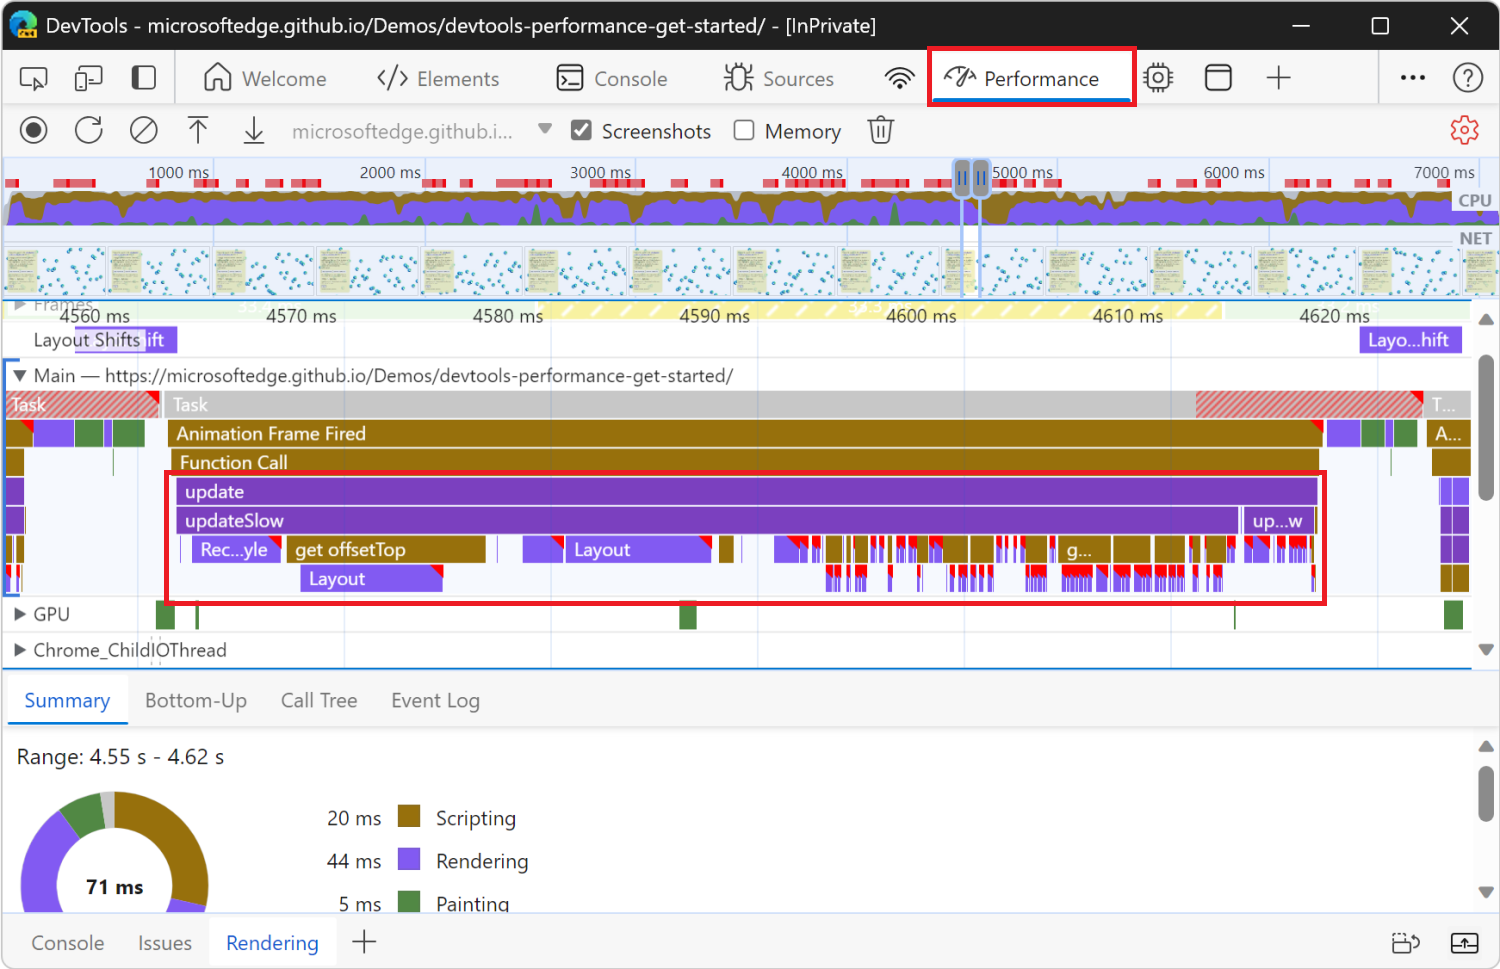
Click one of the purple Layout events. DevTools provides more information about the event in the Summary panel. There's a warning about "forced reflows" (re-layout).
In the Summary panel, click the app.js:104 link under Layout Forced. DevTools takes you to the line of code that forced the layout in the Sources tool:
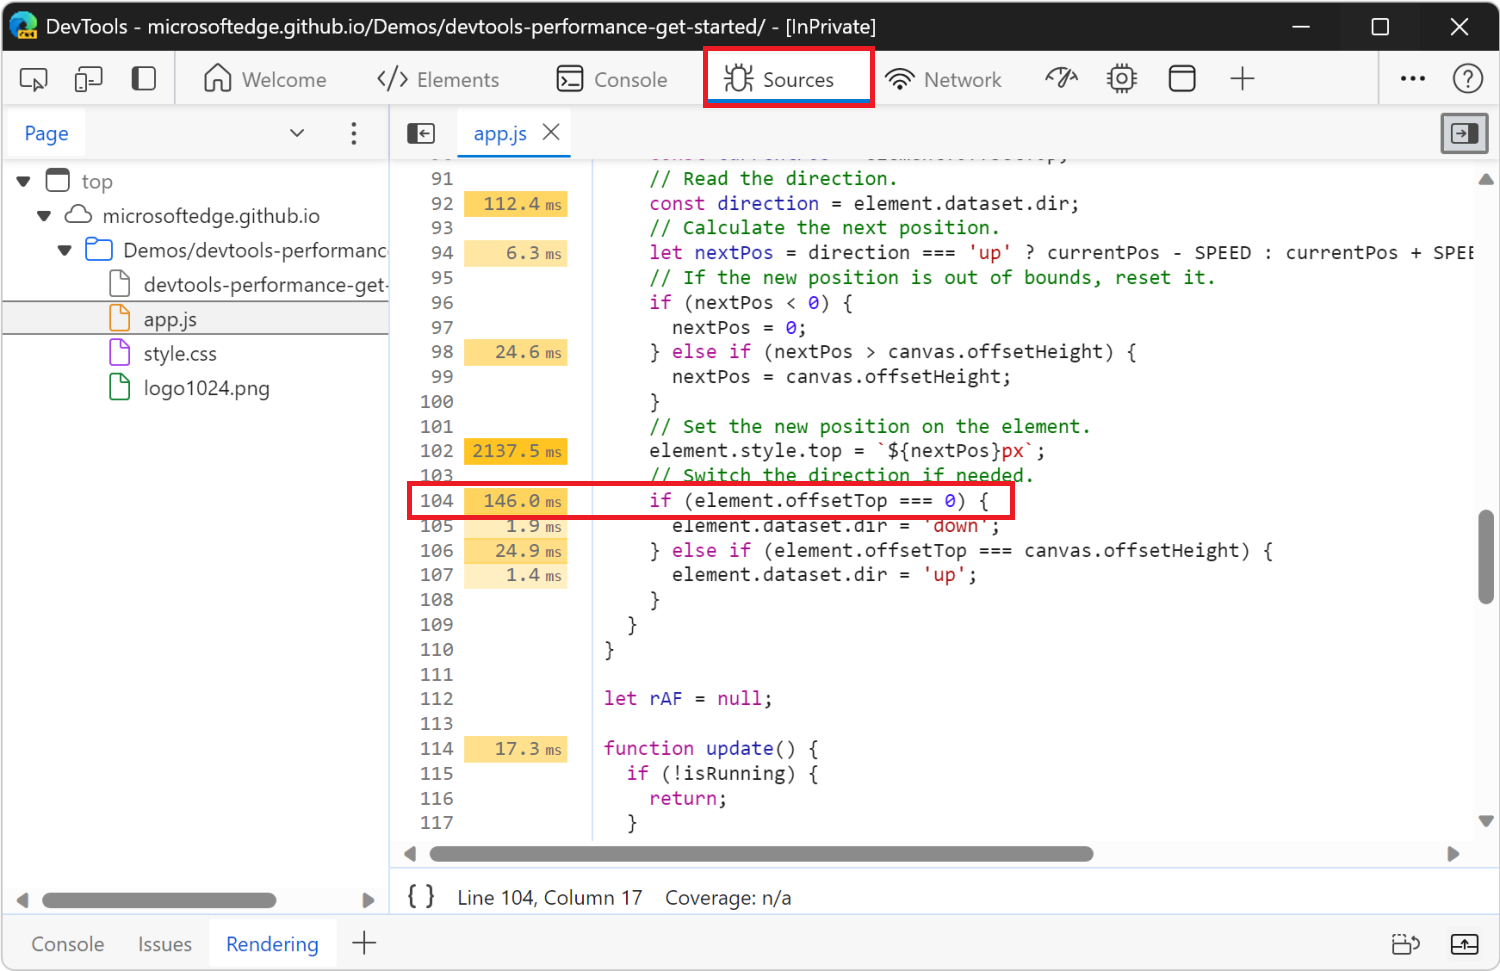
The problem with the unoptimized code is that, in each animation frame, it changes the style for each icon, and then queries the position of each icon on the page. Because the styles changed, the browser doesn't know if each icon position changed, so it has to re-layout the icon in order to compute the new position.
Analyze the optimized version
Using the workflows and tools that you just learned, click Optimized on the demo webpage to turn on the optimized code, take another performance recording, and then analyze the results. From the improved framerate to the reduction in events in the flame chart in the Main section, the optimized version of the app does much less work, resulting in better performance.
Unoptimized version
Compare this snippet of JavaScript from the unoptimized version of the app:
// Read the current position.
const currentPos = element.offsetTop;
// Read the direction.
const direction = element.dataset.dir;
// Calculate the next position.
let nextPos = direction === 'up' ? currentPos - SPEED : currentPos + SPEED;

// If the new position is out of bounds, reset it.
if (nextPos < 0) {
  nextPos = 0;
} else if (nextPos > canvas.offsetHeight) {
  nextPos = canvas.offsetHeight;
}

// Set the new position on the element.
element.style.top = `${nextPos}px`;

// Switch the direction if needed.
if (element.offsetTop === 0) {
  element.dataset.dir = 'down';
} else if (element.offsetTop === canvas.offsetHeight) {
  element.dataset.dir = 'up';
}
The above code snippet runs on every frame of the browser rendering loop, for each blue icon on the page. The element variable references a single blue icon.
In this unoptimized version, we create a nextPos variable that's set to the current position of the icon, to which we add some distance. The current position of the icon is read by using element.offsetTop.
After making sure that the icon is still within the bounds of the page, we set its new position by using element.style.top, which sets inline styles on the element.
Finally, we read element.offsetTop again, to adjust the direction of the icon.
Optimized version
The optimized code uses a different sequence of actions to do less work. Here is the same snippet of JavaScript from the optimized version of the app:
// Read the current position.
const currentPos = parseFloat(element.style.transform.match(/[0-9.]+/)[0]);
// Read the direction.
const direction = element.dataset.dir;
// Calculate the next position.
let nextPos = direction === 'up' ? currentPos - (SPEED * 100 / canvasHeight) : currentPos + (SPEED * 100 / canvasHeight);

// If the new position is out of bounds, reset it, and switch the direction.
if (nextPos < 0) {
  nextPos = 0;
  element.dataset.dir = 'down';
} else if (nextPos > 100) {
  nextPos = 100;
  element.dataset.dir = 'up';
}

// Set the new position on the element.
element.style.transform = `translateY(${nextPos}vh)`;
In the optimized version, we first set the value of the nextPos variable by reading element.style.transform instead of using element.offsetTop. Using the element's inline style is faster, because reading element.offsetTop forces the browser engine to know where all the elements are on the page, which requires the engine to recalculate the styles and the layout.
We then adjust the direction of the icon, but this time we don't read element.offsetTop again like done in the unoptimized version.
Finally, we set the new position of the icon, but this time we use element.style.transform instead of element.style.top. Using element.style.transform is faster, because the CSS transform property can be applied by the browser rendering engine without having to recalculate the layout of the page. When using the transform property, the browser considers each icon as an individual layer, and then displays these layers in the correct positions by re-compositing the final image.
To learn more, see Use transform and opacity changes for animations.
Next steps
To get more comfortable with the Performance tool, practice profiling your pages and analyzing the results.
If you have any questions about your results, in the Activity Bar, select Help (![]() ) > Feedback. Or, press Alt+Shift+I (Windows, Linux) or Option+Shift+I (macOS).
) > Feedback. Or, press Alt+Shift+I (Windows, Linux) or Option+Shift+I (macOS).
Or, file an issue on the MicrosoftEdge / DevTools repo.
In your feedback, include screenshots or links to reproducible pages, if possible.
There are many ways to improve runtime performance. This article focused on one particular animation bottleneck to give you a focused tour of the Performance tool, but it's only one of many bottlenecks you may encounter.
Note
Portions of this page are modifications based on work created and shared by Google and used according to terms described in the Creative Commons Attribution 4.0 International License. The original page is found here and is authored by Kayce Basques (Technical Writer, Chrome DevTools & Lighthouse).
![]() This work is licensed under a Creative Commons Attribution 4.0 International License.
This work is licensed under a Creative Commons Attribution 4.0 International License.
Feedback
Coming soon: Throughout 2024 we will be phasing out GitHub Issues as the feedback mechanism for content and replacing it with a new feedback system. For more information see: https://aka.ms/ContentUserFeedback.
Submit and view feedback for