Note
Access to this page requires authorization. You can try signing in or changing directories.
Access to this page requires authorization. You can try changing directories.
Important
This feature is undergoing significant improvements and until the new version becomes available the current feature is disabled.
[This topic is pre-release documentation and is subject to change.]
Performance insights are a self-service tool for enterprise app makers that analyzes runtime user data and provides a prioritized list of recommendations to help improve the performance of model-driven apps. This feature provides a daily set of analytic insights related to the performance of a Power Apps model-driven or customer engagement app, such as Dynamics 365 Sales or Dynamics 365 Service, with recommendations and actionable items. Enterprise app makers can view detailed performance insights at an app-level in the Power Apps portal.
How to access?
Sign in to Power Apps.
On the left navigation pane, select Apps, and then select a model-driven app.
Use the ... context menu or command bar to select Performance.
If you want to switch the environment where your app is deployed, you can select environments in the top-right corner of the page using the Environment selector. Alternatively, you can navigate to performance insights from a model-driven app’s context menu from the Solutions area.
Important
Since recommendations are generated using user data, we recommend that you view performance insights from an environment where the app will be used, such as a production environment.
How insights are generated
Performance insights are generated based on collected user data of your model-driven app every 24 hours. When end-users use an app, key user data recorded by the Power Apps platform is stored. The performance insights engine uses this data and analyzes it to generate insights and recommendations related to performance enhancements.
Performance insights are available for all model-driven apps in your selected environment, provided there is recorded user data. You can view insights history for the previous seven days, as long as there was usage on the selected date, by selecting a date in the list on the Performance tab.
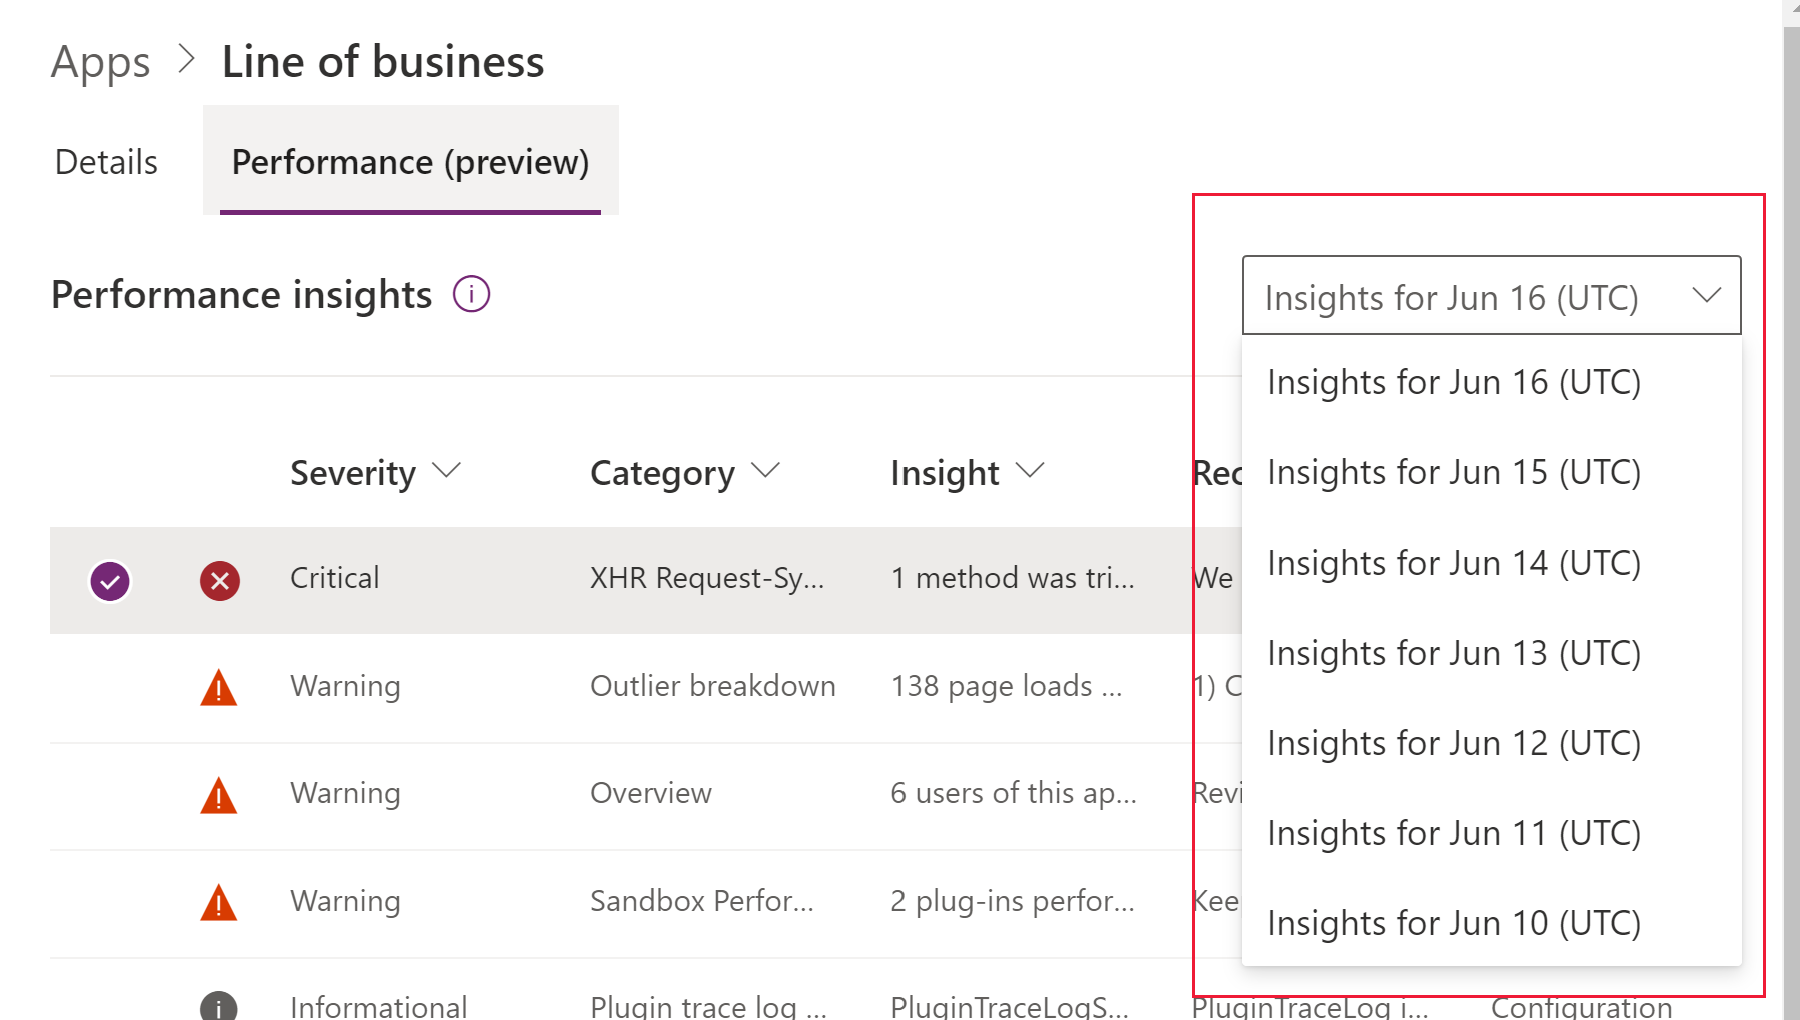
The performance insights engine generates insights over a 24-hour period on a selected date in the universal time coordinated (UTC) time zone. Insights for the previous day, from 00:00 to 23:59 UTC, are generated around 02:00 to 05:00 UTC on a given day. Therefore, insights and recommendations for usage user data recorded the previous day will be available in the morning in the UTC time zone. Time of availability will vary based on your local time zone and its difference from UTC.
For example, insights for the 24-hour period that spans June 8 from 00:00 to 23:59 UTC are generated between 02:00 to 05:00 UTC on June 9. Therefore, insights and recommendations for user data recorded on June 8 UTC will be available the morning of June 9 UTC.
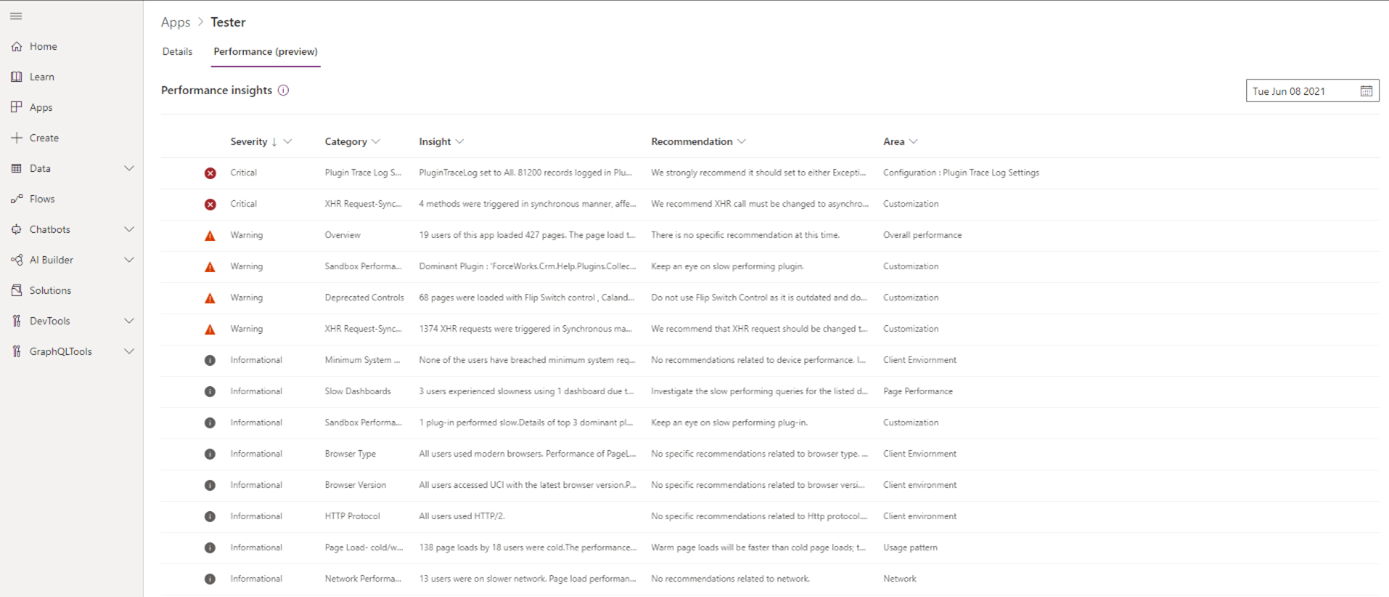
Insights can be sorted by severity – ranging from Informational, Warning, to Critical. Severity is weighted depending on the affect of the findings on the overall performance. Severity is determined by several factors such as the volume of usage, performance of slow page loads, and outliers. Critical items exceed certain thresholds and we recommend you address those first.
Insights are generated for several categories from different areas including client environment, customizations, page performance, and network. For example, if several users are using the app on an older version of a non-recommended browser, performance will be slower in general. Hence, makers will see an insight related to browser type and version in the insight grid.
Performance insights provide a prioritized list of recommendations to help makers improve the performance of model-driven apps. You can select each row in the grid to view detailed information for each category.
Explanation of performance insights
The performance insights grid has these columns.
| Column | Description |
|---|---|
| Severity | An insight can be categorized as Informational, Warning, or Critical. Severity is determined by the performance page load time and the number of end-users impacted by an event. |
| Area | This area defines the aspects of analyzing user data by the engine of Performance Insights. Includes client environment, network, and usage patterns. |
| Category | The theme under which the specific insight falls. Categories are grouped under Areas. |
| Motivation | Gives an overview of why a particular insight could be impacting the overall performance of your app. |
| Insight | Details the findings related to a specific category and outlines the performance impact. |
| Recommendation | Outlines the actions you can take. |
| How to improve | Links to the documentation for a specific category, which could contain further information or external resources to help you mitigate your issue and improve performance. |
| Data | Evidence data to support the findings in the insight section. |
| Insight ID | Identifier for a specific insight category. |
What aspects does it check?
Performance of a model-driven app could be affected by multiple factors. Horizontally, the app could be affected by client environment, network, usage pattern, customizations, and configurations. Vertically, web server or back-end SQL Server could affect performance on the client side.
Therefore, it is beneficial to identify what may cause slowness of page loads or operations. The performance insight engine analyzes collected user data and corresponds it with the categories.
In some scenarios, there could be an obvious reason for performance issues. In other cases, there may be several reasons identified from the categories that could explain the slowness.
The following table summarizes what areas and categories the performance insights engine checks.
Area
Insight category
Description
Overall performance
Overview
It provides an overall summary of the performance of a selected app. You can see the performance of app briefly. More information: Overall performance
Client environment
Minimum system requirements
Users should at least use the system meeting the minimum specifications. This insight tells makers how many users meet such criteria if user collected and others not. More information: Minimum system requirements
Client environment
Browser type
The performance will vary depending on browser type. This insight indicates whether users run a modern browser or a non-recommended Internet Explorer (IE) browser. The performance of Power Apps in IE is noticeably slower compared to modern browsers. More information: Browser type
Client environment
Browser version
Although users run the modern browsers, they could experience slow performance if they are using a browser running on an older version. In general, staying on the latest version would be recommended. More information: Browser version
Client environment
HTTP protocol
Power Apps supports the HTTP/2 protocol. Apps generally perform better with the HTTP/2 protocol compared to HTTP/1.1. One of the major limitations of HTTP/1.1 is the limited concurrent connections to the same domain, which might cause apps to run slow. More information: HTTP protocol
Network
Network performance
Network latency, throughput, and bandwidth are key factors affecting the performance of web applications. Apps can perform differently depending on network performance as some contents should be downloading. More information: Network performance
Usage pattern
Page load type.
Page load type can affect app performance. Warm (cached) page loads are faster than cold (not cached) page loads since resources load out of the cache. More information: Page load type
Page performance
Slow dashboard
One of the reasons why a dashboard might be slow to load is an associated query of a chart or a tile that is performing poorly. If the query executes over a large set of data, it could cause a slow response back. Apart from checking the number of chart controls and tiles on the dashboard, we recommend checking associated queries for both charts or tiles. More information: Slow dashboards
Customization
XHR call type
Makers can customize the model-driven app by adding a custom function making XMLHttpRequest into an event. If the XMLHttpRequest (XHR) call happens synchronously, other tasks must wait until the XHR call is completed. We strongly recommend that you make the XHR call in your custom functions asynchronous. More information: XML HTTP Request (XHR) call type
Customization
Deprecated controls
Some controls like the flip switch and calendar V1 controls are deprecated. Makers should always use modern controls. More information: Deprecated controls
Customization
Sandbox performance
Makers can build their own plug-in. Depending on implemented patterns, there are many aspects to check to confirm the plug-in methods perform well, such as timeout events. This insight checks the plug-in’s timeout to see whether it was caused by the timeout of the external endpoint calls the maker implemented or not. More information: Sandbox performance - Dominant plug-ins
Customization
Saved query
While building a solution, a maker can build, and reuse a saved query. If the saved query has been created improperly, it could make the query run slow. Consequently, any forms or views using the problematic saved query might suffer from slow performance.
Configuration
Plugin trace log setting
Administrators can enable plug-in trace logs for a Dataverse environment from None to All. It is beneficial to check the plug-in trace logs in the development phase. However, for production environments, we recommend setting the feature to either Exception or None to minimize intensive logging activity that can degrade app performance. More information: Plug-in trace log setting