Process animation overview
With process animation, you can visualize process development over time. You can watch the animation play over your process map or social graph on the Animation screen.
Adjust animation control settings
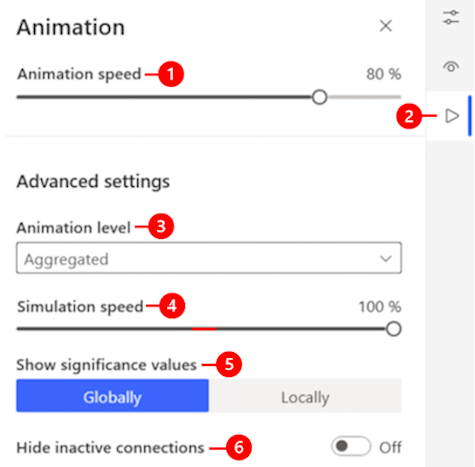
Control animation speed, advanced settings, and more on the Animation screen.
Legend:
Animation speed slider: Move the slider to adjust the animation playback speed. The information displayed in the animation frame remains unchanged.
Right arrow icon: Select to open the Animation screen.
Animation level dropdown menu: There are two options: Select Immediate to indicate that actual dynamics in the process will be shown during playback. Select Aggregated to indicate that the process dynamics aggregated in the time period around the currently monitored time point will be shown during playback.
The length of the time period used to aggregate information for the current view is part of process mining. It depends on the duration of the process and the simulation speed setting. For example, the higher the simulation speed, the longer the time period is aggregated.
Simulation speed slider: Move the slider to adjust the process simulation speed which the displayed animation information is based on. The simulation speed change has an impact on the degree of detail in the displayed process dynamics. Depending on the nature of the process in question, its duration, and the objective of the analysis, dynamics with a higher or lower degree of detail may be preferred.
Alternatively, if you have a long-lasting process and need a detailed analysis of dynamics over a shorter period, you might want to use a filter to restrict the process under analysis only to the period in question.
Show significance values: Set the mode with the color highlighting of edges and nodes in the animation. Two options: Select Globally to highlight the current value in color in chart edges and nodes compared to all values of all nodes and edges in the entire simulated process. Select Locally to highlight in color in chart edges and nodes compared to the current values of all nodes and edges in the simulated process.
To learn more, go to Display the significance of values.
Hide inactive connections: Turn On or Off to show or hide the connections that aren't currently active. Hiding inactive connections makes the animation less cluttered.
Use the playback control
The animation playback control is located in the bottom part of the screen. Use it to start the animation, pause it, or skip to any position in the process.
The information about the actual time in the process appears to the right of Play animation.

To play the animation, select Play animation. As the automation plays, the node numbers and edge colors on your process simulation change. To learn more, go to Functions of animation elements.
When you select Play animation, the button turns into Pause automation.
To temporarily stop the automation from playing, select Pause automation.
Feedback
Coming soon: Throughout 2024 we will be phasing out GitHub Issues as the feedback mechanism for content and replacing it with a new feedback system. For more information see: https://aka.ms/ContentUserFeedback.
Submit and view feedback for