Compare process views for compliance
Comparison of the processes allows an intuitive and efficient comparison of processes. You can compare the processes at the level of the process map, where the generated visualization allows you to identify the differences in the flow and frequency, or time metrics.
You can also change the complexity of the map, zoom, or nodes offset in the Customize and Visualize icons on the far right.
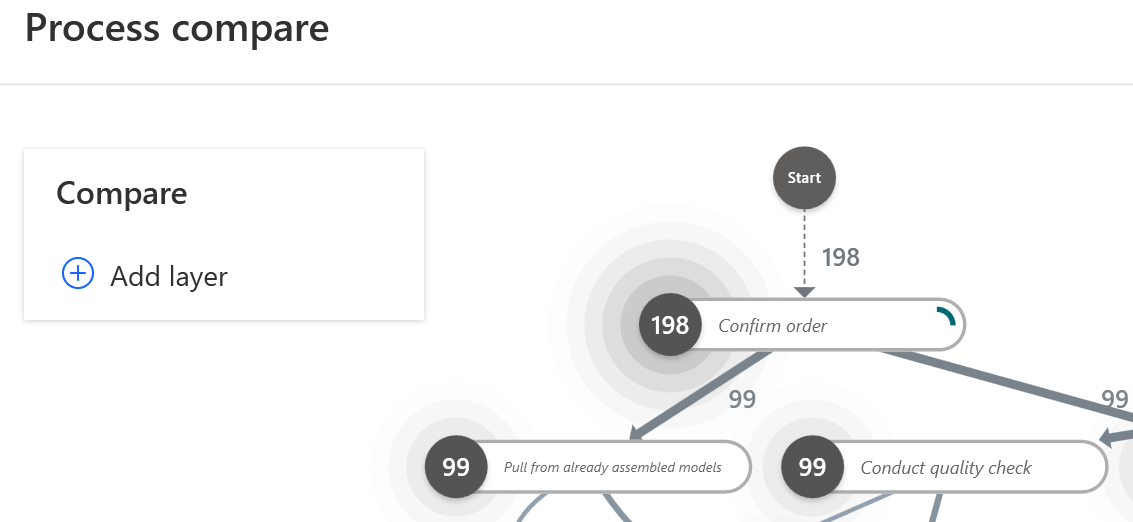
You can compare in detail values of metrics and attributes at the level of activities and edges. You can also compare the views of various processes or different views generated from a single process (for example, for different periods of time) by selecting a process in the Compare box.
Add views
A view, from which the functionality was displayed, is the basis for comparison. All added views as layers are constantly compared to the view you're currently working on.
To add a layer:
On the Compare box, select Add layer.
In the Views dropdown menu, select a process.
(If your process is in a blueprint format) Select BPMN and then select a properly formatted BPMN diagram. The BPMN diagram will be transformed and compared to the currently open view.
Changing the view
List of all available layers is shown in the Compare box. The individual layers can be switched on and off by checking or unchecking them. The currently open view and the Compare layer are switched on by default. Unchecking the currently open view will highlight those activities and transitions which are common in both compared layers. Select (-) to remove the layer from the list.
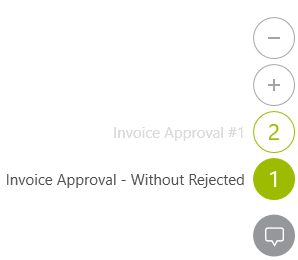
Each layer/view has an associated color. Activities and edges that form an intersection of the compared layers/views are colored as the Compare key.
Feedback
Coming soon: Throughout 2024 we will be phasing out GitHub Issues as the feedback mechanism for content and replacing it with a new feedback system. For more information see: https://aka.ms/ContentUserFeedback.
Submit and view feedback for