Rework metrics
Rework metrics represent a layer of data analysis with a focus on identifying various kinds of repetitions found in a process. Rework information is covered in the Statistics screen and can be visualized on the process map for better understanding the root cause of each repetition and its overall impact. Reducing repetitions is crucial for improving the efficiency of the process as well as reducing costs.
The following sections list the types of rework metrics.
Self-loop
Self-loop represents a specific repetition where an activity is directly followed by the same activity. In terms of edges and transitions, the starting and ending activity of edge is the same.
Example of self-loop
The activity called BP Transfer repeats itself nine (9) times. There are zero values over all the other activities and edges because no other activities are involved in this type of repetition.
Loop
Loop represents specific repetition where an activity is followed by the same activity, but not directly. For example, at least one additional activity is always involved.
Example of loop
Activities SetDeliveryDate and Approve are repeated seven (7) times. The edge between these two activities is also repeated seven (7) times. Keep in mind that in a process map, an activity might be repeated, but each time a different edge or transition can be used. The loop count value for a non-repeated edge is zero, regardless of the loop count for the starting or ending activity of the edge.
Rework
Rework count represents the sum of all self-loops and loops.
Example of rework
The number of self-loops of the activity BP Transfer displays with the number of loops of the activities SetDeliveryDate and Approve. If any of the activities contained both self-loops and loops, their numbers would add up.
Loop inflow
Loop inflow represents the repetitions of an activity's predecessors.
Example of loop inflow
In this example, the activity SetDeliveryDate has been repeated seven (7) times, so the loop inflow for the activity Approve is also seven (7), as SetDeliveryDate is the only predecessor of Approve.
As the activity SetDeliveryDate has been preceded by non-repeated activities, its loop inflow value is zero, regardless of the number of repetitions of itself. However, the edge between SetDeliveryDate and Approve has a non-zero value as the starting activity was repeated.
Loop outflow
Loop outflow represents the repetitions of an activity's successors.
Example of loop outflow
The activity Approve has the value of zero, none of the successor activities was repeated. SetDeliveryDate shows value 7, as activity's Approve loop count equals 7. The edge between SetDeliveryDate and Approve shows value 7, as the ending edge activity Approve has been repeated 7 times.
Net loop gain
This activity metric represents the difference between Loop outflow and Loop inflow. If the value is positive, the activity is directly followed by more repeated activities than it was preceded. Such activities start new loops in processes. If the value is negative, the activity is directly followed by less repeated activities than it was preceded. Such activities end, close, or exit loops in processes. The halo effect color also helps us see positive and negative trends in the process - red color represents a problem (start of new loops); the blue color represents a favorable change (end of loops).
Example of net loop gain
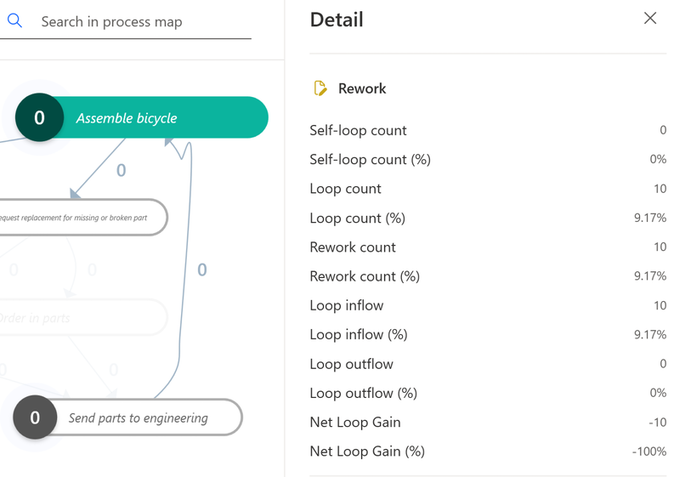
SetDeliveryDate is followed by repeated activity Approve while it has no repeated predecessors (value 0). The activity is thus involved in the creation of seven (7) new loops (value 7). Activity Approve is not followed by a repeated activity (value 0), but its predecessors are repeated seven (7) times. The activity Approve is thus involved in closing seven (7) loops (value -7).
Rework metrics - process map
In rework metrics, the map displays information representing the volume of repetitions for activities and edges the process involves.
To display the rework information:
On the panel on the right, select Customize (the top icon).
On the Customize toolbar, select Rework.
You can select if one metric is used both for activities and edges, or each metric is set separately. To switch between count and percentage for each metric, select %.
The list of metrics is the same for both activities and edges, with one exception. Metric Net Loop Gain is available only for activities.
By selecting an activity or edge, you can display rework details about the particular object. The percentage represents the proportion of the individual types of reworks to the overall number of instances.
Rework metrics - statistics
In the Statistics screen, the rework information is available for Case overview, Activities, Edge statistics, Resources, and all event-level attribute statistics.
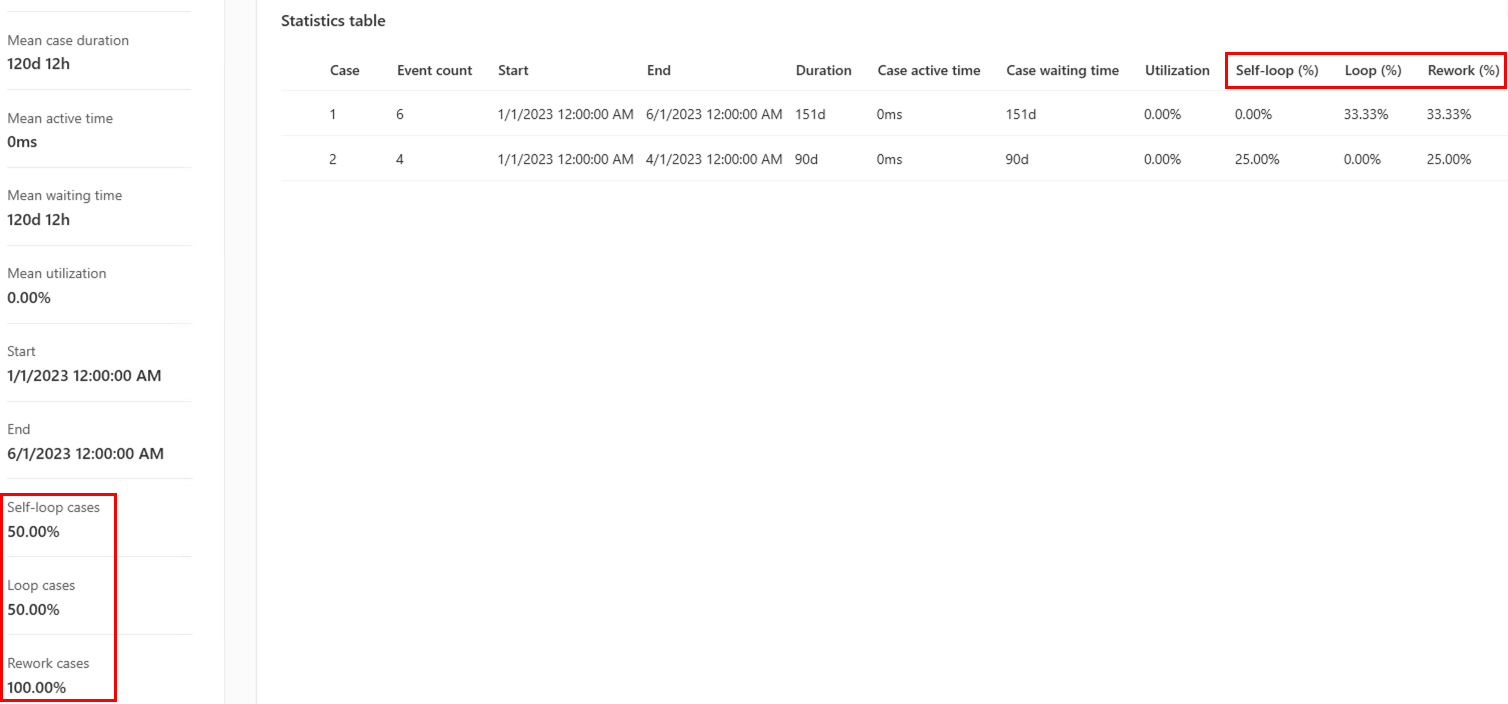
The rework columns are located at the far-right end of the table and the information can be also displayed in the chart. The percentage is calculated from the Event frequency value. In Case overview, it's calculated from the Event count.
Information about reworks is also present in the overview panel. The percentage shows the proportion of the displayed rows that contain self-loops, loops, and reworks. In the following example, one out of two cases contains a self-loop so the overview panel shows 50% average self-loop. Similarly, one out of the two contains a loop. This is why the average loop shows 50%. This means that both cases contain a rework, so the average rework shows 100%.
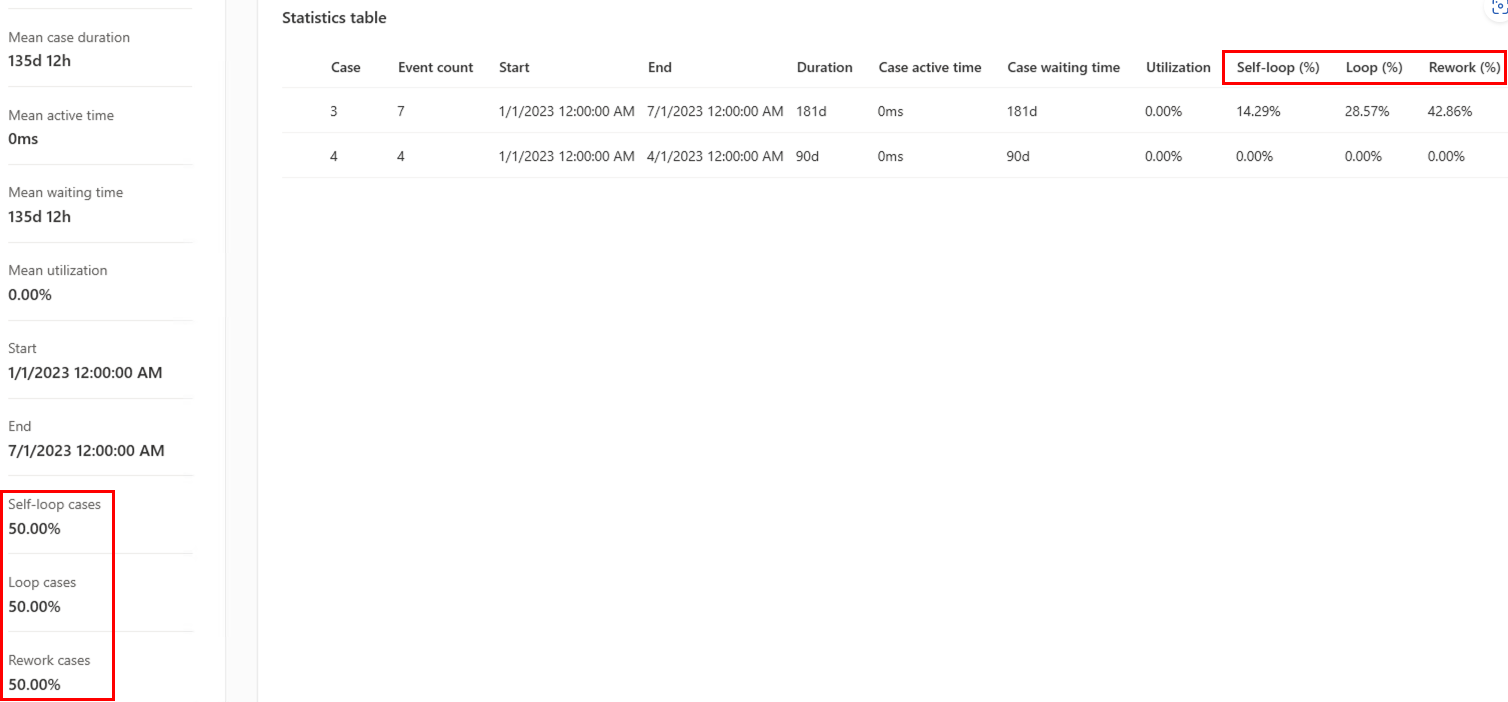
In this example, one case contains one self-loop and one loop. The other one doesn't contain any reworks. That means the average self-loop, average loop, and average rework fields in the overview panel are 50% because only one of the two cases contain them.
Rework metrics - filters
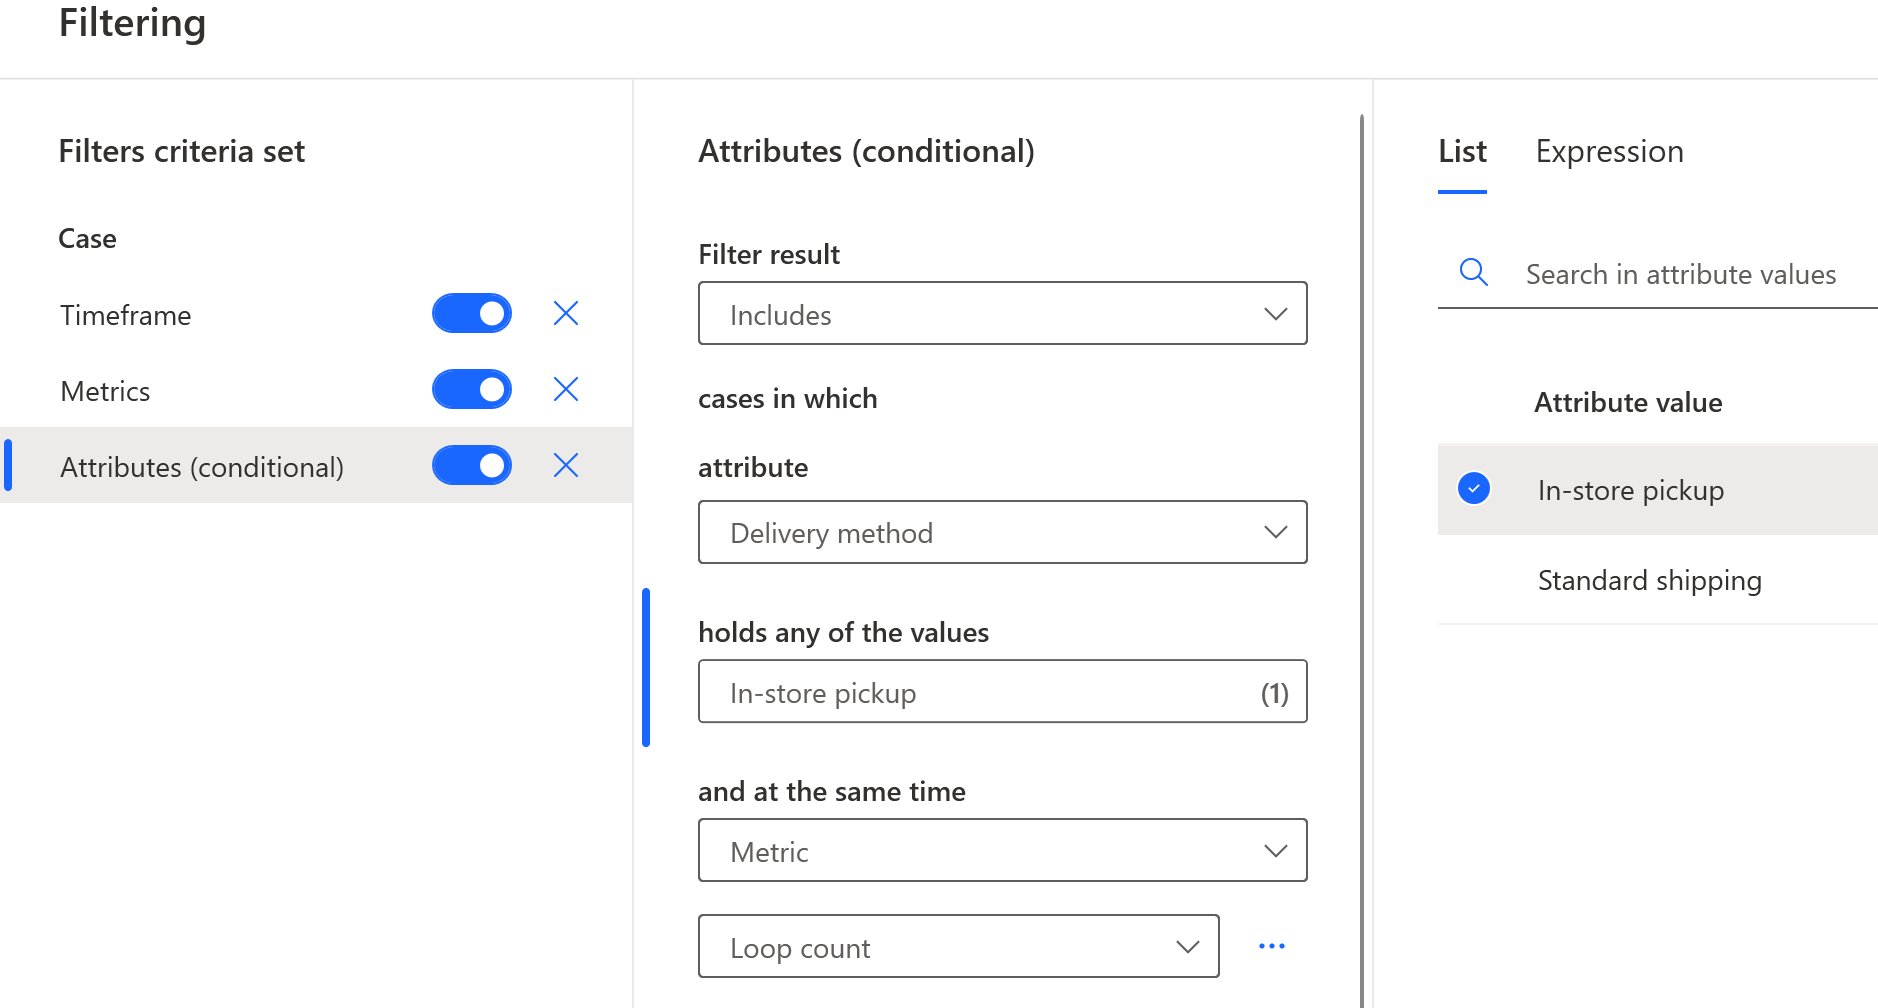
The Metrics filter supports filtering per case according to the amount of self-loops, loops, and reworks.
Filters Attributes (conditional) and Edge (conditional) allow using rework metrics filter per event.
See also
Feedback
Coming soon: Throughout 2024 we will be phasing out GitHub Issues as the feedback mechanism for content and replacing it with a new feedback system. For more information see: https://aka.ms/ContentUserFeedback.
Submit and view feedback for