Events
Power BI DataViz World Championships
14 Feb, 16 - 31 Mar, 16
With 4 chances to enter, you could win a conference package and make it to the LIVE Grand Finale in Las Vegas
Learn moreThis browser is no longer supported.
Upgrade to Microsoft Edge to take advantage of the latest features, security updates, and technical support.
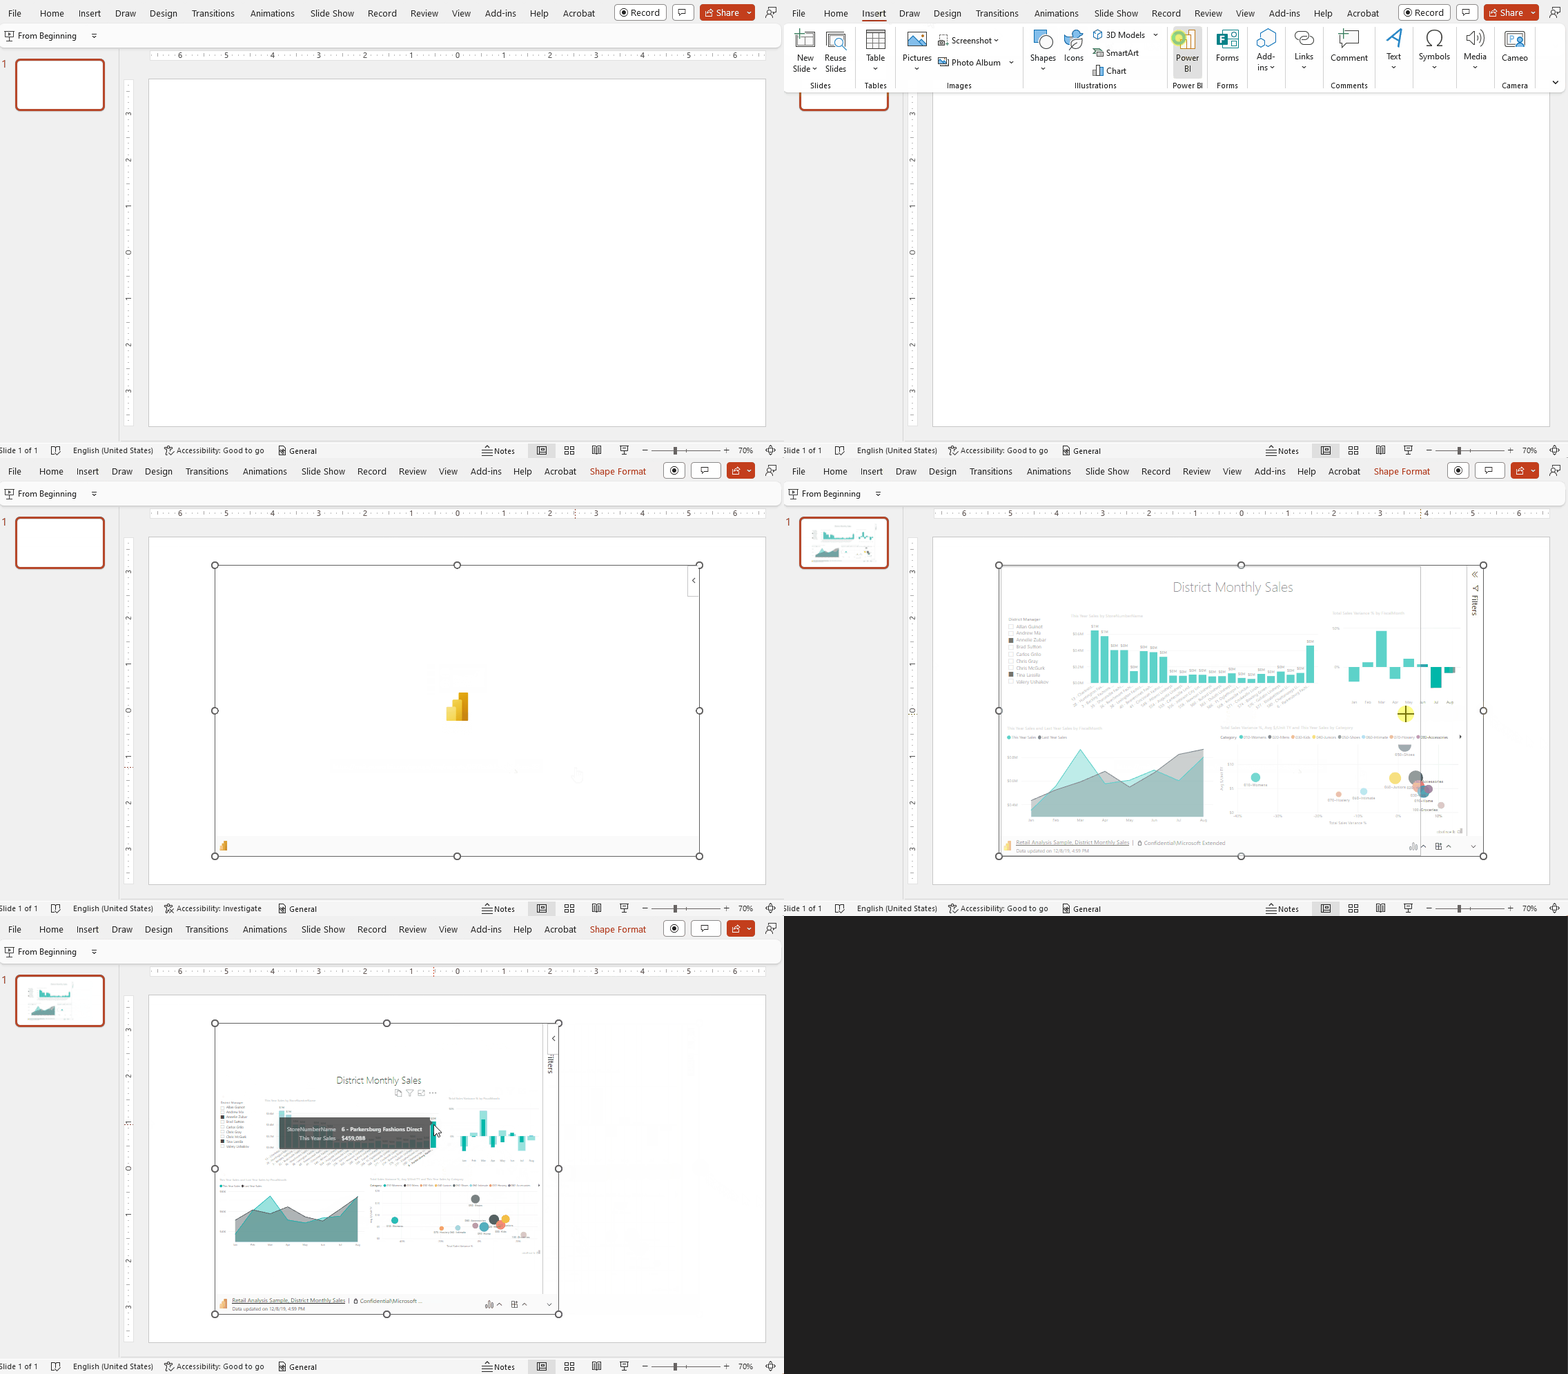
With the Power BI add-in for PowerPoint, you can enhance your data storytelling in PowerPoint with live, interactive Power BI data. Not only will the data shown in your presentations be always up to date, but also, while you're presenting, you'll be able to filter and drill down on data in response to questions and feedback from your audience without having to switch contexts.

The add-in currently supports adding individual report pages and individual visuals to PowerPoint slides.
You can add report pages or visuals to PowerPoint presentations starting from either PowerPoint or Power BI. For Power BI to be used as the starting point, Power BI storytelling functionality must be enabled in your organization.
To start adding live Power BI data to your presentations, see Add live Power BI data to PowerPoint.
To use the Power BI add-in for PowerPoint, you must have access to the Office add-in store, or the add-in must be available to you as an admin managed add-in.
To be able to view live Power BI data in PowerPoint, you must have an active Power BI account and a Fabric Free license, and access to the data. If the Power BI report isn't located in a Premium capacity or Fabric F64 or greater capacity, a Power BI Pro license is needed.
The Power BI add-in for PowerPoint requires Office version 2312 (Build 17126) or higher.
Power BI data added to PowerPoint using the Power BI add-in remains in Power BI. No data is exported from Power BI. As such, the data respects all Power BI permissions and data security, including row-level security (RLS), so your data remains secure.
If you're a Power BI administrator, see Information for Power BI administrators for further details about the add-in.
Events
Power BI DataViz World Championships
14 Feb, 16 - 31 Mar, 16
With 4 chances to enter, you could win a conference package and make it to the LIVE Grand Finale in Las Vegas
Learn moreTraining
Learning path
Create and use analytics reports with Power BI - Training
Learn to use and build business intelligence reports in Power BI.
Certification
Microsoft Certified: Power BI Data Analyst Associate - Certifications
Demonstrate methods and best practices that align with business and technical requirements for modeling, visualizing, and analyzing data with Microsoft Power BI.