
Events
Power BI DataViz World Championships
14 Feb, 16 - 31 Mar, 16
With 4 chances to enter, you could win a conference package and make it to the LIVE Grand Finale in Las Vegas
Learn moreThis browser is no longer supported.
Upgrade to Microsoft Edge to take advantage of the latest features, security updates, and technical support.
APPLIES TO: ![]() Power BI Desktop
Power BI Desktop ![]() Power BI service
Power BI service
You can add text boxes, shapes, and smart narrative visuals to reports in Power BI Desktop or the Power BI service. The smart narrative visual uses artificial intelligence to provide a text summary of your visuals and reports.
To add texts and shapes to a report, you must have permission to edit the report.
This procedure uses the Retail Analysis sample available in the Power BI service.
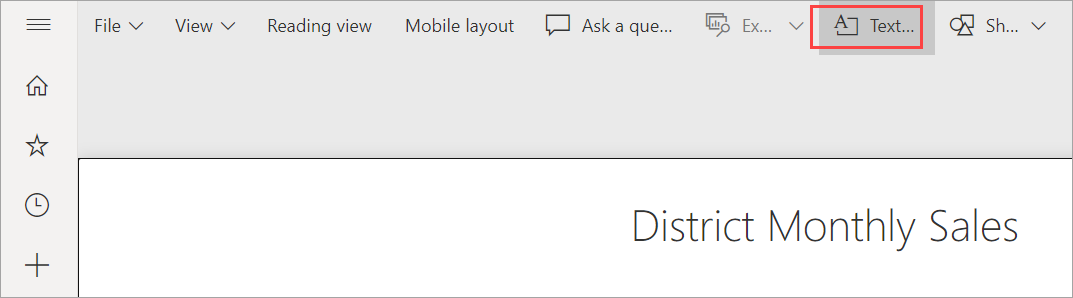
In Power BI Desktop, go to the Home tab. In the Insert section, select Text box.
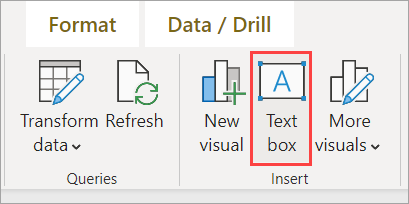
The Text box option is also available on the Insert tab.
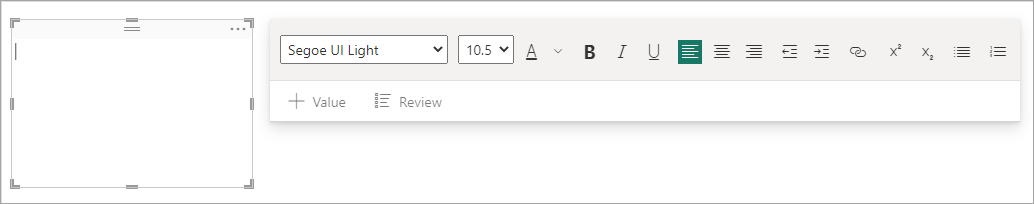
Power BI places an empty text box on the canvas. To position the text box, select the grey area at the top and drag to your desired location. To resize the text box, select and drag any of the sizing handles.
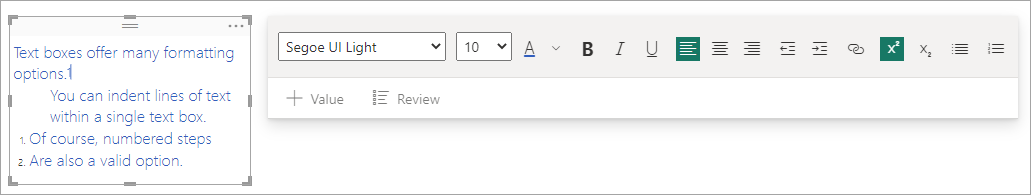
Type your text into the text box. You can then set the format font style. Font styles include color, size, and subscript or superscript, and text alignment, including indents and bulleted lists.
With the text box still selected, add other formatting in the Format text box pane. In this example, the text has a theme color, and added bullets and superscript. You can also specify an exact size and position for a text box.
When you finish editing the text box, select any blank space on the report canvas.
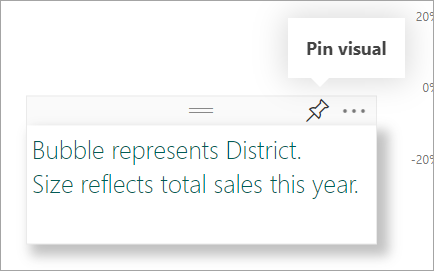
In the Power BI service, you can also pin a text box to a dashboard. Select the pin icon, then select the dashboard where you want to pin it.
You can add shapes to Power BI reports with various formatting options and styling. You can also upgrade old shapes in your reports.
In Power BI Desktop, go to the Insert tab. In the Elements section, select Shapes.

From the dropdown menu, select a shape to add it to your report canvas. Then, in the Format pane, you can customize the shape to suit your needs. For this example, the arrow is rotated 45 degrees and formatted to include text and a shadow.
![]()
To position the shape, select the grey area at the top and drag to the desired location. To resize the shape, select and drag any of the sizing handles. As with the text box, you can also create an exact size and position for a shape.
Note
Shapes cannot be pinned to a dashboard, except as one of the visuals when you pin a live page.
You can also add a smart narrative to your report. The smart narrative visualization uses artificial intelligence to provide a text summary of your visuals and reports. It provides relevant insights that you can customize.
In the Visualizations pane, select the Smart narrative icon. If you don't see it, you may need to turn on the preview.
![]()
Power BI creates a text box with autogenerated text describing interesting features of the data in your report.
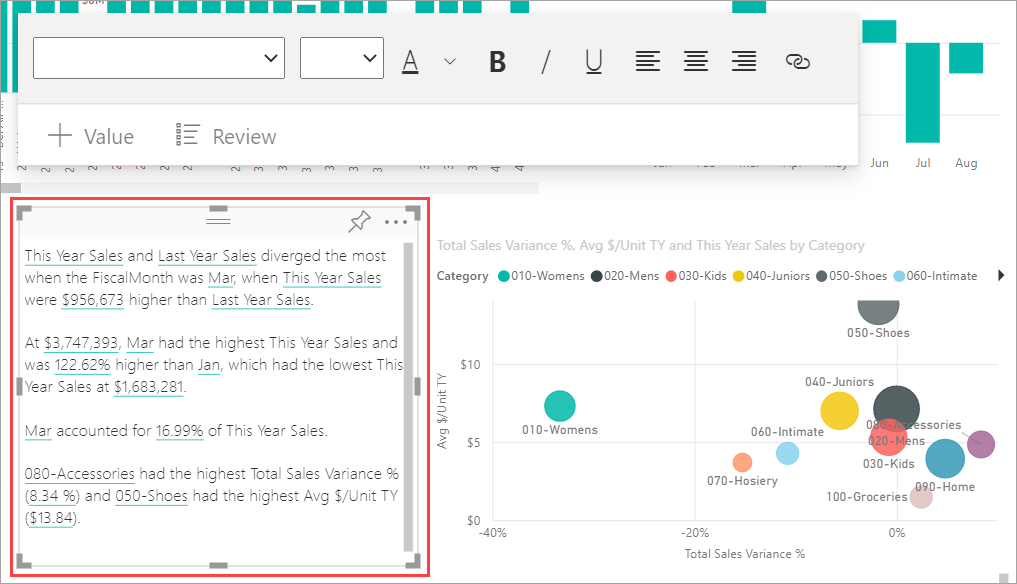
You can format it as you would any other text box. The smart narrative underlines values found in the data.
Read more about smart narratives.
For more information, see:
Events
Power BI DataViz World Championships
14 Feb, 16 - 31 Mar, 16
With 4 chances to enter, you could win a conference package and make it to the LIVE Grand Finale in Las Vegas
Learn moreTraining
Module
Data visualization and reports in Power BI - Online workshop - Training
Work through exercises to learn about data visualization and reports in Power BI.
Certification
Microsoft Certified: Power BI Data Analyst Associate - Certifications
Demonstrate methods and best practices that align with business and technical requirements for modeling, visualizing, and analyzing data with Microsoft Power BI.
Documentation
Use gridlines and snap-to-grid in Power BI reports - Power BI
Learn how to use gridlines, snap-to-grid, smart guides, z-order, alignment, and distribution in Power BI reports.
Apply conditional table formatting in Power BI - Power BI
Learn how to apply customized conditional formatting to tables and matrixes in Power BI, including color gradients, data bars, KPI icons, and web links.
Table visualizations in Power BI reports and dashboards - Power BI
Learn how to work with table visualizations in Power BI reports and dashboards, including how to resize column widths.