Create paginated reports that you can export in the Power BI service
APPLIES TO: ![]() Power BI service
Power BI service ![]() Power BI Report Builder
Power BI Report Builder ![]() Power BI Desktop
Power BI Desktop
In this article, you learn how to create a paginated report with all the data from your Power BI semantic model, and then export it. The feature lets you quickly create a paginated report on the web, and apply styling. You can then export it using the rich export functionality of paginated reports, which retains the applied formatting & styling.
You can use the feature to create paginated reports in any workspace in the Power BI service, including workspaces that aren't in a Power BI Premium capacity.
Prerequisites
See the Prerequisites section in Get started creating paginated reports in the Power BI service.
Get started
See the article Get started creating paginated reports in the Power BI service for all the ways you can get started creating paginated reports in the Power BI service.
No matter which way you start, the new paginated report online editing experience opens.
Create a table
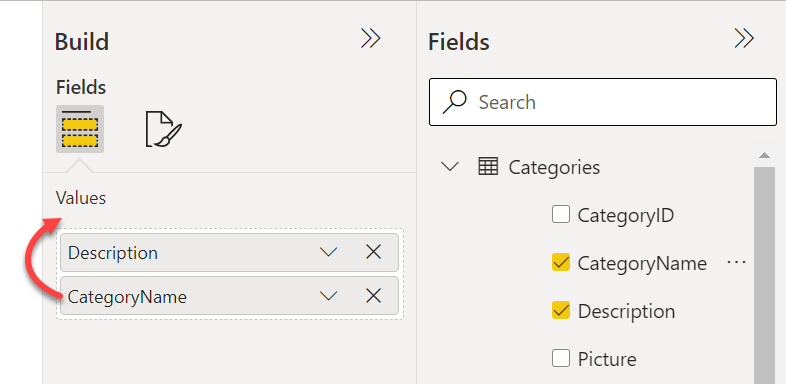
To create your first table, select field names in the Data pane on the right. This pane gives you a table-and-column based view of the chosen dataset. When you find a column that you wish to add to your table, select the column or drag it to Values section of the Build pane.
Give the editor a few moments to run a new query on the dataset. The formatted table shows up in the paginated report viewer to the left side of the page.
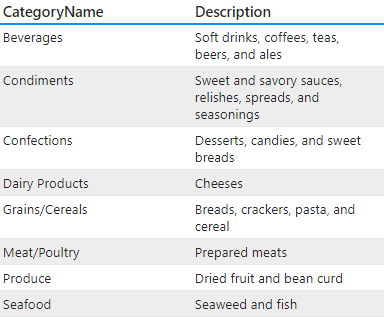
This viewer shows you a preview of your currently unsaved paginated report. Use this pane to make sure everything in your report looks good before editing or saving the report.
If columns are in the wrong order in the Build pane, don't worry. You can easily reorder the columns in the Build pane columns by dragging the columns into the desired order.
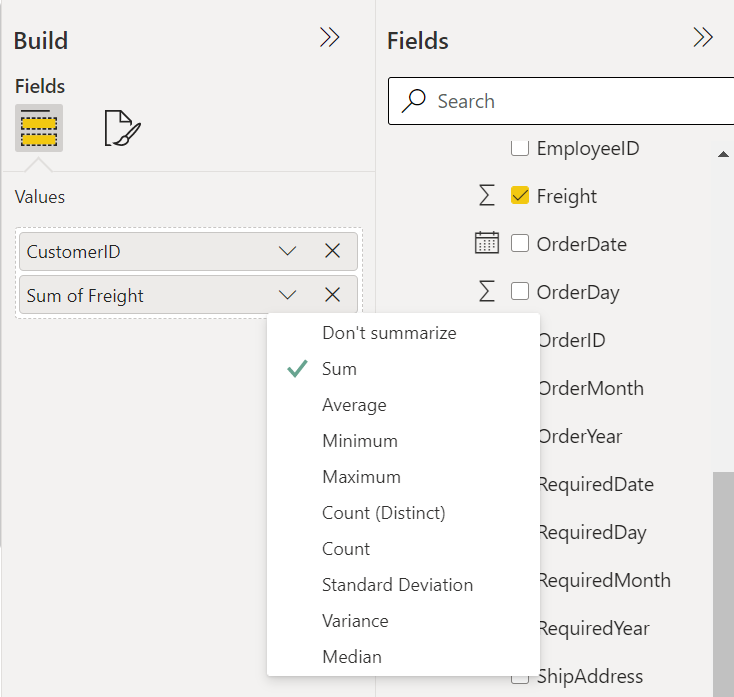
When you select a field, we use the default aggregate set on the field. You can change the aggregate behavior. Select the arrow next to the field item in the Build pane.
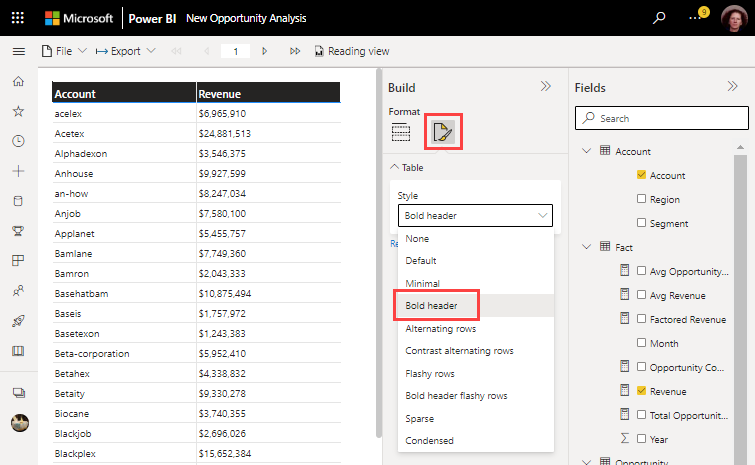
Format the table
Now that you have the columns that you want, you can format the table using the built-in format options.
In the Build pane, select the Format tab.
Select the drop-down arrow in the Style box, and experiment with the available styles.
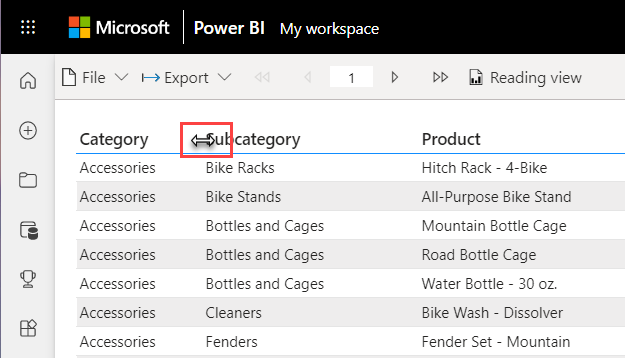
To resize the width of the columns, hover over the edge of a column header, and drag the double-headed arrow that appears.
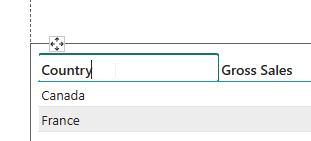
To edit the text in a column header select the header you would like to edit and make your changes.
To sort the table on a column, select the sort icon in the column header.

After you sort it, you see the arrow icon showing the direction of the sort on the column.


Note
To revert to using the original column header based on your data source, remove and add the field again in the Data pane.
When you export to CSV, it doesn't reflect the renamed column name. To learn more, see data renderer formats.
Edit a paginated report
If you navigate to any paginated report that you've authored online, you have the option to edit the report within the paginated report viewer experience. This option is available in the toolbar above the viewer.
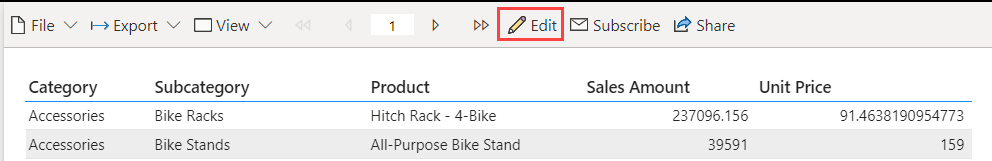
This option takes you back to the online editor experience, where you can make changes to the report.
Note
This Edit button isn't the same as the Edit button on the File menu. That Edit button opens Power BI Report Builder instead. If you edit this report in Report Builder, you can't edit it online anymore.
Add images to the paginated report
For any paginated report that you author online, you can insert images in the top section of your report to brand or describe your formatted table data.
Add an image item
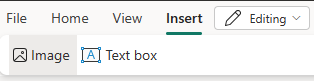
To add an image to your report, select Insert, then Image.
Note
At this time, you can only insert external images that are available over the internet without needing authentication.
Images are inserted at the top of the first page of your report.
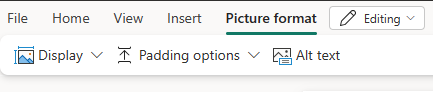
After you insert the image, you can use the Picture format tab to set an Alternate text for the image, set padding options, or set the display size option.
To learn more about external images, refer to Add external images to paginated reports.
Add text to the paginated report
For any paginated report you author online, you can insert text boxes in the top section of your report to brand, title, or describe your formatted table data below.
Add a text box and begin typing
To add a text box to your report, select Insert and then Text box.
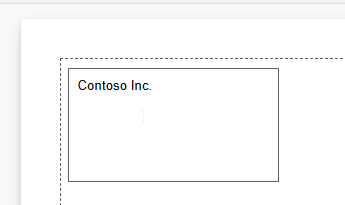
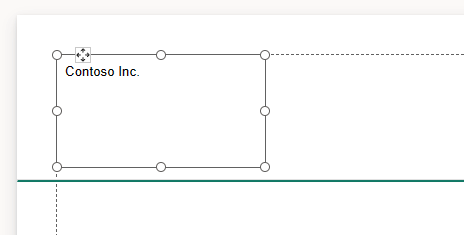
Text boxes are inserted at the top left of the first page of your report.
Note
When you insert a new text box or select a text box, you're immediately editing the text in the text box.
Begin typing within the text box.
Select, move, and resize text boxes
To select a text box, hover over a text box and a text box outline appears, select within the text box area to select the text box you are hovered over.
To move a selected text box, select and drag the move indicator on the text box outline.
Note
Alternatively, select the text box itself, not the text in it, by pressing ESC. And then use the arrow keys to move a selected text box horizontally or vertically.
To resize a text box, select the text box itself and then select and drag any sizing handle. Alternatively, press the SHIFT + arrow keys to resize horizontally or vertically.
Note
Text that doesn't fit within the text box area shows only while the text box is selected. Text outside the text box area doesn't show in the final design of your report. Resize the text box area to show the text you would like visible.
Format and style text in a text box
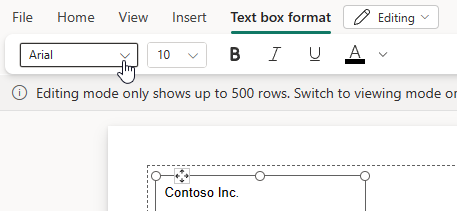
After you select a text box, the Text box format tab is displayed. From this tab you can format the font style, including font, color, size, and text decoration like bold, italics, and underline.
You can format font styles at the character and line level while you're editing the text box. Or select the text box to highlight all text and format all text within the text box at once.
Delete a text box
To delete a text box, right-click a text box and select Remove. Alternatively, with a text box selected press DELETE.
Working with sections
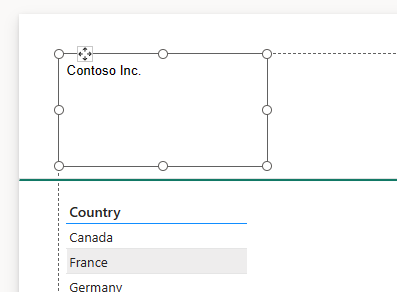
When you add items to a paginated report, a section line appears on the first page that separates the text or image objects from your formatted table of data. The area above the section line is where items are added. The area below is where your formatted table of data is added.
Note
The section line only shows when text or image objects are present.
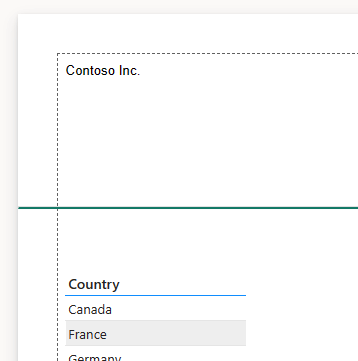
To move text or image objects lower on the page, move the section line down. To move the section line up, move the items up. Text objects will highlight when moving the section line.
Note
To leave room for the beginning of your formatted table of data, you can't move the section line to the very bottom of the first page.
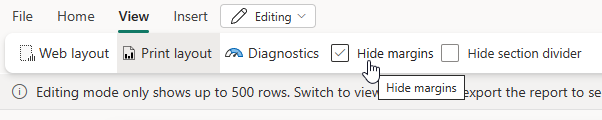
The page margins and section divider visibility can be turned off by going to View and selecting Hide margin and / or Hide section divider.
Note
The page margins and section line are design helpers while authoring the paginated report. They're not saved in the report and aren't visible in exported reports or while in reading view.
Considerations and limitations when working with text
- As with other objects in a report, you can only select one text box at a time.
- Text boxes can't be duplicated, or copied and pasted. You can highlight, copy, and paste text within text boxes.
- You can only place text boxes above the section line within the boundaries of the print layout, even if web layout is selected.
- Text boxes may overlap. You can't change text box layer order. The most recently added text box is on top.
- When you enter text in a text box that's larger than the text box area, you can't select the bottom resize handle. Use the bottom corner resize handles or any other resize handles to resize the area.
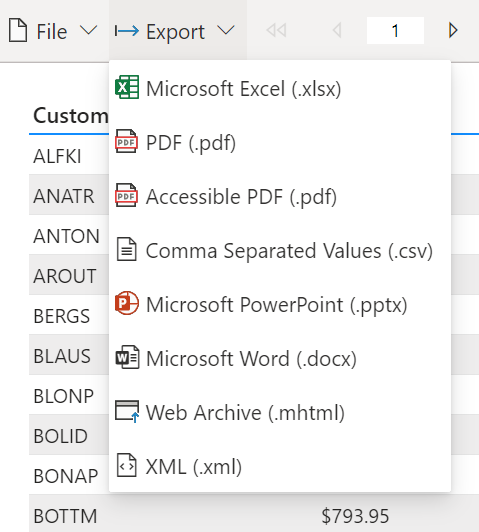
Export your report
You can export the table before or after you save it. Paginated reports have rich export capabilities to any of the supported formats, preserving full fidelity. The exported report is saved to your default Downloads folder.
Save your report
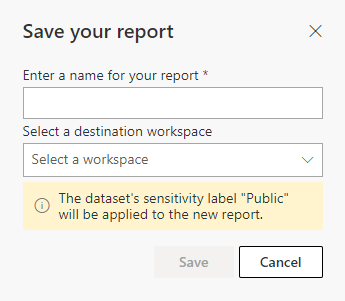
You can save the report to any workspace.
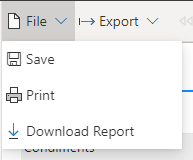
On the File menu, save, download, or print your report.
In Save your report, give your report a name and select a workspace.
After you save the report, you see a success or failure notification in the top right of the editor.
- If a report already exists where you have chosen to save, it asks you if you wish to overwrite the existing report.
- If it succeeds, you see a link to the report. You can either follow this link or continue editing.
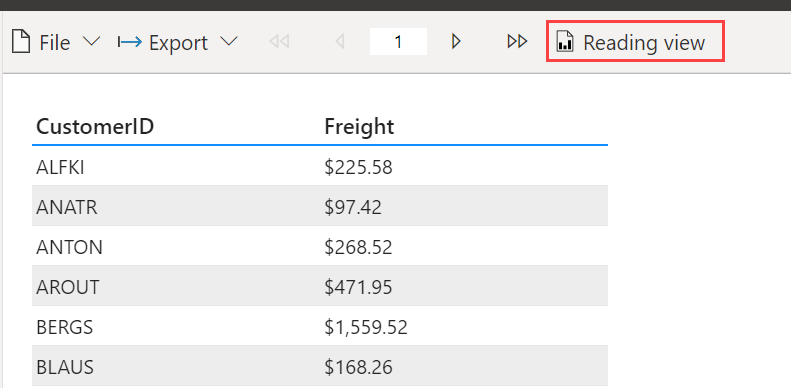
After saving the report, you can preview it. Select Reading view on the top bar in the editor. You leave the editor experience and enter the normal paginated report viewer experience.
Note
If you haven't saved the report yet, or have unsaved changes, you receive a prompt asking you to save or discard your changes before taking you to the reading view.
Considerations and limitations
- You can create a paginated report in any workspace.
- You can't create a paginated report from Power BI semantic models based on a live connection.
- The online editor does not replicate all existing Power BI Report Builder functionality.
Related content
Feedback
Coming soon: Throughout 2024 we will be phasing out GitHub Issues as the feedback mechanism for content and replacing it with a new feedback system. For more information see: https://aka.ms/ContentUserFeedback.
Submit and view feedback for