View aggregate analytics
Real-time journeys come with built-in dashboards for aggregate journey and channel analytics.
Aggregate cross-journey analytics
Aggregate cross-journey analytics allow you to analyze your orchestrated journeys and evaluate their performance. Cross-journey analytics address your reporting needs by providing a performance dashboard out of the box with appealing Microsoft Power BI visuals. Use the dashboard to enhance stakeholder presentations regarding your journey's performance.
Use the aggregate cross-journey analytics dashboard to review recent journey effectiveness and quickly share reports with stakeholders.
To view cross-journey analytics, go to Real-time journeys > Engagement > Analytics > Journeys.
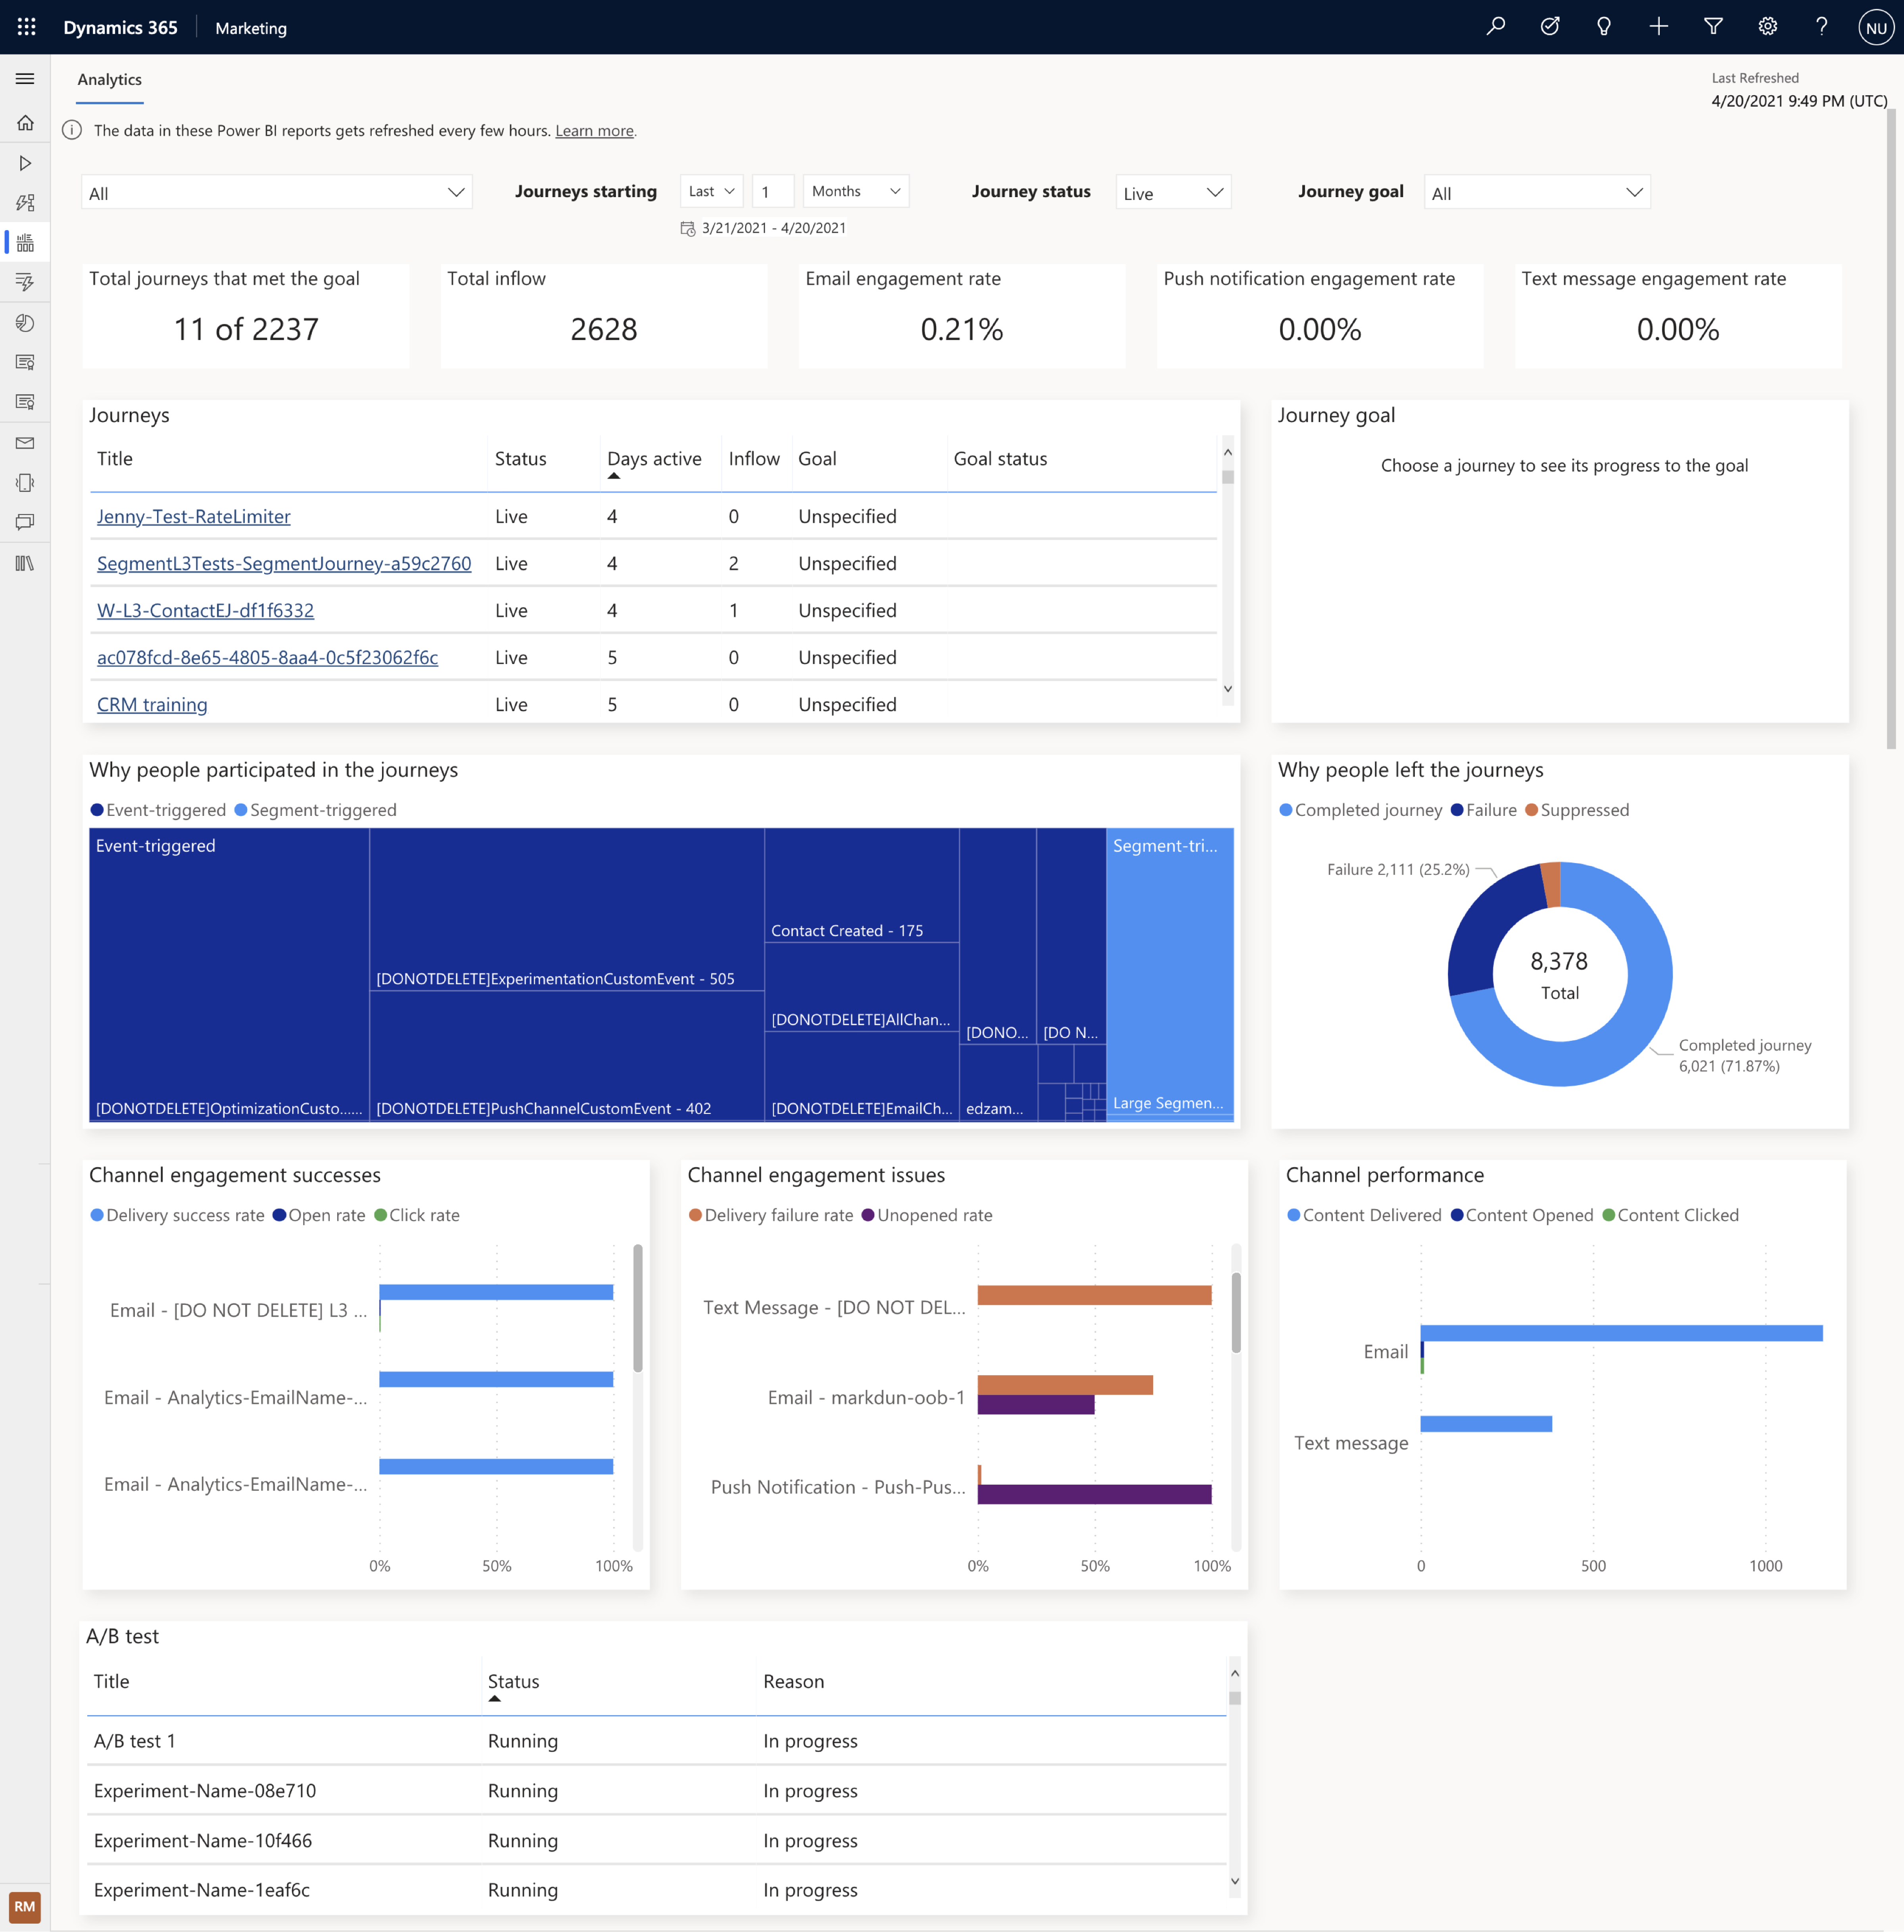
For more information, see How to use aggregate cross-journey analytics.
Aggregate channel analytics
The built-in aggregate channel analytics dashboard shows important metrics and insights about the delivery and engagement of your marketing assets at any level of aggregation. You can access insights across all journeys and channels and zoom in on a particular channel or message. This access helps you stay on top of your marketing campaign effectiveness and track the performance of your marketing assets.
You can use the date, channel, journey, and name filters to learn about key delivery and engagement metrics at any level of aggregation. You can also use the charts in the dashboard to study metric trends over time and investigate anomalies or spikes.
To view cross-journey analytics, go to Real-time journeys > Engagement > Analytics > Channels.
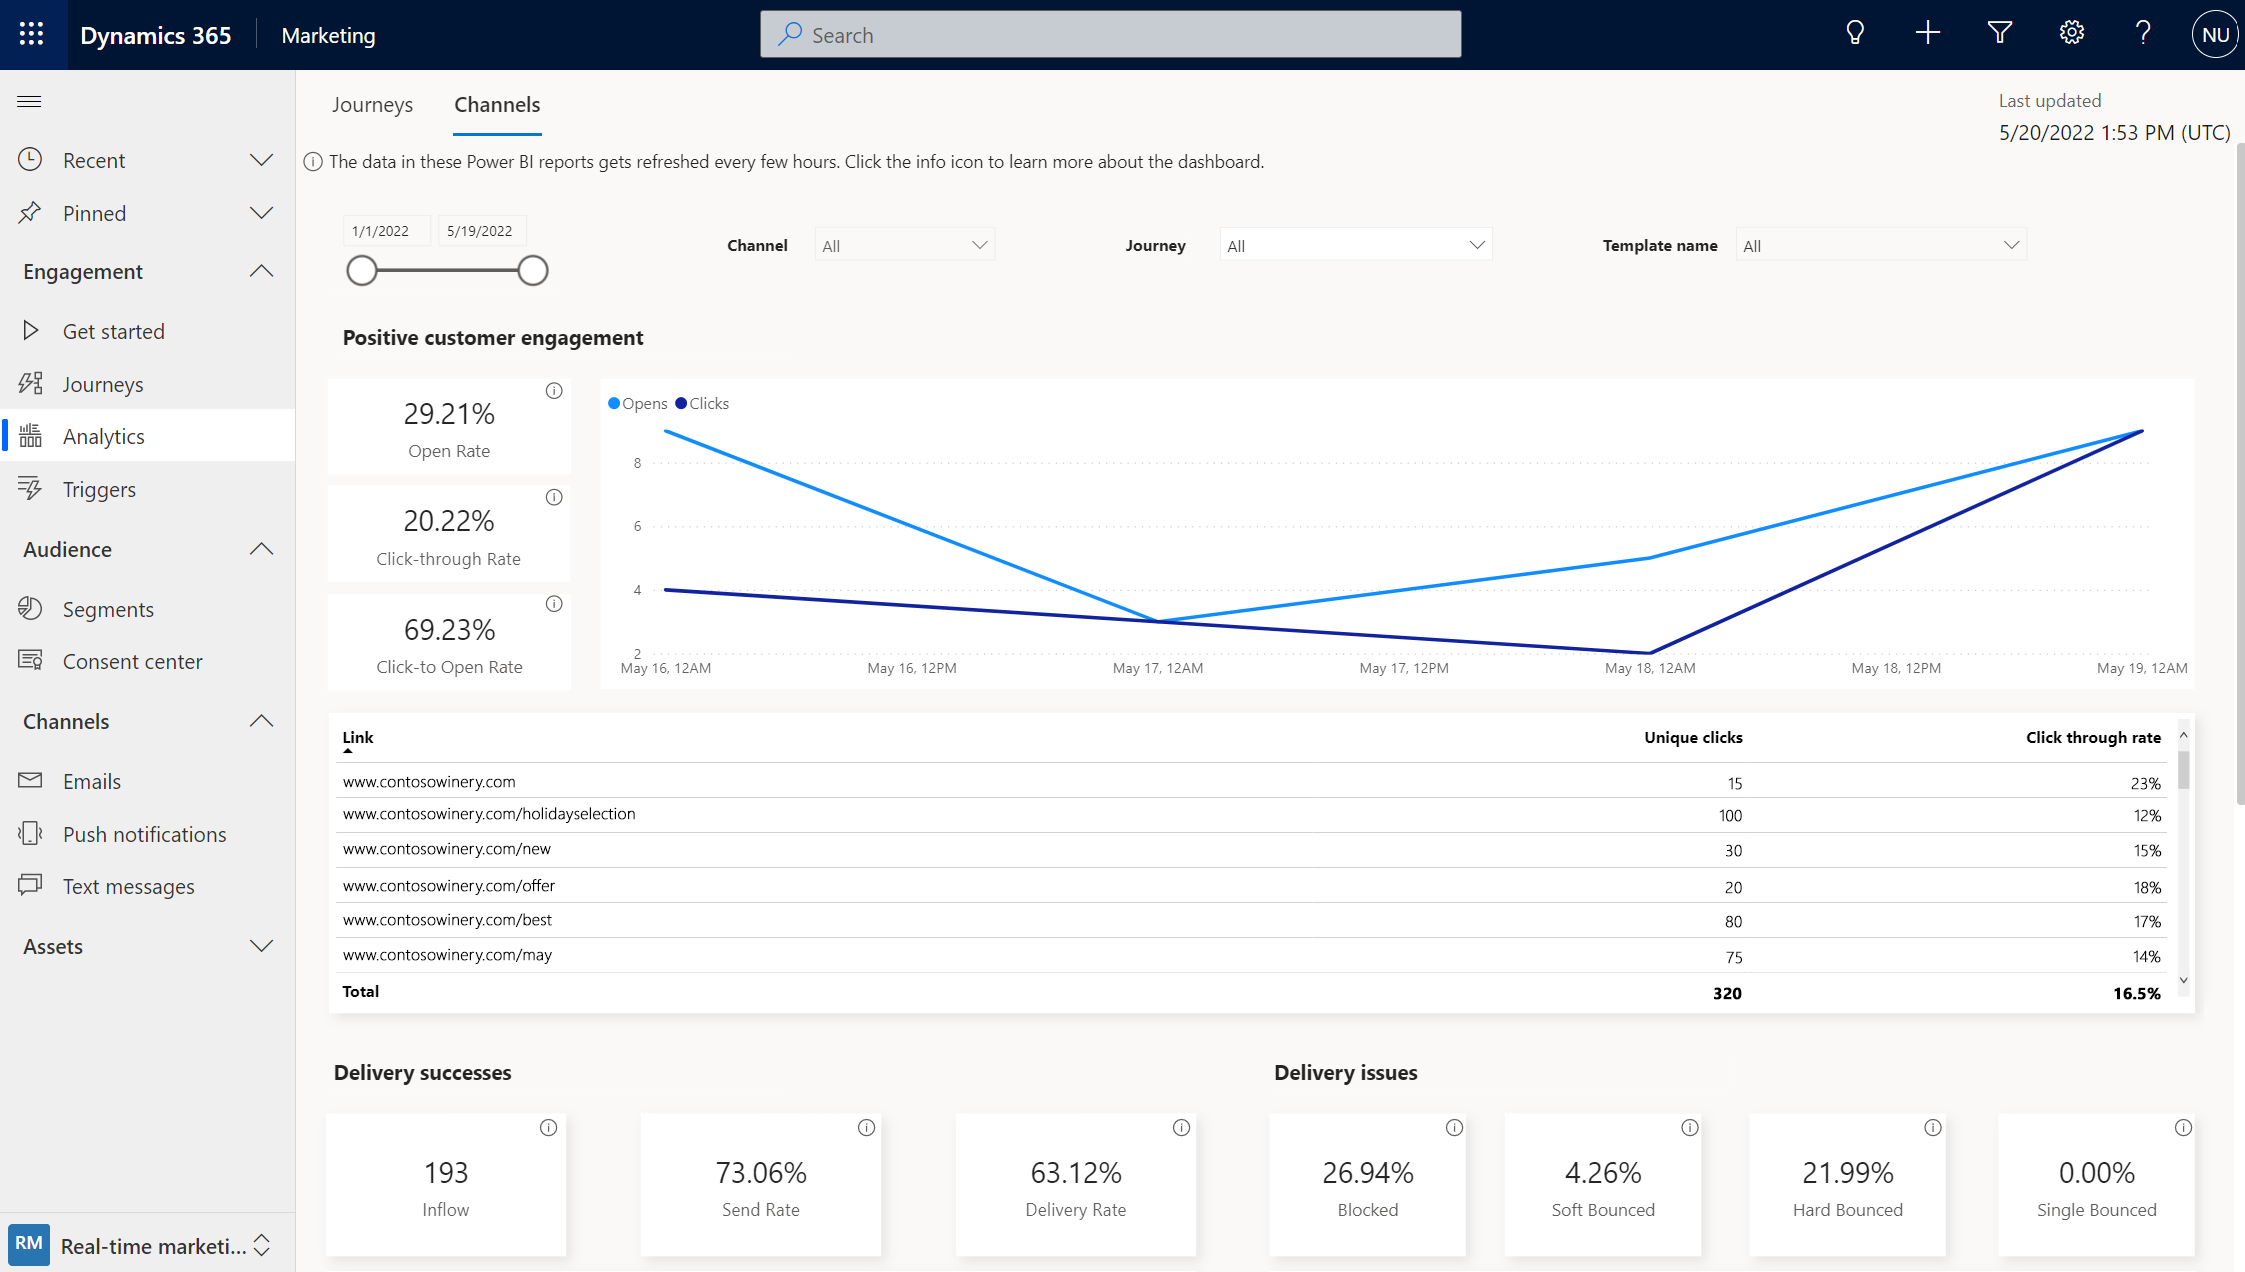
For more information, see How to use aggregate channel analytics.
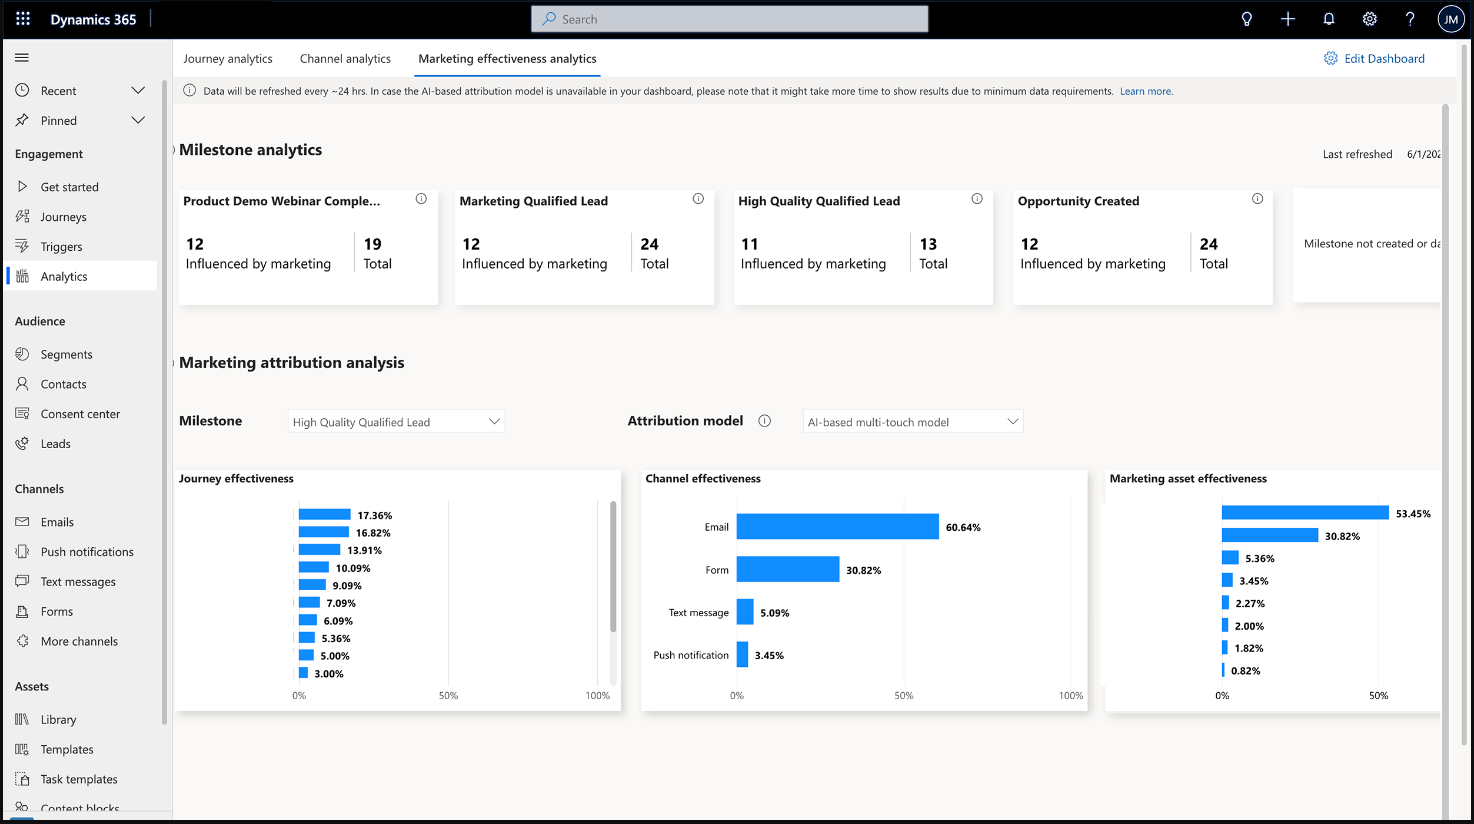
Marketing effectiveness analytics (Preview)
With the marketing effectiveness analytics dashboard, you can define key customer milestones, measure them over time, and assess the contribution and effectiveness of your journeys, channels, and marketing assets in driving customers to the milestones. The dashboard uses AI-powered multi-touch and single-touch attribution models. This capability provides you with a feedback loop to gain a comprehensive view of the effectiveness of your Customer Insights - Journeys tactics in driving key business outcomes. This functionality also empowers you to optimize your marketing mix by learning from tactics that worked well and improving or dropping tactics that didn’t.
For more information, see Preview: Marketing effectiveness analytics.