Exercise - Apply a custom report theme
In our scenario, the Marketing department provides standard color themes to be used across reports. We can use the Report Theme feature in Power BI by uploading a theme. The Report Theme requires a JSON file where the data colors, background, foreground, and a table of accent colors are defined. The JSON file can be used across all the reports.
Make sure you're using the file titled MyFirstPowerBIModel you've been working on in the previous units.
Section 1: Apply a custom report theme
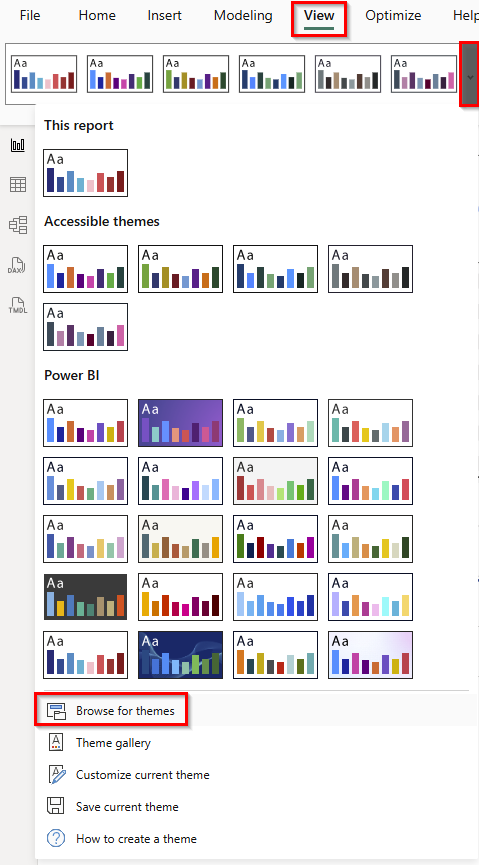
From the ribbon, select the View tab and choose the drop-down within the Themes menu.
Then, select Browse for themes.
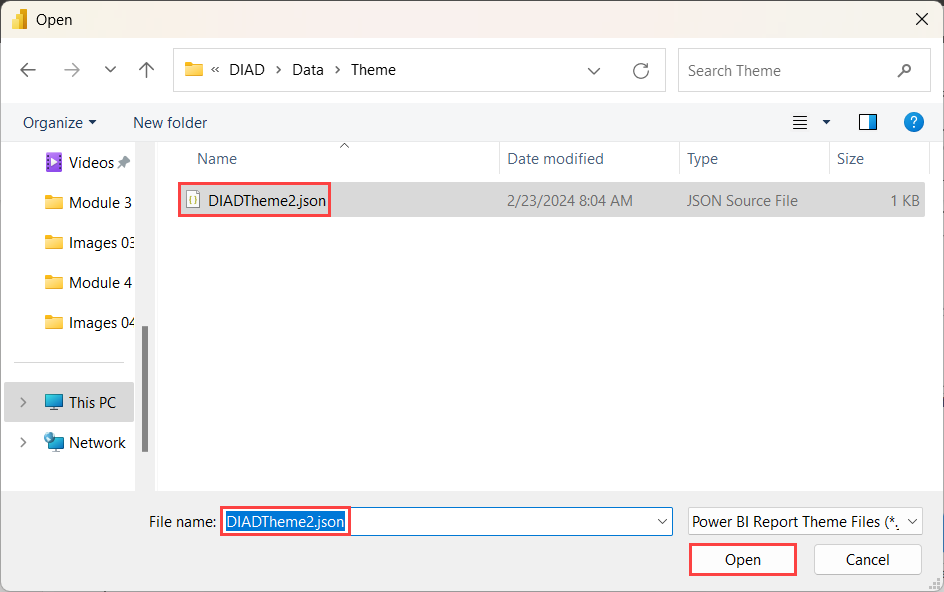
A file browser dialog box opens. Navigate to the Data folder, then the Theme folder (DIAD/Data/Theme).
Select the DIADTheme2 file and then choose Open.
Note
Here you can save and add your custom themes.
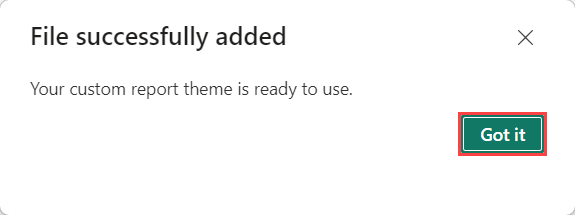
Once the theme is imported, a success dialog box opens. Select Got it.
Now that we have our own custom theme applied, let's make more formatting changes for the theme to stand out.
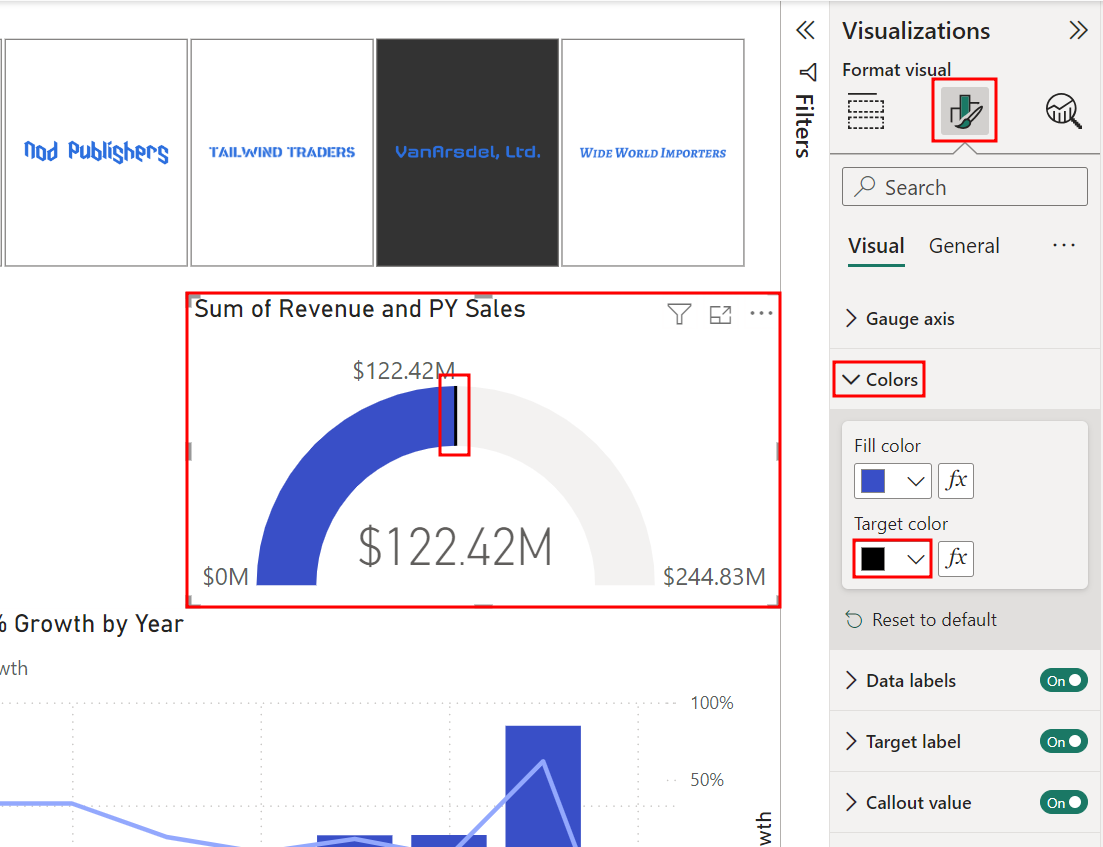
Select the Gauge visual.
From the Visualizations pane, select the Format visual tab (the paint brush icon).
Expand the Colors section.
Select the drop-down menu below Target color. Notice the color palette is different now.
Select the color black. Notice the subtle change to the target line in the visual.
Collapse the Colors section.
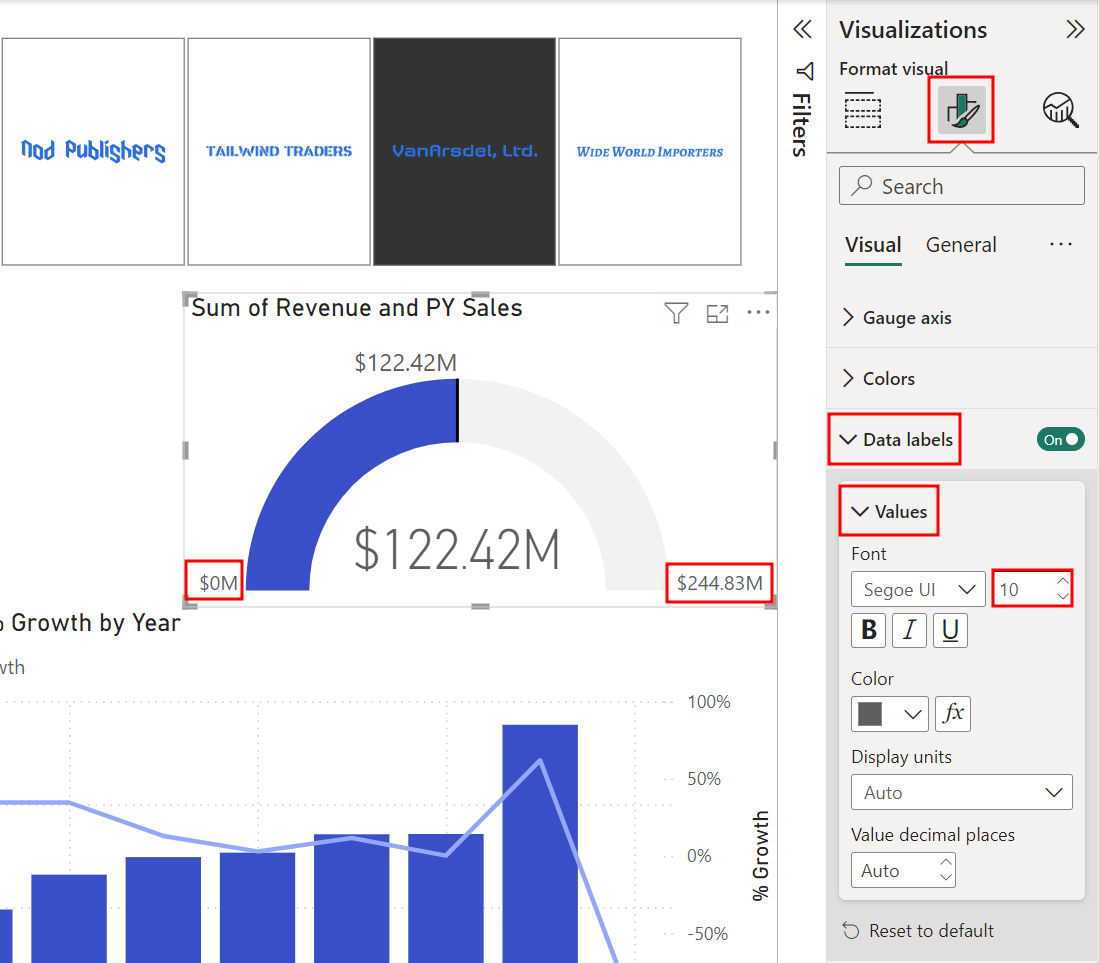
In the Visualizations pane, under the Format visual tab, expand the Data labels section.
Then, expand the Values section and change the Font size to 10.
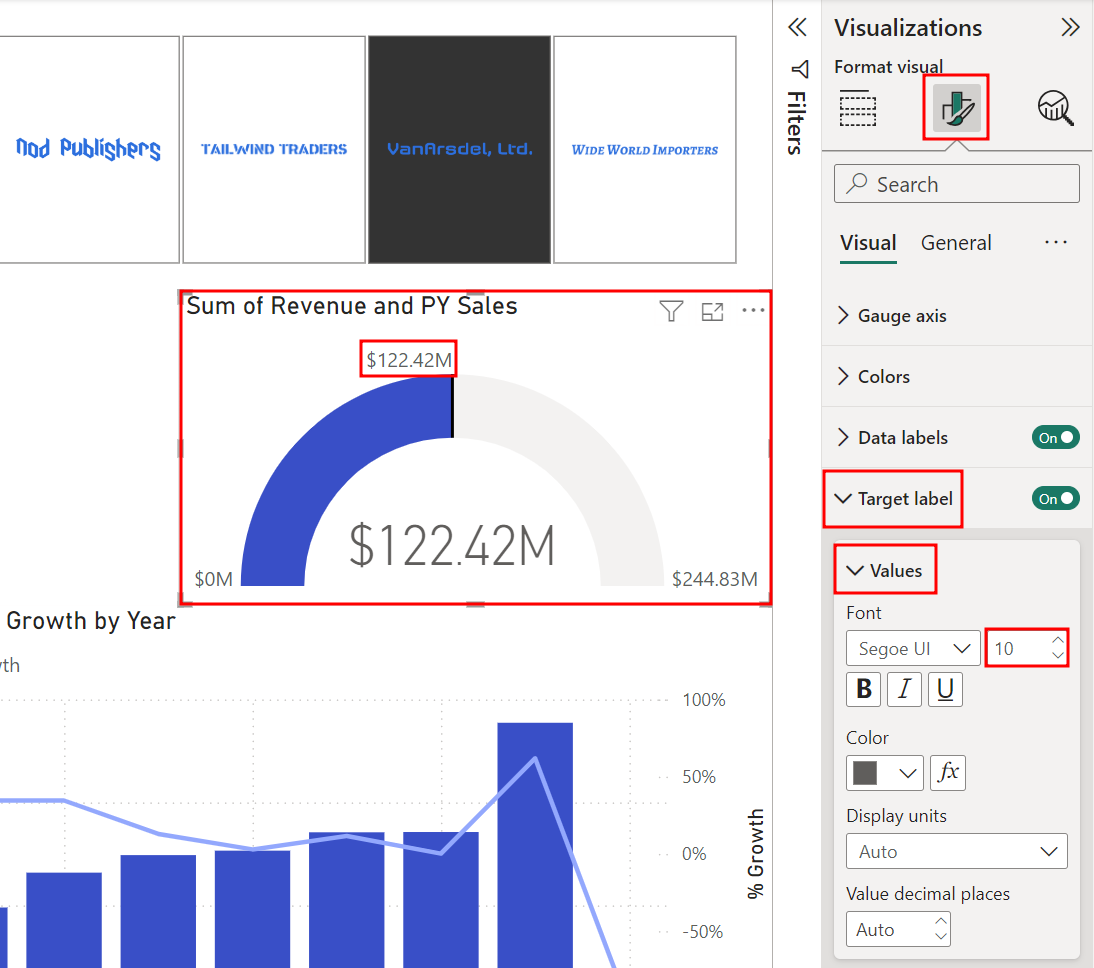
While still in the Visualizations pane, expand the Target label section under the Format visual tab.
In the Values section, change the Font size to 10.
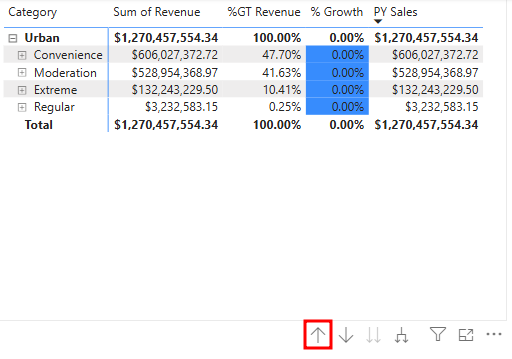
Select the Matrix visual.
Using the arrows within the visual header, Drill up to the Segment level.
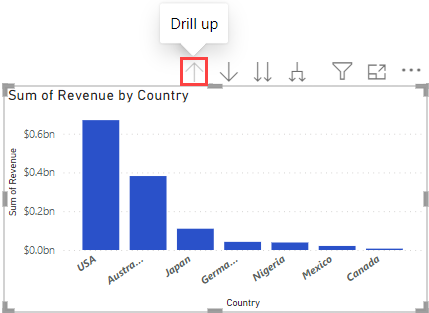
Select the Sum of Revenue by Country and State visual.
Using the arrows within the visual header, Drill up to the Country level.
While the Sum of Revenue by Country visual is still selected, in the Visualizations pane, select the Format visual tab (the paint brush icon).
Expand the Columns section, then the Color section.
Using the drop-down menu, select a light shade of gray as the Default color.
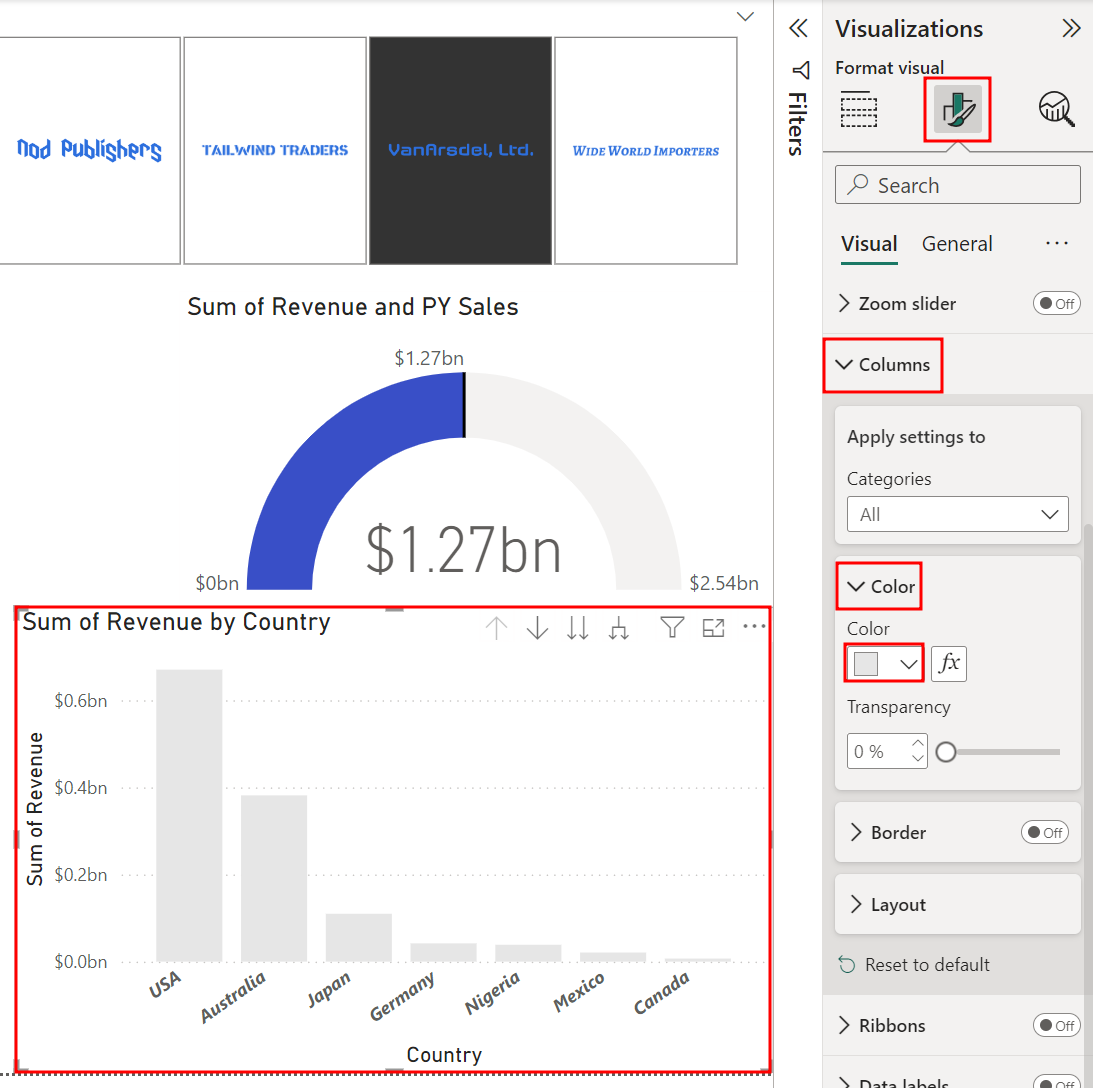
Check that the Sum of Revenue by Country visual is still selected.
In the Visualizations pane under the Format visual tab, turn On the Data labels, and expand this section.
Expand the Value sub-section in the Data labels section.
Change the Display units to Millions.
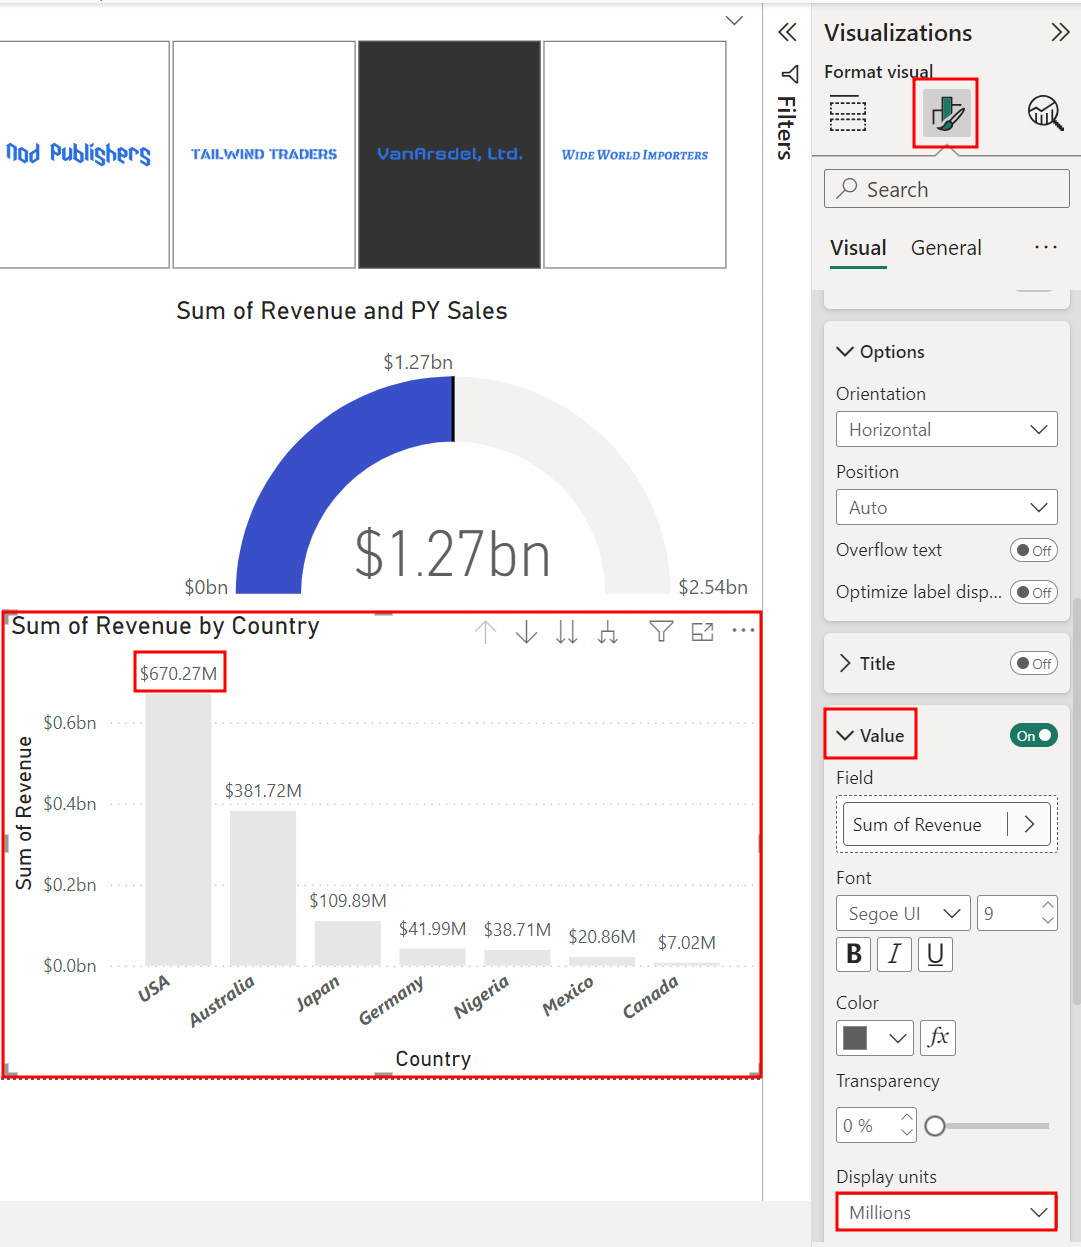
Notice there are many formatting options. For example, a visual title can be changed and formatted, or you can add a border and background to the visual. Feel free to explore other options.
Let's move to another visual.
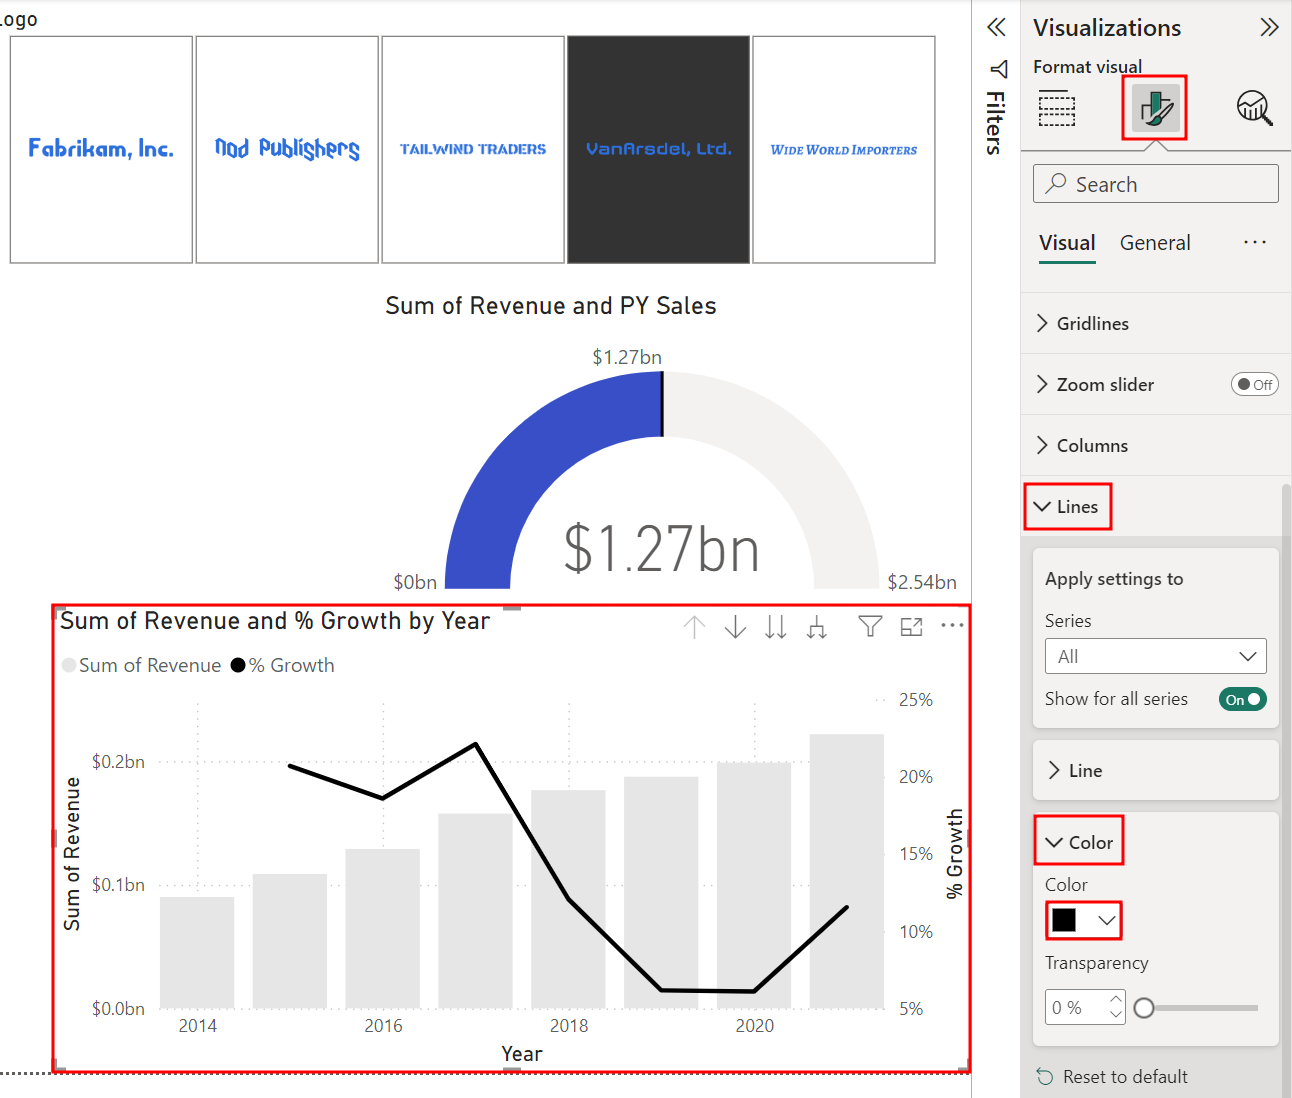
Select the Sum of Revenue and % Growth by Year visual.
Note
You may need to move or resize the visuals to see all the information that will be needed in the next steps.
Since there's no Revenue value in the year 2022, right-click on the line above 2022 and select Exclude.
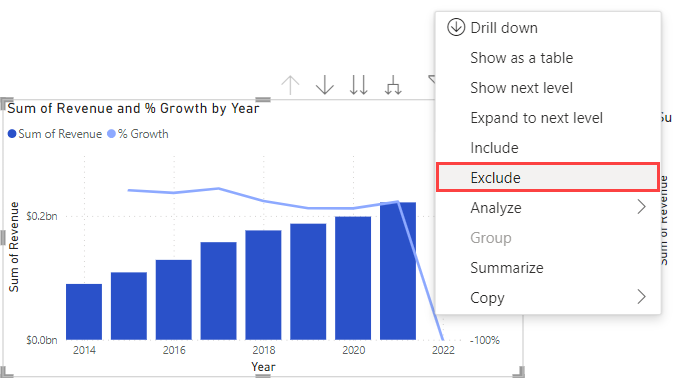
Next, from the Visualizations pane, select the Format visual tab (the paint brush icon).
Expand the Columns section.
Expand the Color section.
Select a light shade of gray as the Default color.
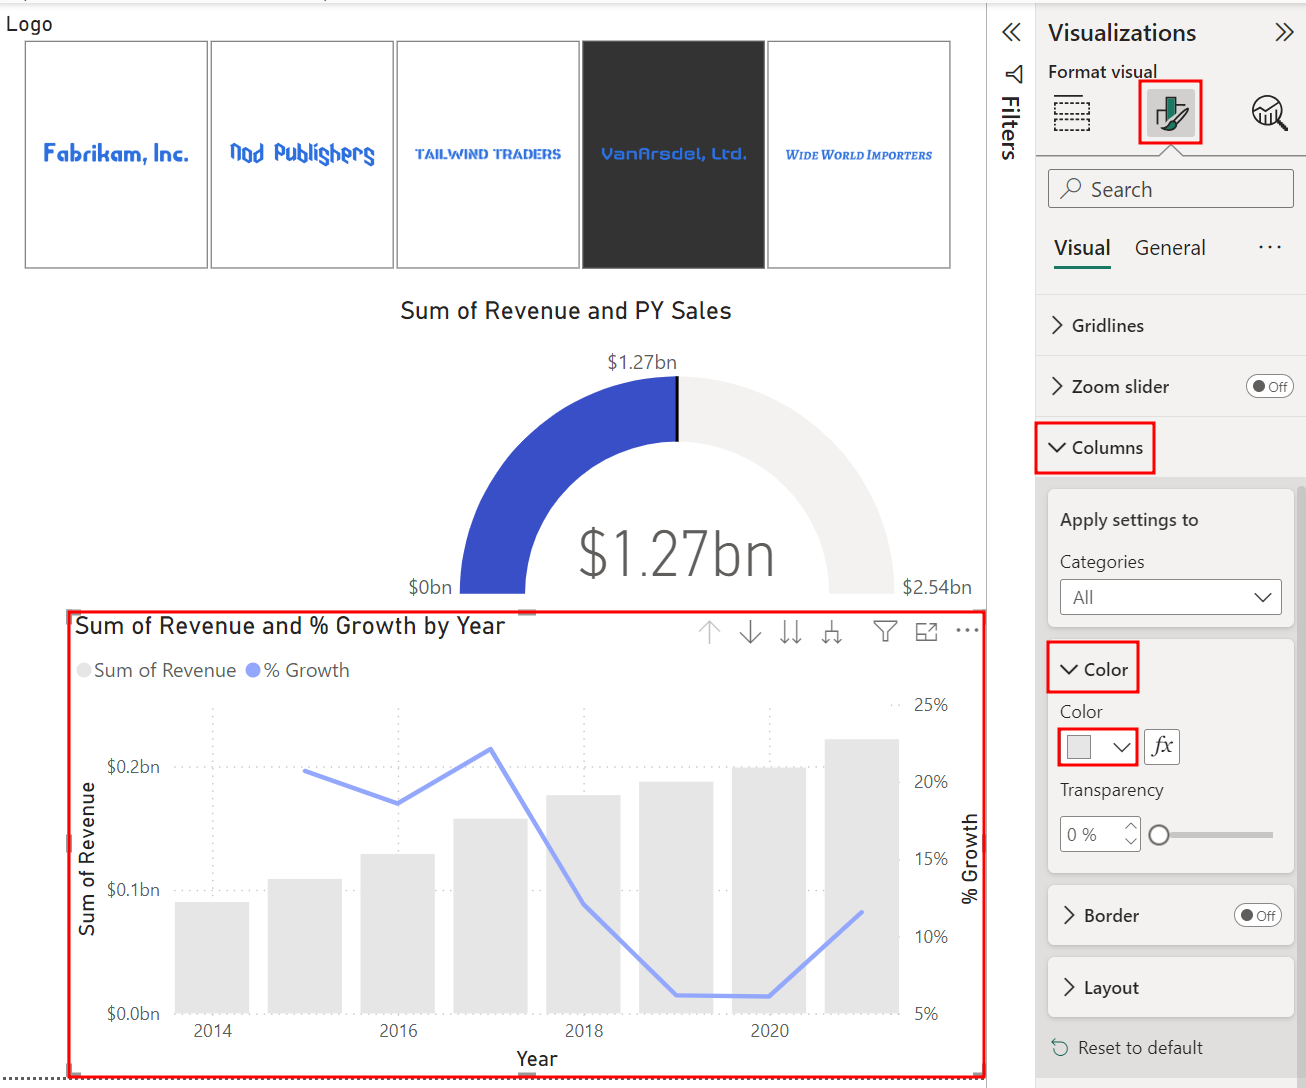
Check that the Sum of Revenue and % Growth by Year visual is still selected. You can collapse the Columns section.
In the Visualizations pane under the Format visual tab, expand the Lines section.
Then, expand the Color section.
Set the % Growth color to black.
Now let's add a report title.
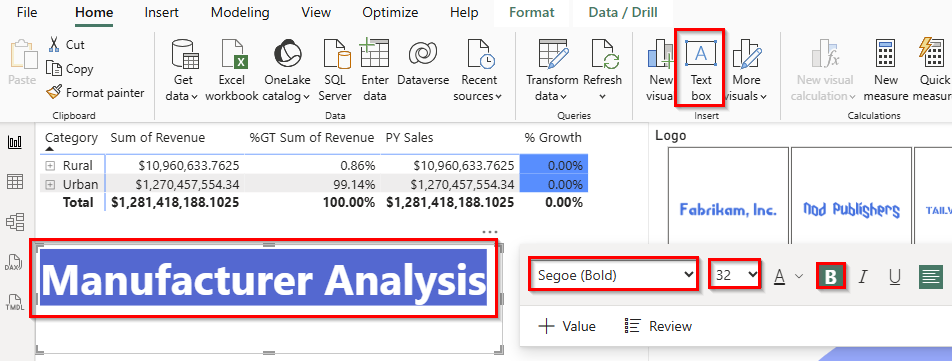
From the ribbon, select the Home tab and then choose Text box under Insert. Notice a text box visual is added.
Resize and move the visuals as needed.
Enter
Manufacturer Analysisin the text box.Highlight Manufacturer Analysis to format the text.
Select Segoe (Bold) as the font.
Select 32 as the font size.
Select the B to Bold the text
Resize the text box as needed.
From the ribbon, select the View tab.
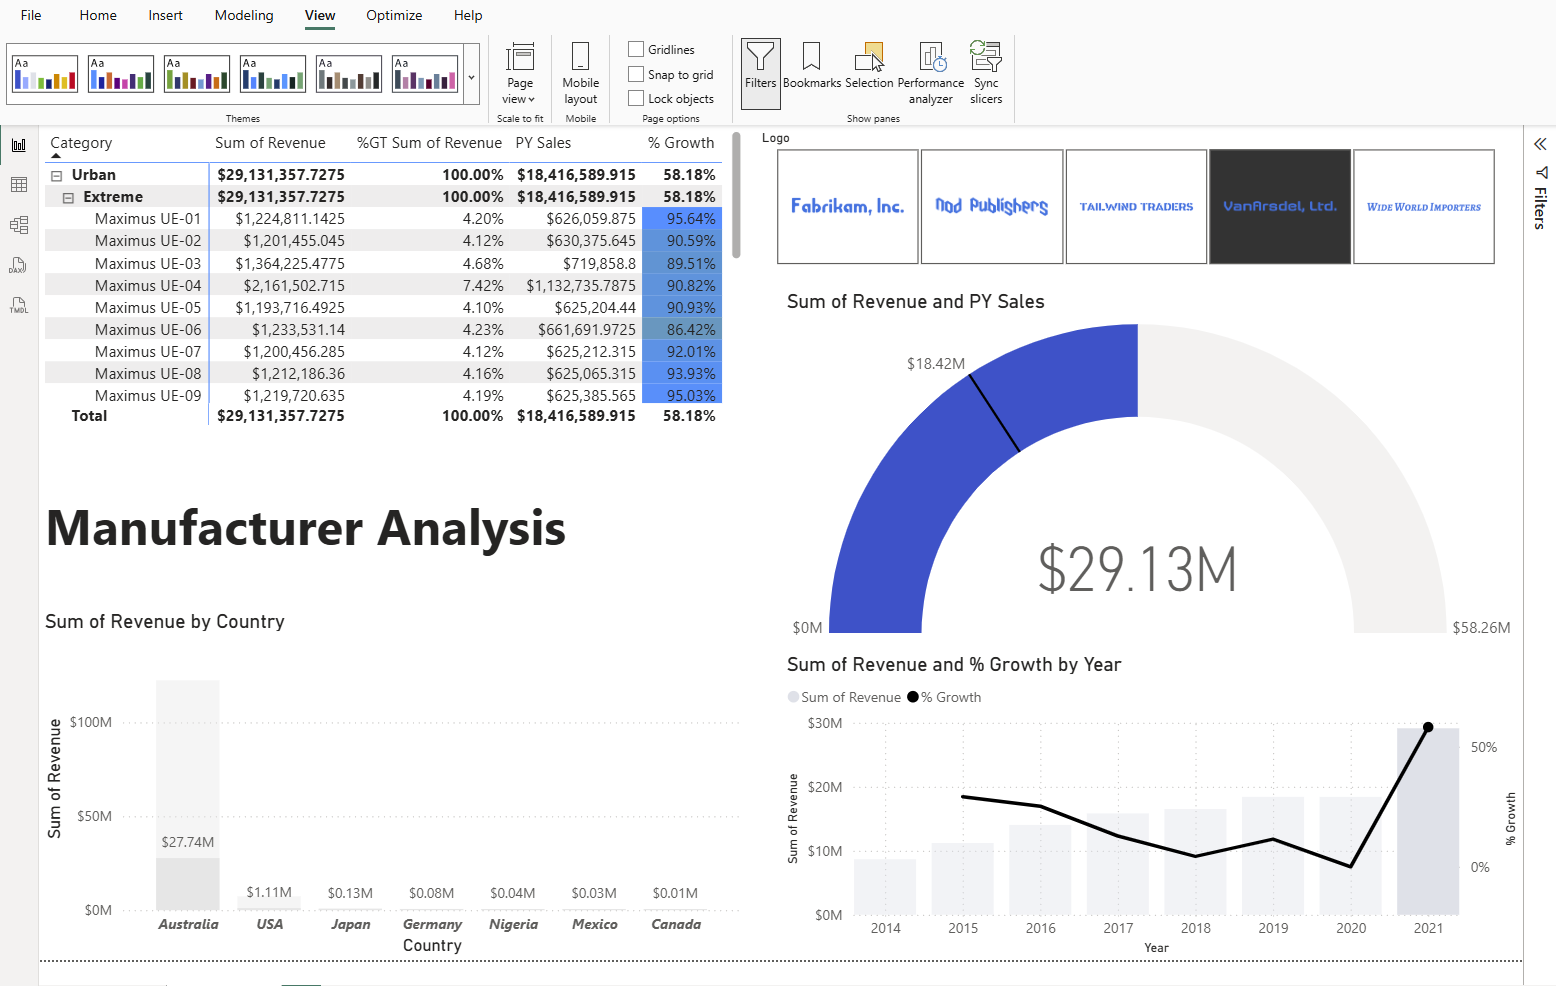
In the Page options section, select the checkboxes next to Visual_Gridline_Show and Snap to grid. This helps with aligning the visuals.

Now, use the Gridlines and Snap to grid features to position and resize your visuals like the figure below.
Uncheck the Gridlines and Snap to grid options to disable these features once you finish moving the visuals into the correct places.
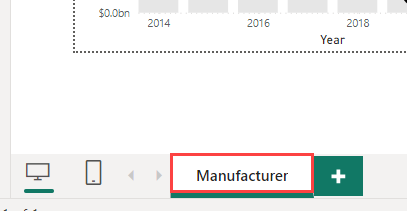
Right-click the page name in the lower-left corner.
Then, select Rename Page from the options menu.
Rename the page to Manufacturer.
Now that we have a basis for the report, in the next Unit we'll cover how to import and implement custom visual elements.