Browse and connect to data in OneLake
Imagine you work at a retail organization where data lives across multiple workspaces. The data engineering team maintains cleansed data in their lakehouse, other departments have warehouses with business metrics, and analysts created semantic models. You need to find and connect to this data to transform tables for analysis, create semantic models, or build reports.
The OneLake catalog helps you find data items across your organization. Once you locate the data you need, connect to it to build your analytical solutions.
Find data in the OneLake catalog
The OneLake catalog is a centralized discovery experience for all data items in your Microsoft Fabric tenant. You can search for items by name or tag, making it easy to locate specific items even in large organizations.

The catalog respects access permissions, which keeps sensitive data secure while enabling discovery of available resources. This permission-based visibility means different team members see different catalogs based on their roles.
The OneLake catalog shows metadata for each item to help you understand what the item contains and whether it's approved for production use before you start working with it. Metadata fields include:
- Name, type, owner
- Last refresh time
- Workspace location
- Sensitivity labels
- Endorsement status (Certified/Promoted)
Your organization defines sensitivity labels to ensure proper governance over the data. These labels help you identify highly sensitive data and make informed decisions when granting access.
Endorsement helps others find trusted content. There are three endorsement levels:
- Promoted: The item is ready for sharing. Any user with write permissions can promote an item.
- Certified: The item meets your organization's quality standards. Only authorized reviewers can certify items.
- Master data: The item is an authoritative source of truth for core organizational data like customer lists or product codes. Only authorized reviewers can apply this label.
All Fabric and Power BI items, except dashboards, can be promoted or certified. The Master data label applies only to data items, like lakehouses and semantic models.
By using the catalog to discover existing data, you reduce duplication and confusion while encouraging collaboration in your organization.
Connect to data
Once you find lakehouse or warehouse tables in the catalog, you can connect them to your workspace to transform and curate the data for analysis.
Shortcuts let you reference data from other workspaces without copying or moving it. Changes made in the source are immediately visible through the shortcut. This approach eliminates data duplication while enabling you to add business logic and transformations.
Shortcuts also support cross-workspace collaboration. For example, a data engineering team might maintain cleansed transaction tables in their lakehouse. You can create a shortcut to those tables from your analytics lakehouse, then transform them into business-ready datasets with calculated columns, aggregations, and dimensional models. Using shortcuts for separation also supports the medallion architecture to have different layers for raw, enriched, and curated data.
Tip
Before creating a shortcut, verify the data by using the SQL analytics endpoint. Every lakehouse includes a SQL analytics endpoint that provides read-only T-SQL access to tables. You can query the endpoint to preview data, check schema, and validate that it contains what you need. The endpoint uses familiar T-SQL syntax from SQL Server or Azure SQL Database.
Copilot can assist with writing T-SQL queries when you work with the SQL analytics endpoint. This AI integration is how agents and Copilot query lakehouse data—the same patterns you use to explore and transform data.
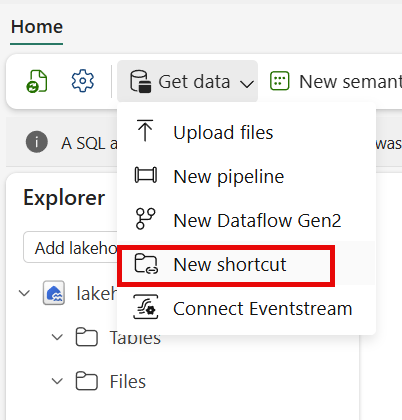
To create a shortcut in your lakehouse:
- Open your lakehouse in the Fabric workspace.
- Select New shortcut from the toolbar.
- Choose OneLake as the shortcut source.
- Browse to the workspace and lakehouse containing the data you want to reference.
- Select the tables or folders to include in the shortcut.
- Confirm the shortcut creation.
The shortcut appears in your lakehouse and you can query it like any other table. You can work with the shortcut by using notebooks, SQL queries, or dataflows to create fact and dimension tables, add calculated columns, or aggregate data for analysis.
Shortcuts might not suit your needs when you require a stable snapshot of data at a specific point in time, when network latency impacts query performance, or when compliance requires physically separate copies.
Work with semantic models
When you find semantic models in the catalog, you can explore and connect to them for reporting. Semantic models contain prebuilt relationships, calculations, and business metrics that make it easier to create reports.
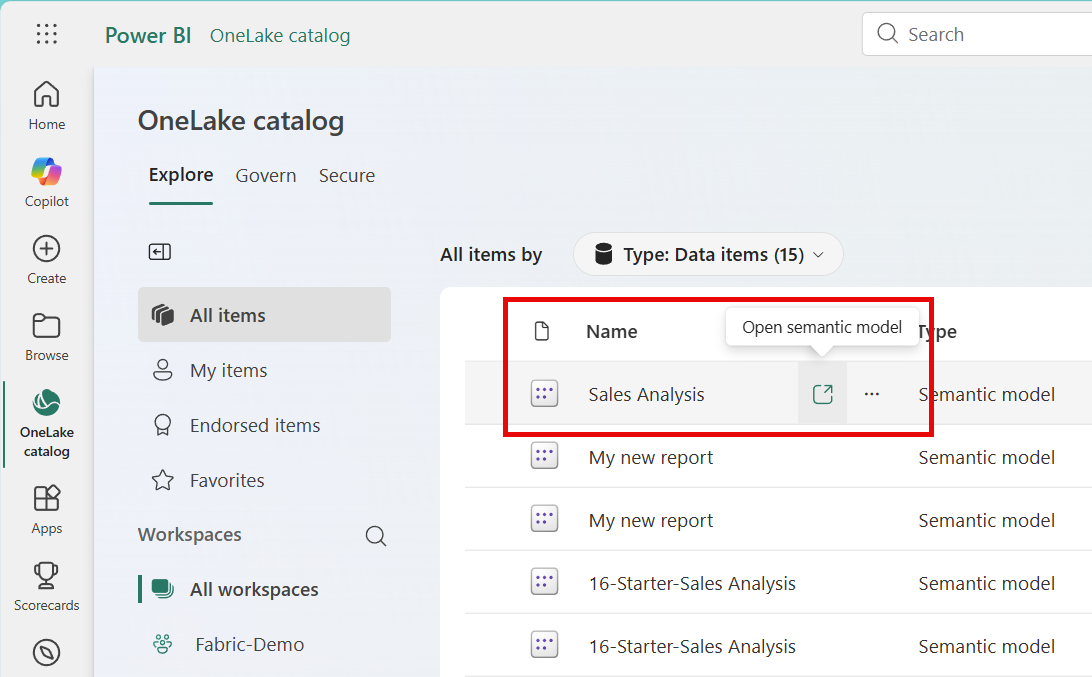
To evaluate whether a semantic model meets your needs, select it in the OneLake catalog and then select Open. The semantic model's details page opens, showing:
- Overview tab: Displays the description, owner, refresh status, endorsement, and sensitivity labels
- Tables section: Shows the underlying table and column schema. You can select the binoculars icon next to any table or column to explore sample data
- Lineage tab: Visualizes upstream and downstream dependencies
- Monitor tab: Shows refresh history and activity
Once you've confirmed the semantic model contains the data you need, you can create content from it using the Explore this data dropdown button, which offers several options:
- Explore this data: Opens a lightweight tool for quick ad-hoc analysis with matrix visualizations
- Auto-create a report: Automatically generates a summary report with key insights and visualizations
- Create a blank report: Opens the report editing canvas to build a custom report
- Create from template: Uses an existing report template as a starting point (if available)
- Create a paginated report: Creates a formatted report suitable for printing or exporting
You can also select Analyze in Excel to create a PivotTable connection, allowing you to analyze the semantic model using Excel's familiar interface.