Note
Access to this page requires authorization. You can try signing in or changing directories.
Access to this page requires authorization. You can try changing directories.
We're excited to announce the availability of Visual Studio 2022 v17.14. This update focuses on stability and security, along with AI improvements for all developers.
Download Visual Studio 2022 v17.14 to enjoy these new features and improvements.
Features
Explore the latest enhancements and updates in Visual Studio 2022 version 17.14. This section provides detailed information on new features, improvements, and tools available in this release.
IDE
MCP Authentication Management
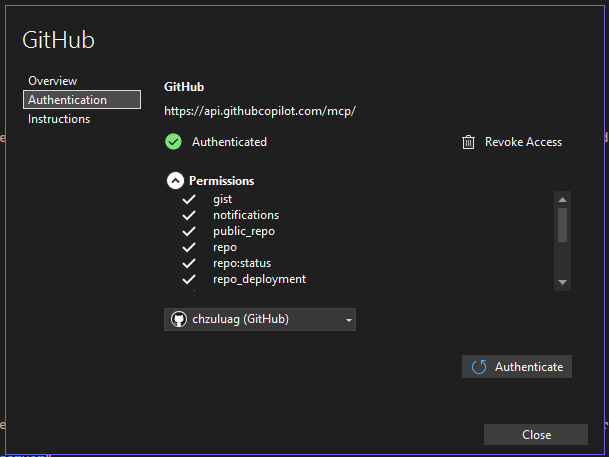
You can now manage authentication credentials for MCP servers in a unified experience in Visual Studio.
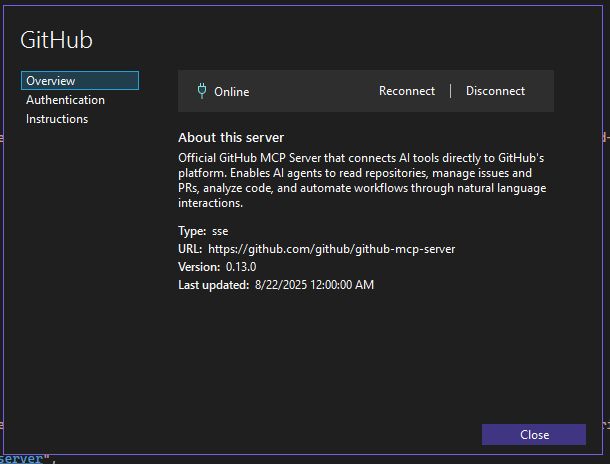
You can now manage authentication credentials for MCP servers in one place in Visual Studio, including credentials from outside the Visual Studio Keychain like Microsoft and GitHub accounts. Access this through the new MCP server management experience.
MCP Server Instructions
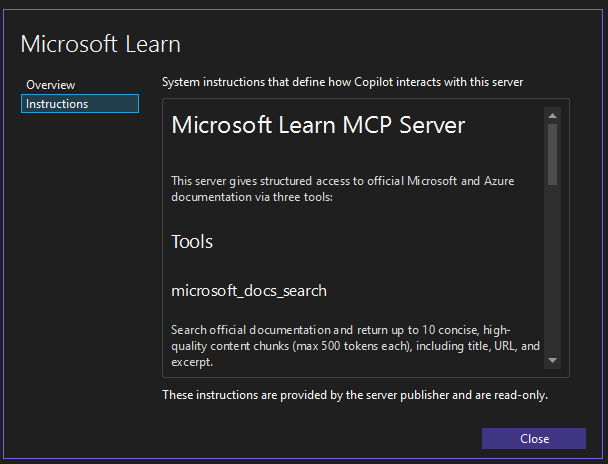
You can now view instructions files that may be shipped with MCP servers directly in Visual Studio.
MCP server instructions are a quick system prompt that the server sends to the host, showing you how to use that server's tools. You can now view these instruction files directly in Visual Studio. Just open the new MCP server management experience to check them out.
MCP Elicitations and sampling
Support for MCP Elicitations, and new UX for elicitations and sampling in chat.
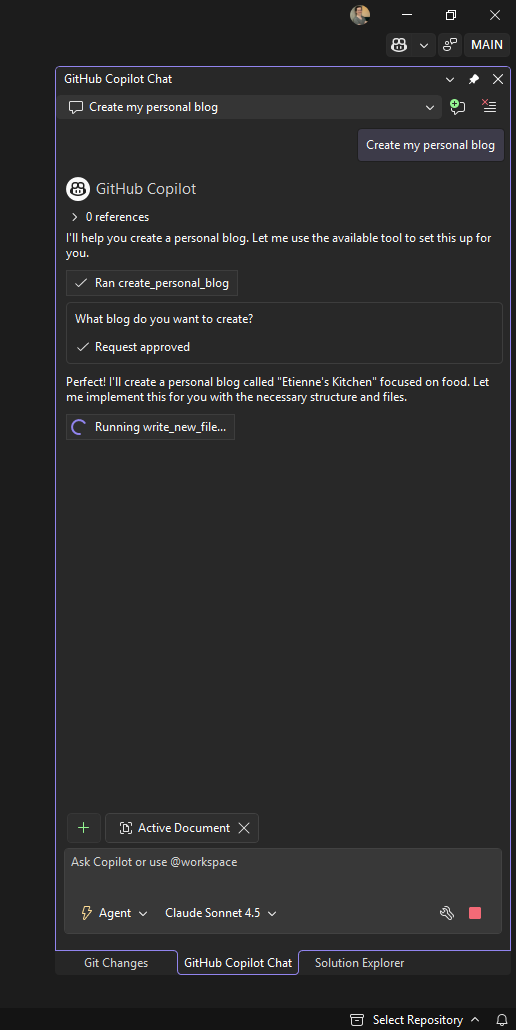
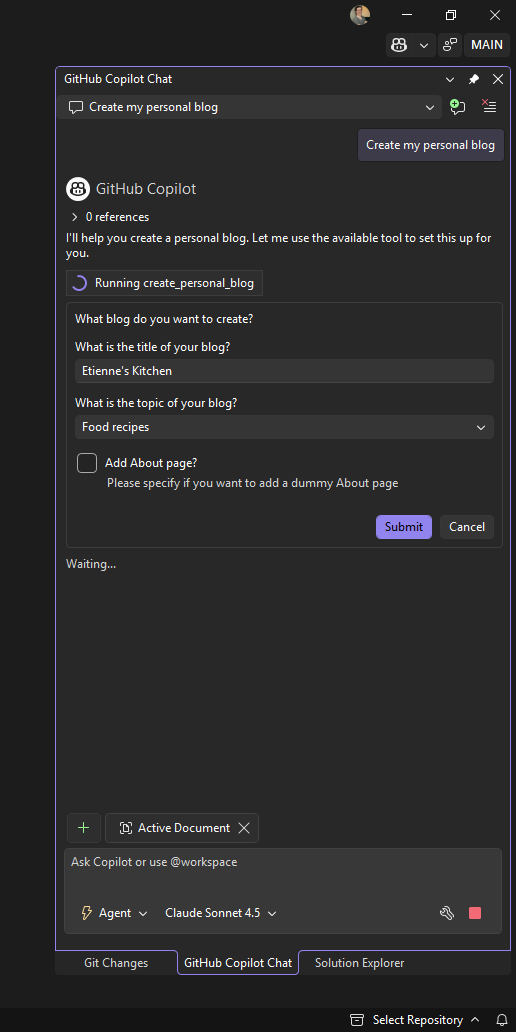
MCP in Visual Studio now supports elicitations. The Model Context Protocol (MCP) lets servers request extra information from you through the client during interactions. This flow helps you control user interactions and data sharing while servers gather the details they need.
You can now respond to MCP sampling and elicitation requests directly in the chat window for a simpler, more streamlined experience.
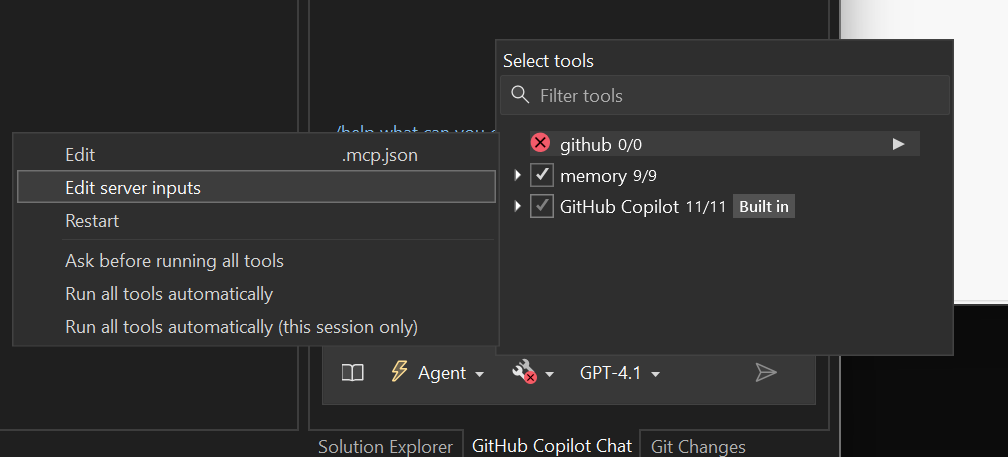
MCP Server Management
An easier, more unified UX for managing MCP servers in Visual Studio.
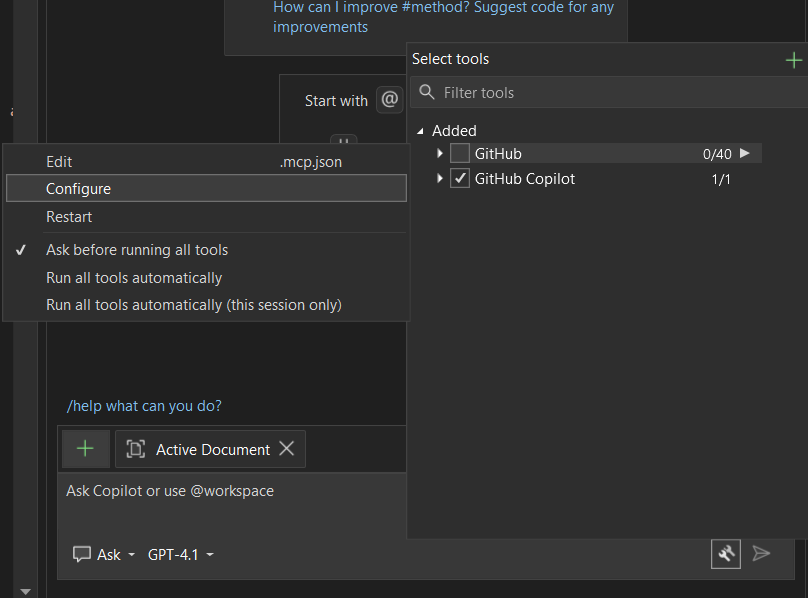
Managing MCP servers in Visual Studio is now easier with a unified experience. You can quickly configure, authenticate, and view server status in a simplified management UI.
Select Configure in the flyout for any server in the tool picker window to get started.
Microsoft 365 Agents Toolkit - June
Agents Toolkit 17.14 GA June release updates.
The June release contains several fixes for 17.14 GA release:
- Enable Custom Engine Agent launch and preview in Microsoft 365 Copilot.
There is a Custom Engine Agent template available in our toolkit which is called Weather Agent. We have updated this template to enable it to be launched and previewed in the Microsoft 365 Copilot chat. To try out, simply select the Copilot launch profile when you debug.
Fixed an error pop up when debug failed with installation of Microsoft 365 Agents playground. Now toolkit will pop up clear message and instructions on how to fix the issue.
Templates upgrade App manifest dependency to v1.21.
Several bugs in templates README file introduced by our new branding changes were fixed.
Updated the toolkit icon in extension manager.
Fixed the issue when launching Agents Playground, the required channel ID value only allows msteams and emulator. Now it allows other values like webchat.
Enhanced NuGet Authentication
NuGet now provides context when asking you to provide credentials.
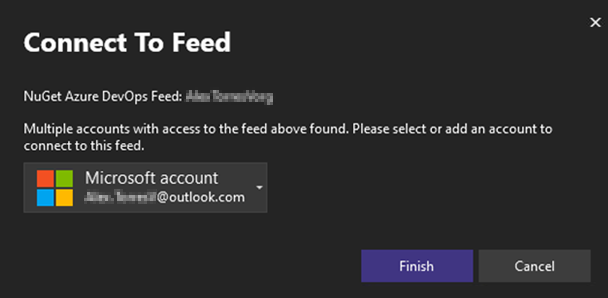
We've improved the NuGet authentication process. If we detect any potential authentication issues, you'll now see a new authentication dialog that provides context about the feed and the specific account needs.
This update enhances the reauthentication process for multi-factor authentication (MFA) scenarios, resolves issues with consecutive authentication prompts, and ensures a smoother overall experience when managing private NuGet feeds.
Microsoft 365 Agents Toolkit
Teams Toolkit 17.14 GA updates.
We are excited to announce that our product, previously known as Teams Toolkit, is being renamed to Microsoft 365 Agents Toolkit. This change reflects our expanded focus and commitment to support a broader range of platforms and project types within the Microsoft 365 ecosystem.
As we continue to enhance our product, we are shifting our focus from solely supporting Teams development to empowering developers to create Microsoft 365 Copilot agents and other applications across the Microsoft 365 platform. These platforms include Microsoft 365 Copilot, Microsoft Teams, Office family and Outlook. This expansion in scope allows us to better serve our users by providing comprehensive tools, templates and resources for developing a wide variety of Microsoft 365 solutions.
The new name, Microsoft 365 Agents Toolkit, better represents the diverse functionalities and capabilities of our product. We believe this change will help our users more easily identify the full range of development opportunities available within the Microsoft 365 environment.
Thank you for your continued support as we evolve to meet the growing needs of our developer community.
Create declarative agent
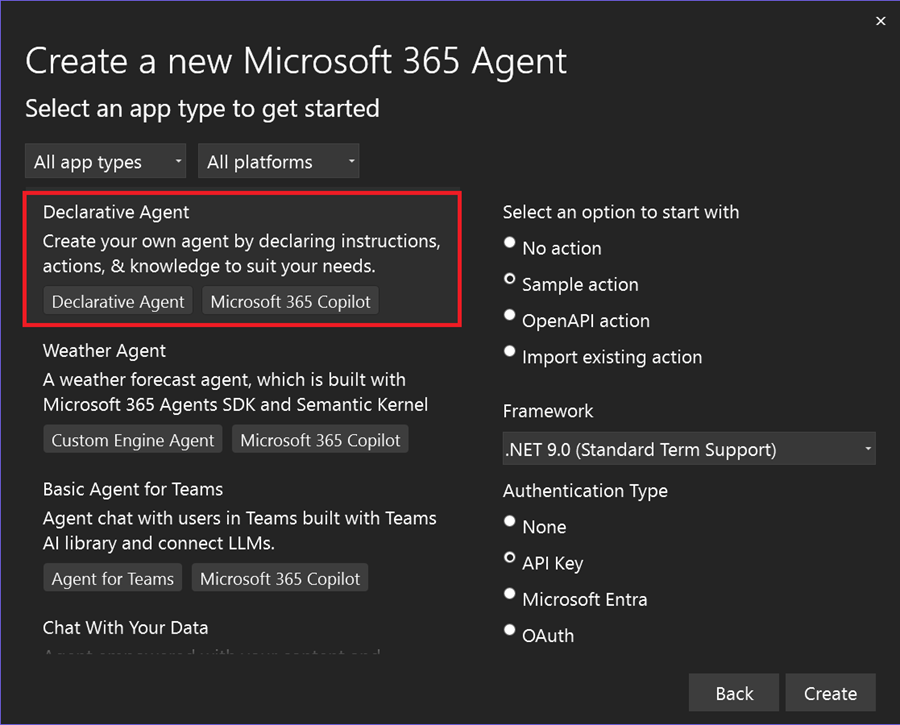
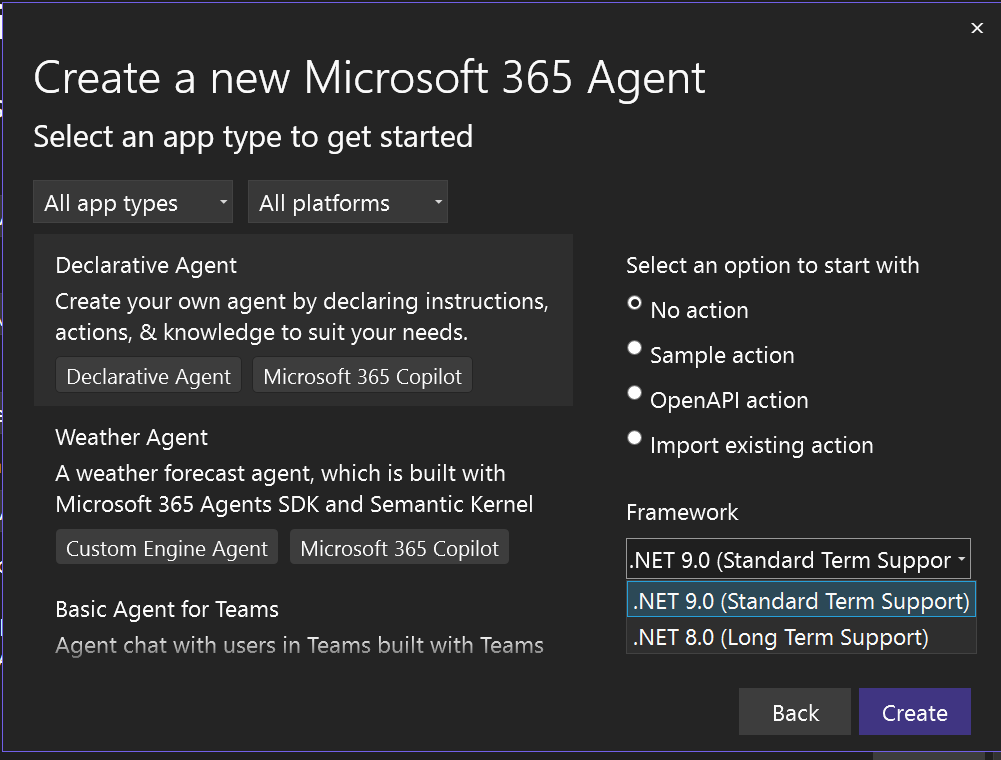
We're excited to announce that in this release we added project templates for building Declarative Agents for Microsoft 365 Copilot.
You can create a Declarative Agent with or without an action. You can choose to define new APIs or utilize existing ones to perform tasks or retrieve data.
Use Microsoft 365 Agents Toolkit to debug and preview your Declarative Agents in Microsoft Copilot.
Enable smooth one-click debug
In previous versions of Teams Toolkit, which is now called Microsoft 365 Agents Toolkit, when users debugged any solution generated, you needed to use the command Prepare Teams app dependency before debugging the project. This command triggered the toolkit to help developers create essential resources for debugging, such as registering or updating the Teams app.
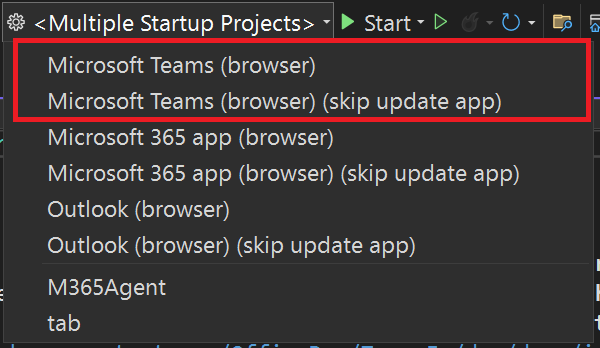
To enhance the debugging experience and make it more intuitive for Visual Studio users, we have removed this step and enabled one-click debugging experience. Now, you can directly click the debug button without any preparation steps. However, if you have made edits to your app manifest between two debug events and need to update your app, there remains an option to do that. We offer two debug profiles:
- Debug with updating app: Select the default profile
[Your Target Launch Platform] (browser)if you have made edits to your app to ensure the updates are applied.- Debug without updating app: Choose the second profile
[Your Target Launch Platform] (browser) (skip update app)to skip updating the app resources, making debugging lighter and quicker.Upgrade to .NET 9
Additionally, in this release, we have refreshed all project templates to support .NET 9.
Happy coding!
The Microsoft 365 Agents Toolkit Team
Preserve font preferences across themes 📣
Changing themes will now preserve your font and font size preferences.
We understand that the fonts developers select when coding is a personal choice, influenced by preferences for readability, accessibility, or aesthetics. Visual Studio themes primarily focus on presentation colors and are independent of your preferred fonts.
With this update, we've introduced functionality to retain your font face and size choices when switching themes. You can now set your font preferences once and switch themes in Visual Studio without needing to reconfigure your font settings every time. Note that the colors of your fonts remain linked to the theme, as that is the purpose of themes, but your font selections will be preserved.
📣 See feature ticket to share your feedback and continue the conversation.
Productivity
Mermaid chart rendering
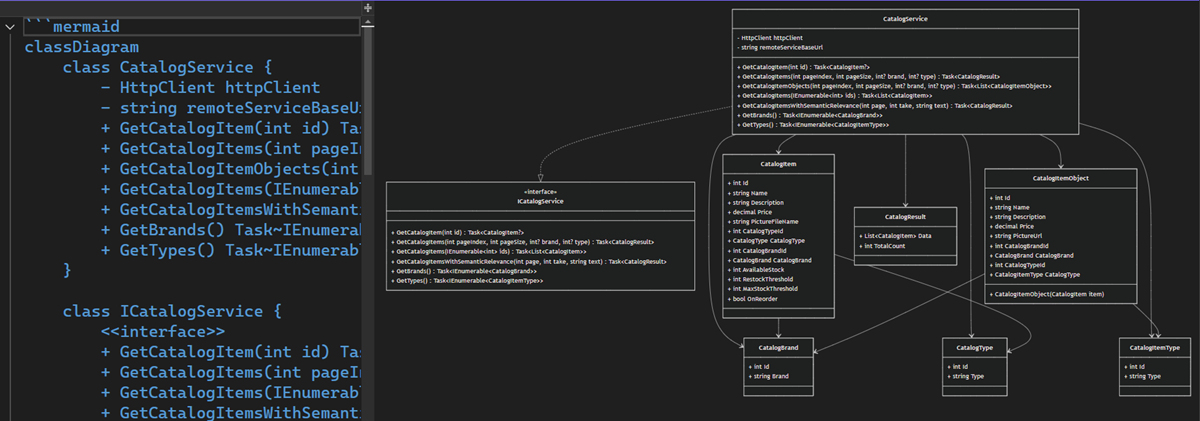
Rendering Mermaid charts in both the Markdown editor and Copilot Chat.
Visual Studio now supports rendering Mermaid charts in both the Markdown editor and Copilot Chat. This lets you visualize complex data structures, workflows, and relationships directly within your code editor. For example, you can create flowcharts and diagrams in a Markdown file using Mermaid syntax - they're automatically rendered in the preview.
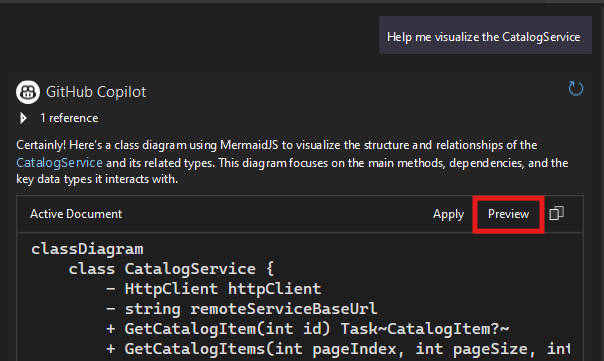
You can also ask Copilot Chat to generate charts and diagrams to help explain complex codebases or logic with visual aids. The returned Mermaid markdown is automatically rendered in the chat window.
Please give it a try and generate a Mermaid chart today! We would love to hear your feedback and any suggestions for improving this feature.
GitHub Copilot
Copilot Agent Mode
Copilot Agent Mode is the next evolution in AI-assisted development and has moved out of preview.
Agent Mode unlocks a new way to build with GitHub Copilot, going beyond single-turn prompts to handle entire tasks from start to finish.
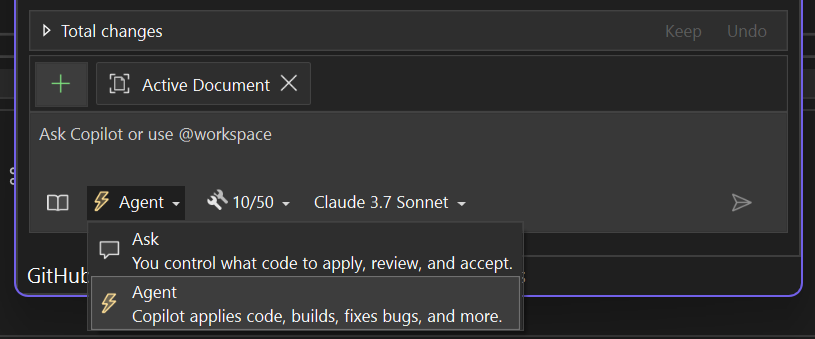
To get started, open Copilot Chat, click Ask, then switch to Agent.
From idea to code
Agent Mode understands your intent, creates a plan, pulls in the right context, and takes action. It can fix bugs, edit files, and build your solution - all from a single prompt until your goal is reached.
With MCP integration, Agent Mode can also pull in rich context from your connected systems - like GitHub, CI pipelines, or monitoring dashboards - to take even smarter actions.
Try it out and see what improvements it can offer!
Important
Activate GitHub Copilot Free and unlock this and other AI features. No trial. No credit card. Just your GitHub account.
Copilot Agent Mode Improvements
Copilot Agent Mode is the next evolution in AI-assisted development and has moved out of preview.
Over the past few months, we've made significant updates to Agent Mode to improve reliability, responsiveness, and overall usability. Here are some of the improvements we've shipped:
Performance & Reliability
- Agent Mode now shows clearer progress indicators, so you always know what's happening behind the scenes.
- Improved prompt caching to speed up response times.
Working Set & File Management
- The working set now stays hidden when empty, and only shows a file count when relevant.
- Rejected files are automatically deleted from disk and removed from the working set.
- Items marked with no changes are now sorted to the bottom to reduce clutter.
Prompting & Planning
- Updated prompt formatting improves Agent Mode performance with GPT-5 models.
- We're testing a new planning tool that lets the model break down complex requests into smaller, trackable steps using a live-updating markdown file. Early benchmarks (including SWE-bench) show significant gains on multi-step tasks.
Build & Tool Control
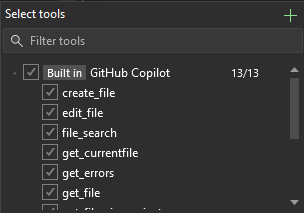
- You can now disable automatic builds in Agent Mode. Open the tools menu next to the chat prompt and deselect
run_buildto take manual control.Fixes & General Improvements
- Cancelling an Agent Mode request now works more reliably.
- Resolved several issues where Agent Mode could stall or hang during tool execution.
We're shipping updates every sprint. If you haven't used Agent Mode in a while, now's a great time to try it again. The experience is faster, smoother, and more stable - and we're just getting started.
Important
Activate GitHub Copilot Free and unlock this and other AI features. No trial. No credit card. Just your GitHub account.
GPT-5 model support 📣
GPT-5 offers faster responses and even better performance for writing and understanding code.
We're excited to share that GPT-5 has landed in Visual Studio for everyone. It's faster and even better at helping you read, write, and refactor code. We can't wait to see what you build with it.
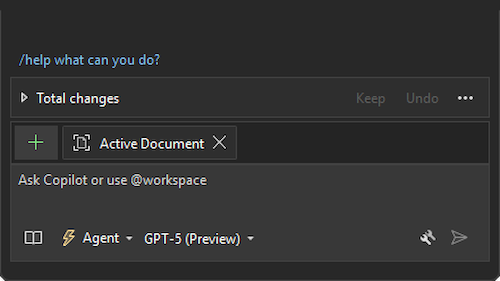
Click the Copilot badge in your IDE, open chat, and pick GPT-5 (Preview) to try it out.
📣 See feature ticket to share your feedback and continue the conversation.
Important
Activate GitHub Copilot Free and unlock this and other AI features. No trial. No credit card. Just your GitHub account.
MCP Support is generally available
MCP support is generally available in VS, enabling seamless connection of your entire engineering stack directly into Copilot for a more powerful development experience.
We are excited to announce that MCP support is now GA in Visual Studio! Expand the power of agent mode through rich, real-time context from your whole development stack.
Model Context Protocol (MCP) is a protocol designed to seamlessly connect AI agents with a variety of external tools and services, similar to how HTTP standardized web communication. The aim is to enable any client to integrate robust tool servers such as databases, code search, and deployment systems, without writing custom connections for each tool.
With our GA announcement, we are bringing a whole new set of exciting features, with even more soon on the way, to make MCP easier than ever before to access and manage server configurations.
Full Authentication Specification support for remote servers (with any OAuth provider)
VS now supports the new MCP authorization specification, meaning that OAuth support is now included for any and all OAuth providers. Previously, Visual Studio supported authentication for remote servers through integration with the VS Keychain. Now, in the August release of VS, authentication with any OAuth provider is supported for remote MCP servers. Just simply select Manage Authentication for any server from the CodeLens in the .mcp.json file, and you will be redirected to a browser pop-up to easily provide your credentials for the necessary OAuth provider for that server.
Easier ways to add new MCP servers
With the GA release of MCP in VS, we're adding two new ways to add connections to new MCP servers. No more need to copy and paste JSON snippets manually into a .mcp.json file. MCP support is now truly a first-class experience in VS with these new features:
One-click install from the web
Have you ever noticed buttons in MCP server repos that say 'Install in VS Code', and wondered when support for this simple functionality would come to VS? Well your questions have been answered! Visual Studio now supports one-click server installation from the web. With this new functionality, adding new MCP servers in VS is as simple as the click of a button. Be on the lookout for Install in VS buttons to start appearing in the repos for your favorite MCP servers! If you would like to add a button like this to your own MCP server repo, or you notice one missing from your favorite public server repo, you can create one using the following protocol handler template: vsweb+mcp:/install, followed by the server metadata.
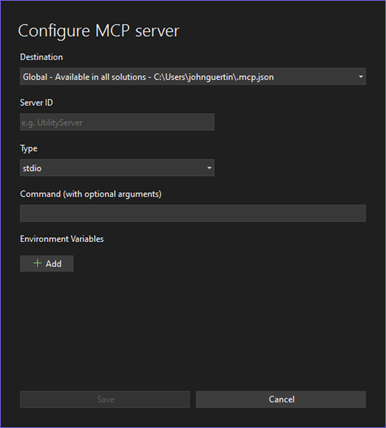
Add server UI flow
We've made it easier than ever to add connections to new MCP servers with our new add flow. Whether it's a server you found online, or a custom built MCP server for your organization, you no longer need to manually copy, paste, and configure JSON to connect to new servers. To access this flow, simply click the new green plus button icon in the tool picker window in GitHub Copilot Chat.
Simply specify the name of the server, the input method, any arguments, or URL for HTTP servers, and seamlessly add the connection.
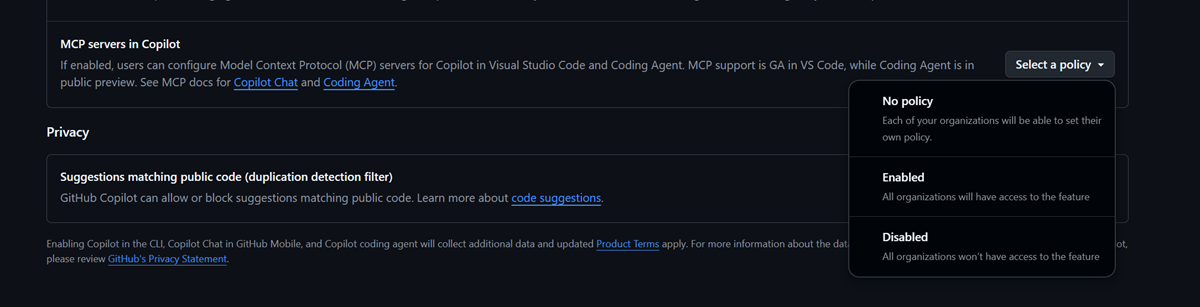
MCP Governance policy support
We understand that organizations may have different policies and through a new integration with GitHub policy, enterprises and organizations can now have fine grained control over access to MCP functionality within their organizations. Your IT admin can now simply navigate to your GitHub policy settings, and toggle on or off MCP features for all users.
Important
Activate GitHub Copilot Free and unlock this and other AI features. No trial. No credit card. Just your GitHub account.
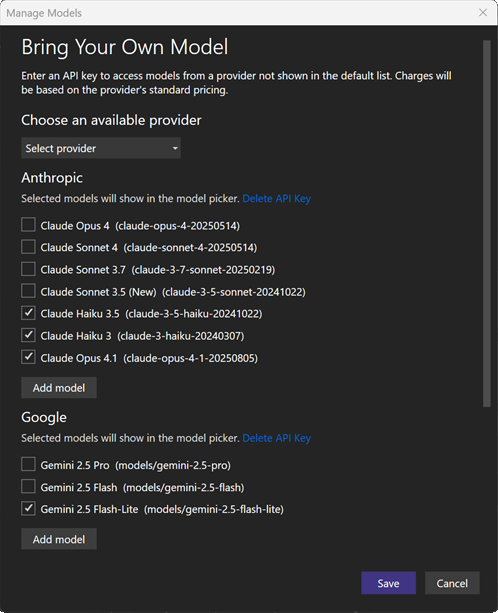
Bring your own model to chat
You can now connect your own language models to Visual Studio Chat, giving you more choice, control, and customization over your AI experience.
You can now connect your own language models to Visual Studio Chat, giving you more choice, control, and customization over your AI experience.
Use API keys from Anthropic, Google, or OpenAI to try the latest releases, run models that meet your security or performance needs, and switch easily between built-in and custom options.
Getting started:
- Open the Chat Window → Select Manage Models from the model picker > add your provider and key.
Available for Chat only. Not supported for Copilot Business or Enterprise. Model capabilities vary.
More providers and features are coming soon, helping you build with the AI that works best for you.
Important
Activate GitHub Copilot Free and unlock this and other AI features. No trial. No credit card. Just your GitHub account.
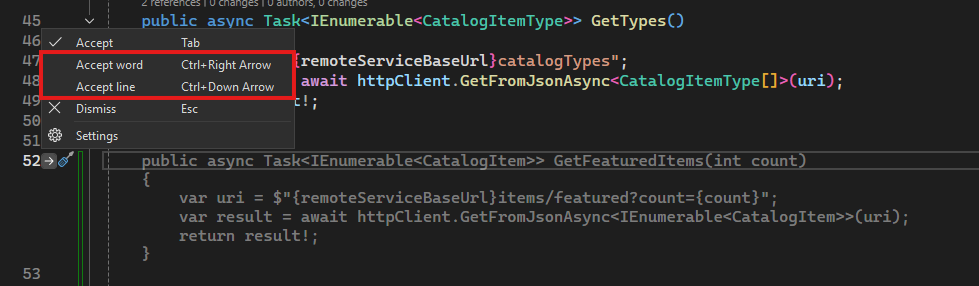
Accept code completions partially 📣
Accept Copilot code completions word by word or line by line using shortcuts or the margin indicator for precise control.
Have you ever wanted to only accept the first couple words or lines of a Copilot code completions instead of accepting the whole thing? We are excited to announce that starting Visual Studio 17.14.13, you will be able to partially accept a completion word by word or line by line!
When having a Copilot code completion in the editor.
- Use the shortcut Ctrl+Right Arrow to accept one word at a time,
- Use the shortcut Ctrl+Down Arrow to accept one line at a time.
You can also use the margin indicator to accept the completion partially. When clicking on the margin indicator, it will have options for partial accepts too.
Now you will have more fine grained control over how much code completions you would like to accept instead of having to accept the entire suggestions and edit afterwards.
Note: Partial accept overrides the existing functionality that bind to these shortcuts. If you would like to turn it off, please go to Tools → Options → IntelliCode → Advanced → Whole-line completions.
📣 See feature ticket to share your feedback and continue the conversation.
Important
Activate GitHub Copilot Free and unlock this and other AI features. No trial. No credit card. Just your GitHub account.
Hiding Next Edit Suggestions by default
Hide Next Edit Suggestions automatically and only review it when you interact with it.
Want to be focused when coding and not seeing next edit suggestions (NES) popping up automatically? We hear you that sometimes Copilot suggestions can be a bit distracting when appearing unexpectedly, and now in Visual Studio you can hide NES by default and only review them when you want to.
NES will still be triggered based on your edits and when there is an available NES ready for you to review, a margin indicator will pop up in the gutter space, pointing at the line that it has a suggestion for. To view this suggestion, you can either:
- Click the margin indicator or
- Press
Tabkeyand the suggestion will be displayed. Then, after viewing the suggestions, you can press
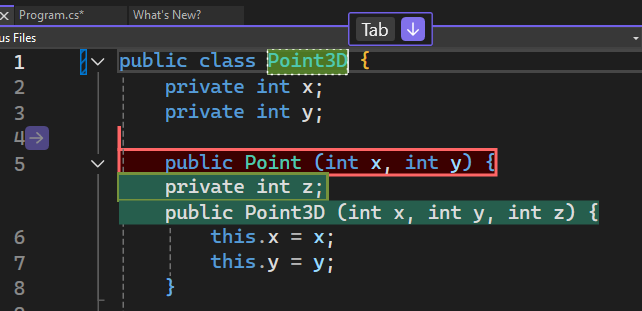
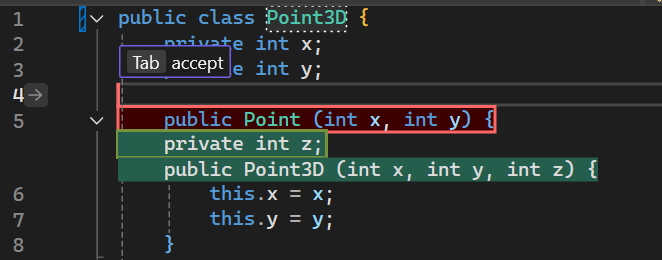
Tabagain to accept it or pressESCto dismiss it. After you accept a suggestion, any related suggestions will automatically appear again, as you might find them useful too. Any other new suggestions that are not related to your previously accepted suggestion will be hidden again.For example, in the video below, after changing
PointtoPoint3D, a NES is available but not displayed directly. The margin indicator and hint bar shows that there is a suggestion on line 4 and then I clicked on the indicator to review it.
To try out this experience, go to Tools → Options → GitHub → Copilot → Copilot Completions and check Collapse Next Edit Suggestions.
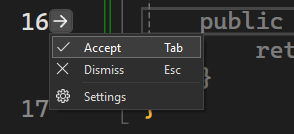
You can also configure it via the shortcut provided by the context menu in the margin indicator. Whenever there is a code suggestion ready for you in the Editor (no matter it's from Copilot or IntelliCode), a margin indicator will pop up and point at the corresponding line. When clicking on the indicator, a context menu will appear, giving you multiple ways to interact with the code suggestion:
- Accept (click Accept or press
Tab)- Dismiss (click Dismiss or press
ESC)- Settings: You can open the GitHub Copilot Completions settings page directly from here.
Please let us know in Developer Community if you have any feedback!
Important
Activate GitHub Copilot Free and unlock this and other AI features. No trial. No credit card. Just your GitHub account.
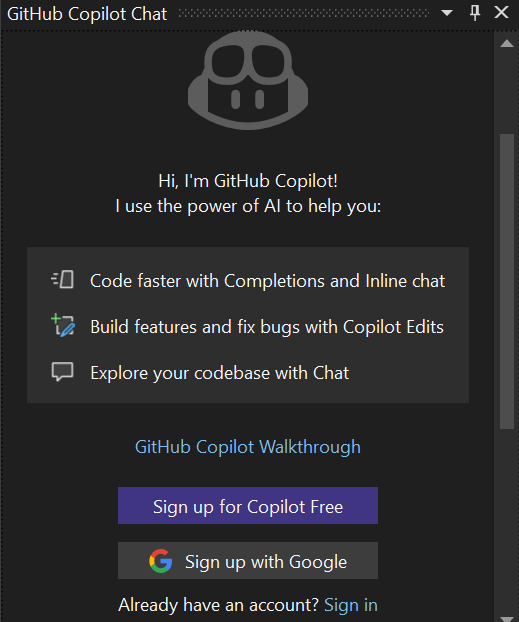
Sign up for Copilot with your Google account
You can now sign up to use Copilot with your existing Google account!
New to Copilot? You can now sign up for Copilot using your Google account!
GitHub now supports social login with Google, and you can link your new account right from Visual Studio.
Click the Sign up with Google button from the Copilot Chat window to streamline your Copilot set up with your Google account!
Important
Activate GitHub Copilot Free and unlock this and other AI features. No trial. No credit card. Just your GitHub account.
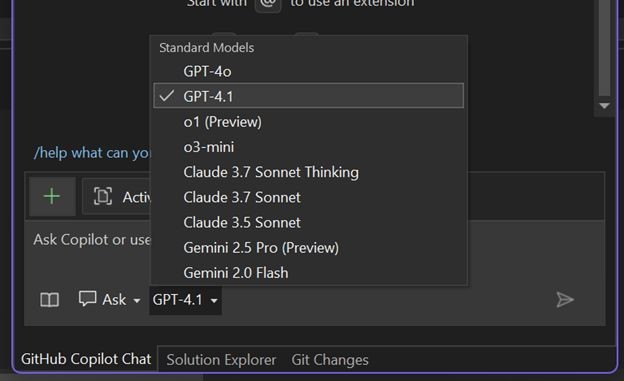
Gemini 2.5 Pro and GPT-4.1
New Models just dropped in Visual Studio Chat.
More power, speed, and flexibility - all within your IDE!
🚨 Gemini 2.5 Pro is now in Visual Studio
Gemini 2.5 Pro, widely regarded as one of the top-performing models available, is now supported in Visual Studio. It joins GPT-4.1, GPT-4o, Claude Sonnet 3.7, Claude Sonnet 3.5, and o3 mini to bring a truly versatile multi-model AI experience to your IDE.
🚨 GPT-4.1 is now the default
GPT-4.1 is now the default model in Visual Studio, offering a faster, more responsive, and noticeably smoother experience across the board.
You can now select the best model for the task, code, and workflow at hand. Try them out and let us know what you think!
Important
Activate GitHub Copilot Free and unlock this and other AI features. No trial. No credit card. Just your GitHub account.
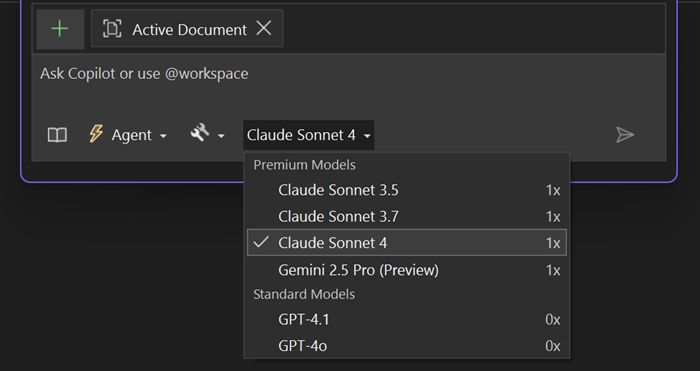
Claude Sonnet 4 and Claude Opus 4
Claude Sonnet 4 and Claude Opus 4 are now generally available in Visual Studio, offering enhanced AI capabilities.
We're excited to announce that Claude Sonnet 4 and Claude Opus 4 are now generally available to all Visual Studio customers!
- Use Claude Sonnet 4 in Agent Mode for faster, more focused interactions.
- Try both Claude Sonnet 4 and Opus 4 in Ask Mode for deeper reasoning.
To get started, open Chat in Visual Studio, select the model picker, and choose the Claude model that fits your workflow.
Important
Activate GitHub Copilot Free and unlock this and other AI features. No trial. No credit card. Just your GitHub account.
MCP server support
Connect Visual Studio to AI agents using the new Model Context Protocol (MCP), a standardized way to share context, access data, and drive intelligent features.
Visual Studio now supports MCP servers, unlocking smarter and more connected AI development. MCP is an open protocol that standardizes how apps and AI agents share context and take action.
With MCP in Visual Studio, you can do more than just retrieve information from your MCP servers, such as logs, test failures, PRs, or issues. You can also use that information to drive meaningful actions in your code, your IDE, and even your connected systems across your stack.
Set Up Your MCP Server
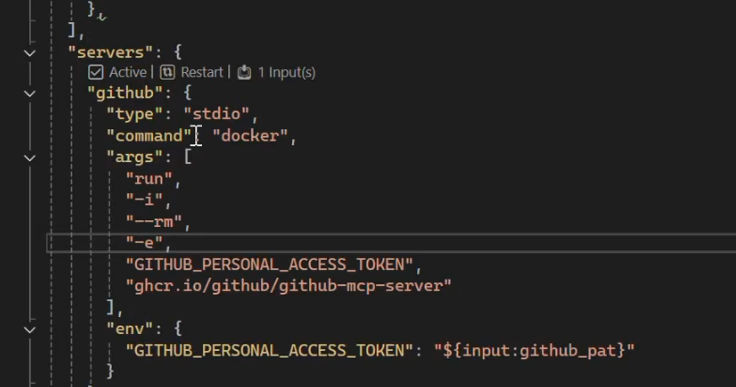
Add an
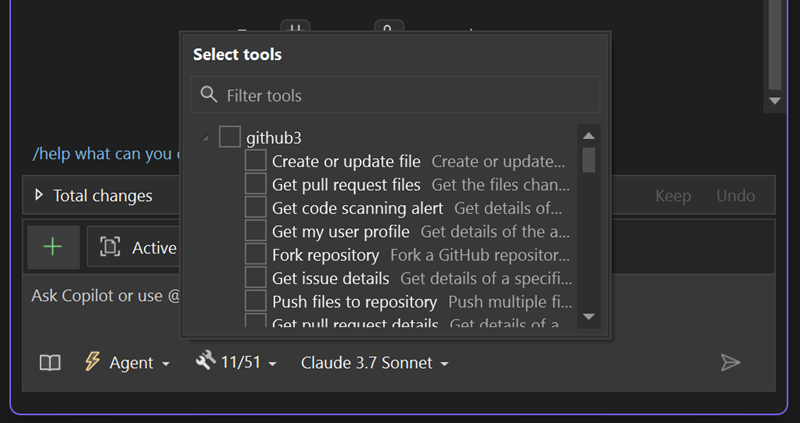
mcp.jsonfile to your solution, and Visual Studio will detect it automatically. It also recognizes configs from other environments like.vscode/mcp.json.Use Your MCP Servers
Open the Tools dropdown in the Copilot Chat panel to view connected MCP servers. From there, Copilot can pull in context and take action using your existing systems.
Note: You will need to be in Agent Mode to access and interact with MCP servers.
Bring the full power of your stack into Copilot without leaving Visual Studio!
Important
Activate GitHub Copilot Free and unlock this and other AI features. No trial. No credit card. Just your GitHub account.
MCP Server July Update
Enhanced MCP server integration in Visual Studio enables seamless connection of your entire engineering stack directly into Copilot for a more powerful development experience.
We've made significant improvements to MCP server integration in Visual Studio to help you unlock a more powerful, connected engineering stack.
Set Up Your MCP Server
Add an
mcp.jsonfile to your solution - Visual Studio will detect it automatically (we also support.vscode/mcp.json). Start and manage servers directly with CodeLens controls at the top of each server block. Easily restart, run, and control inputs from within the editor.With seamless authentication via keychain support, you can now authenticate with supported MCP servers directly in Visual Studio using your existing keychain credentials - no additional configuration needed.
Use Your MCP Servers
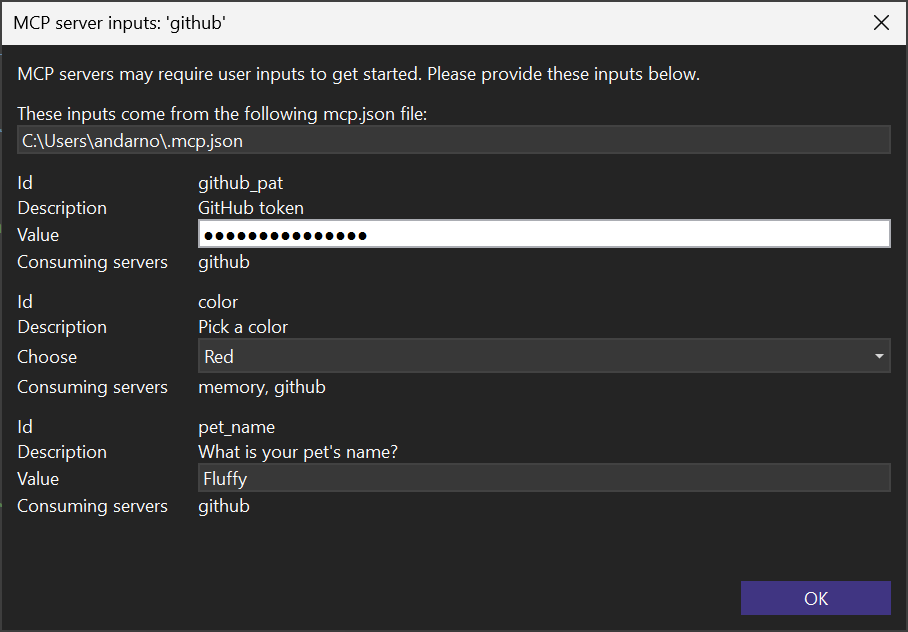
Open the Tools dropdown in the Copilot Chat panel to view connected MCP servers and manage them by selecting the arrow to reveal the new menu. From there, you can manage server inputs in our new modal dialog. Copilot can then pull in context and take action using your existing systems.
Note: You will need to be in Agent Mode to access and interact with MCP servers.
Visual Studio now supports the new Authentication protocol for MCP servers
With seamless authentication via keychain support, you can now authenticate with supported remote MCP servers directly in Visual Studio using your existing keychain credentials - no additional configuration needed. This is currently supported for GitHub and Entra ID accounts, with support for additional OAuth providers coming in a later update.
Codelens support for MCP servers
Visual Studio now supports CodeLens for MCP servers, allowing you to start and manage servers inputs and authentication directly from the editor. This makes it easier to control your development environment without leaving your code.
Bring the full power of your stack into Copilot without leaving Visual Studio!
Important
Activate GitHub Copilot Free and unlock this and other AI features. No trial. No credit card. Just your GitHub account.
MCP Prompts, Resources, and Sampling
Visual Studio now supports MCP prompts, resources, and sampling to enhance your Copilot experience by connecting to your engineering stack.
We are excited to announce that Visual Studio now supports MCP prompts, resources, and sampling to enhance your Copilot experience by bringing in more context from your engineering stack.
MCP Prompts and Prompt Templates
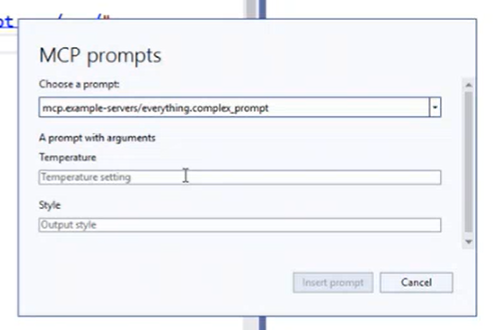
The Model Context Protocol provides a standardized way for servers to expose prompt templates to clients. MCP Prompts allow servers to provide structured messages and instructions for interacting with language models that are catered to the use case and content of the server in question, guaranteeing that you will get the best responses for a certain task. Visual Studio now allows you to discover available prompts, retrieve their contents, and provide arguments to customize them.
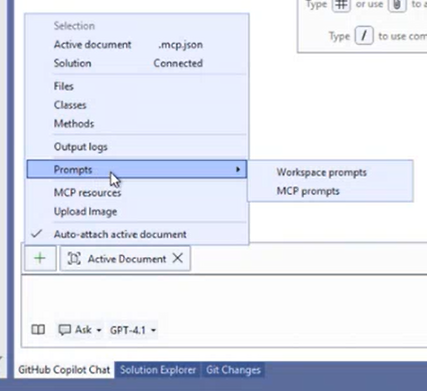
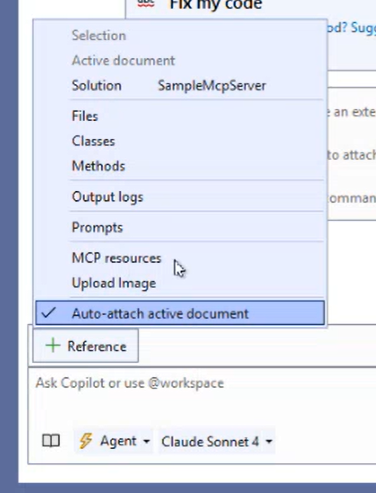
To reference any prompts that may come from an MCP server, you can locate them using the + Reference button in chat, and then selecting the Prompts option, and then selecting MCP prompts from the flyout.
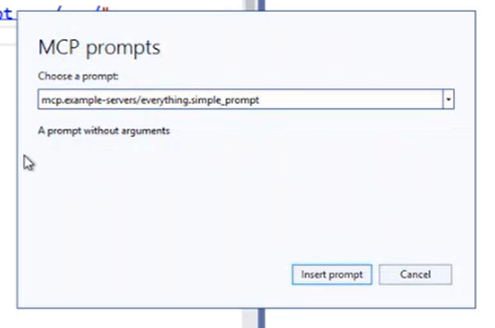
From there, you will be presented with a modal dialog that allows you to select the prompt you would like to use. You can then click, Insert Prompt to include the text from this prompt in chat.
Some MCP prompts will have arguments that you can fill in to customize the prompt for your specific needs. These are known as prompt templates. If you select a prompt in the modal dialog that contains arguments, you will be able to specify those values before you insert the prompt into chat.
MCP Resources and Resource Templates
Model Context Protocol (MCP) also provides a standardized way for servers to expose resources to clients. Resources allow servers to share data that provides context to language models, such as files, database schemas, or application-specific information. Each resource is uniquely identified by a URI. This allows you to get even more out of your MCP servers, and pull in context that is related to them directly in the IDE.
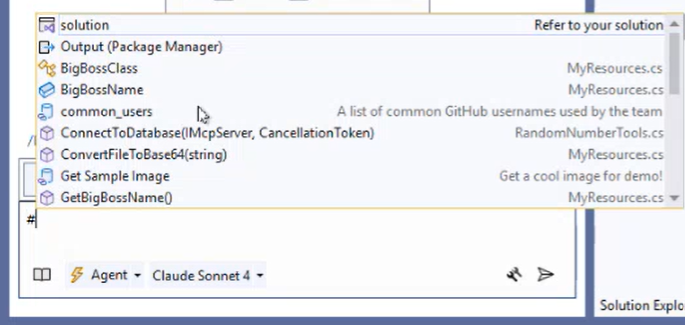
To use any MCP resources that might be available to you, you can reference them in Copilot chat in the same way you would reference any other piece of context, such as a file: with a hashtag (#) followed by the resource URI.
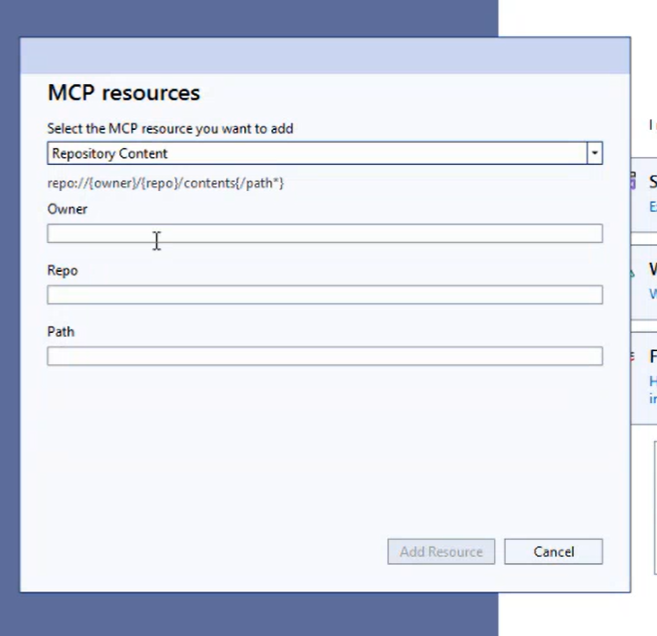
Just like with prompts, MCP resources can also have arguments that you can fill in to customize the resource for your specific needs. These are known as resource templates. If a server in question has resource templates that you would like to take advantage of, you can configure them using the + Reference button in chat, and then selecting the new MCP resource option from the menu.
From there, you will be presented with a modal dialog that allows you to select the resource template you would like to use, and fill in any arguments that it might have. Once you are done, you can click Add Resource to make this MCP resource referenceable in chat just like any other MCP resource, as described above.
MCP Sampling
Sampling in MCP allows servers to implement agentic behaviors, by enabling LLM calls to occur nested inside other MCP server features. This feature in the Model Context Protocol spec allows an MCP server to make a request of an LLM, rather than the typical workflow of an LLM requesting content or information from an MCP server. Visual Studio now supports just that, and allows your MCP servers to go a level deeper to perform more complex tasks on your behalf (all with your permission, of course!).
There is nothing to configure to take advantage of sampling, as long as your MCP server supports it, Visual Studio will too. If Copilot determines that a request that you send would benefit from a sampling call, you will first see a dialog, containing all details of the request, and asking you to confirm the sampling call before anything happens behind the scenes.
Important
Activate GitHub Copilot Free and unlock this and other AI features. No trial. No credit card. Just your GitHub account.
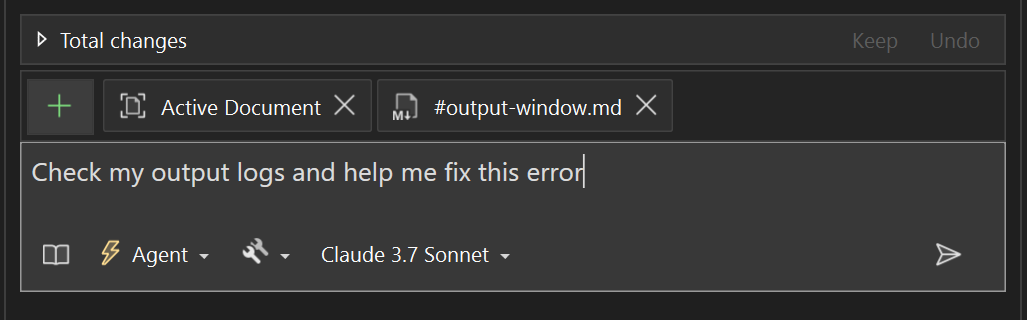
Copilot output window context
You can now reference the Output Window as context in Copilot Chat.
We know the Output Window is essential for tracking builds, debugging, and understanding what is going on under the hood. Now, Copilot can read that information - so you can ask questions, get help, and take action based on your output logs.
How to Use It
- Use
#outputto reference it directly in chat.- Click the ➕ icon in the chat input to add it as context.
- Ask Copilot directly: Check my output logs and help me fix this error.
- Or right-click in the Output Window and choose Explain with Copilot to attach it instantly.
Try it out and see how much easier it is to read and act on your logs!
Important
Activate GitHub Copilot Free and unlock this and other AI features. No trial. No credit card. Just your GitHub account.
Copilot suggestions on demand 📣
Only receive code suggestions when you explicitly request them in Visual Studio.
Want to be more in control of code suggestions that pop up in your editor? Now in Visual Studio, you can opt out of automatic code suggestions and only receive suggestions when you explicitly request them.
You can configure the trigger for code suggestions in Tools → Options → IntelliCode → General. The default experience is Automatically generate code completions in the Editor and you can uncheck this setting to only receive suggestions when you explicitly request them by pressing Alt+, or Alt+.. If there are multiple code suggestions available after requesting, you can cycle through them by pressing Alt+, and Alt+. as well.
When triggered, a thinking hint bar will appear at your cursor position to indicate that Copilot is generating code suggestions. If no suggestions returned, the hint bar will disappear after a few seconds. If suggestions are available, you can accept them by pressing
Tab.
Now, you can better customize your code suggestion experience in Visual Studio with this new setting. For example, when you want to be focused with minimum distraction, you can uncheck this setting and change it back when you want to receive more suggestions effortlessly. Please share any feedback with us, and let us know any other ways you want to customize your Copilot code suggestions experience!
📣 See feature ticket to share your feedback and continue the conversation.
Important
Activate GitHub Copilot Free and unlock this and other AI features. No trial. No credit card. Just your GitHub account.
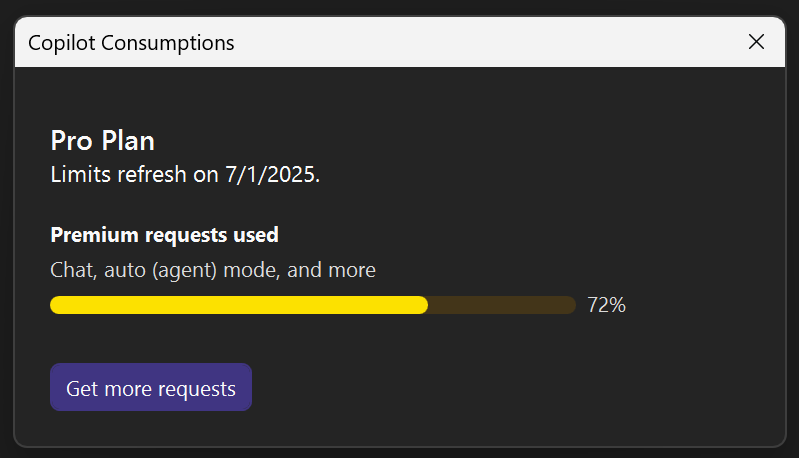
See your Copilot usage
You can now track your Copilot usage directly in Visual Studio.
Want to know how much you've used Copilot this month? Visual Studio now includes a Copilot Consumptions panel to easily track your usage!
Whether you're using Copilot Free or a paid plan, you can check your number of chat requests and code completions right from the IDE.
Access it by clicking the Copilot badge in the top-right corner of your IDE and selecting Copilot Consumptions.
This opens a panel showing your current usage for the month.
Tip: If you're using premium models, you'll also see usage multipliers listed in the model picker, so you always know exactly what you're using.
Important
Activate GitHub Copilot Free and unlock this and other AI features. No trial. No credit card. Just your GitHub account.
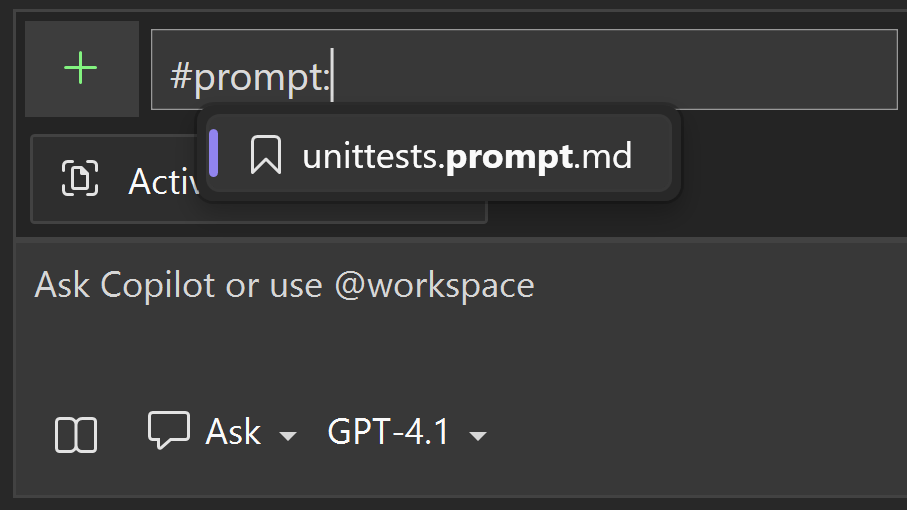
Save or share your prompts
You can now create reusable prompt files in your repository to quickly run or share your frequently used prompts.
Writing effective prompts can be time-consuming, but it's the key to getting the most out of Copilot Ask and Agent mode. We've enabled reusable prompt files so you can leverage great prompts again and again. From there, you can run them quickly from the chat window or share them with your team.
How to write prompt files
- Write your prompts the way you normally would in the prompt box, attaching # references to add specific information from your solution like methods, classes, and files. You can even reference other prompt files to include common base instructions.
- Copy it from the prompt box into a markdown file, and save it with the .prompt.md file extension in the root of your repository in the
.github/promptsfolder.Tip: You can even get Copilot's help refining your prompt to be more specific.
How to run your prompts
- Start typing
#prompt:to reference all the prompt files from your.github/promptsfolder directly in chat or click the ➕ icon in the chat input to add it as context.- Add any additional information in the prompt box or just send the prompt!
Give it a try and speed up your AI workflows!
📣 Take this survey to help make the feature even better.
Important
Activate GitHub Copilot Free and unlock this and other AI features. No trial. No credit card. Just your GitHub account.
GitHub Copilot Walkthrough
GitHub Copilot Walkthroughs are now available in Visual Studio to help you get up and running quickly. Walkthroughs guide you through using key Copilot features directly in your editor.
We're excited to introduce the GitHub Copilot Walkthrough in Visual Studio! The walkthrough is an interactive guide built right into your editor, helping you explore GitHub Copilot's capabilities step by step. Whether you're new to GitHub Copilot or want to learn about its latest features, the walkthrough makes it easier than ever to get started.
Getting started with walkthroughs
Launch Copilot Walkthroughs from Visual Studio by going to Copilot button (upper right) → GitHub Copilot Walkthrough.
You'll see guided activities that introduce different parts of the Copilot experience, such as:
- Writing prompts in Chat
- Using inline code completions
- Accepting, editing, or rejecting Copilot suggestions
- Exploring and learning about new features like Copilot Edits
The walkthrough is a great way to get a high-level understanding of what Copilot can do before diving deeper into documentation and hands-on usage.
How to access walkthroughs
The GitHub Copilot walkthrough opens automatically the first time you sign into GitHub Copilot, making it super easy to get started. To revisit it later, go to GitHub Copilot → GitHub Copilot Walkthrough in Visual Studio.
Whether you're exploring GitHub Copilot for the first time or just need a quick refresher, this walkthrough is your friendly guide to unlocking the full potential of Copilot. Dive in and start creating with confidence!
Important
Activate GitHub Copilot Free and unlock this and other AI features. No trial. No credit card. Just your GitHub account.
Improvements to C++ code completions
We have added new updates to Copilot code completions for C++ in Visual Studio to provide more accurate code suggestions.
We have been working to improve the quality of C++ GitHub Copilot completions.
Now, Copilot can detect even more relevant context in C++ projects in order to provide more accurate code suggestions in Visual Studio for your specific codebase.
Important
Activate GitHub Copilot Free and unlock this and other AI features. No trial. No credit card. Just your GitHub account.
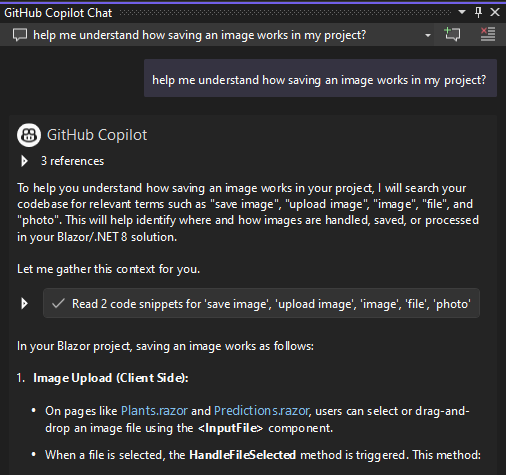
Better semantic code search for Copilot
Context improvements help you find the correct code to reference or update, boosting your everyday tasks with Copilot.
Copilot Chat keeps getting smarter with improved context for your everyday tasks. You can expect better overall responses since the core code search capabilities have been enhanced to provide more relevant results. Now, Copilot is even better at retrieving the right code snippets related to behaviors, concepts, or functionality described in natural language. These improvements are thanks to leveraging remote indexes of your codebases.
Important
Activate GitHub Copilot Free and unlock this and other AI features. No trial. No credit card. Just your GitHub account.
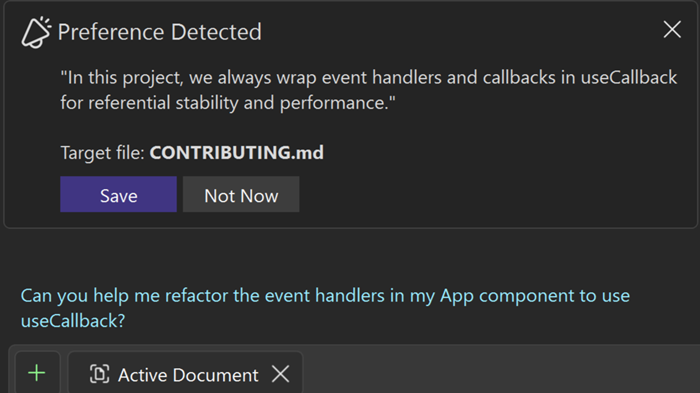
Copilot memories 📣
Make Copilot truly project-aware by teaching it your team's coding standards and best practices - creating consistency that lasts across sessions!
For Copilot to work effectively for your unique team and repository, it needs to learn about your project and team best practices. Copilot memories enable Copilot to understand and apply your project's specific coding standards, making it project-aware and consistent across sessions.
How Copilot memories work
Memories use intelligent detection to understand your team's preferences as you prompt in the chat. That means, as you prompt how you normally would, Copilot is looking for instances where you correct its behavior, explicitly indicate a standard, or ask it to remember something. When detected, you'll see a confirmation nudge to save the preference. Copilot will then categorize the preference into one of three files:
.editorconfigfor coding standardsCONTRIBUTING.mdfor best practices, guidelines, architectural standards, etc.- and
README.mdfor high level project informationSo, as you prompt, you're not only teaching Copilot how to respond better to you in the future, but you're also helping out your team by documenting your development best practices, and augmenting their future Copilot responses as well!
📣 See feature ticket to share your feedback and continue the conversation.
Important
Activate GitHub Copilot Free and unlock this and other AI features. No trial. No credit card. Just your GitHub account.
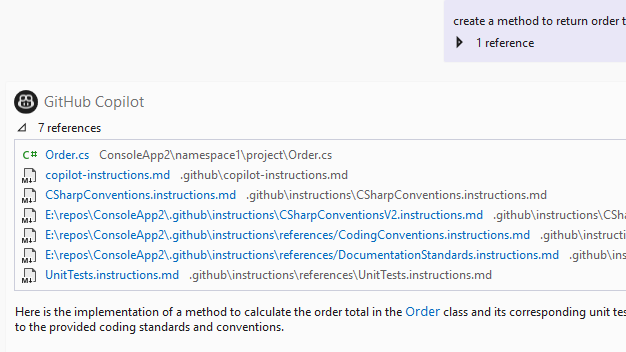
Target your Copilot instructions
You can now create composable instruction files to target custom instructions to specific areas of your codebase.
Getting Copilot to respond the way you want can be a challenge. You may have different coding standards, best practices, or architectural patterns in different areas of your codebase. With instruction files, you can now target specific instructions to specific folders or files in your repository, making Copilot truly project-aware and consistent across sessions.
Enable the feature
Turn on the feature at Tools > Options > GitHub > Copilot > Copilot Chat > Enable custom instructions to be loaded from .github/instructions/*.instructions.md files and added to requests.
Write instruction files
- Format your instructions with the
applyToheader and specify a glob pattern for which files you want these instructions to be included for.--- applyTo: "src/**/*.cs" ---
- In the file body, you can use natural language to specify your content and reference other instruction files to compose instructions together.
- Save the file with the
.instructions.mdfile extension in the root of your repository in the.github/instructionsfolder.Tip: You can even get Copilot's help refining your instructions to be more detailed.
How it works
When you prompt Copilot, it will automatically detect which instruction files apply to the files in your current context and attach them as references. You can see which instructions were attached by clicking on the references in the response card.
Important
Activate GitHub Copilot Free and unlock this and other AI features. No trial. No credit card. Just your GitHub account.
GPT-4o code completion model 📣
Introducing the GPT-4o Copilot code completion model to bring you higher quality completions.
We are thrilled to announce that the new GPT-4o Copilot code completion model is now available in Visual Studio 17.14 for GitHub Copilot users! This advanced model, based on GPT-4o mini, has been further trained on over 275,000 high-quality public repositories across more than 30 popular programming languages. As a result, developers can look forward to more accurate suggestions and enhanced performance.
GPT-4o Copilot access notes:
- Copilot Pro, Business, or Enterprise users: The new model is available for you now in 17.14 and later.
- Copilot Free users: Using this model will count toward your 2,000 free monthly completions.
📣 See feature ticket to share your feedback and continue the conversation.
Important
Activate GitHub Copilot Free and unlock this and other AI features. No trial. No credit card. Just your GitHub account.
AI doc comment generation 📣
Automatically generate doc comments for C++ and C# functions.
Copilot is now seamlessly integrated into Visual Studio's code editor to significantly boost your productivity by generating doc comments for your functions.
With automatic doc comment generation enabled for your project, simply type the comment pattern according to your settings (for example,
///) and Copilot will instantly complete the function description based on the function's content. This feature saves you time and lets you focus more on coding and less on documentation.
This feature is available for both C++ and C# project files, making your coding experience smoother and more efficient.
📣 See feature ticket to share your feedback and continue the conversation.
Important
Activate GitHub Copilot Free and unlock this and other AI features. No trial. No credit card. Just your GitHub account.
Next Edit Suggestion
NES leverages the previous edits made and predicts the next edit to come, whether it's an insertion, deletion, or mix of both.
We are excited to announce Next Edit Suggestions, or NES for short, is now available in Visual Studio to further improve your coding experience. NES leverages the previous edits made and predicts the next edit to come, whether it's an insertion, deletion, or mix of both. Unlike Completions which is limited to generate suggestions at your caret location, NES can support you anywhere in your file, where the next edit is most likely to occur. NES augments the existing Copilot Completions experience by supporting developers' code editing activities.
Getting Started with NES
Enable NES via Tools → Options → GitHub → Copilot → Copilot Completions → Enable Next Edit Suggestions.
Like completions, all you need to do to get NES is to start coding!
When you're presented with an edit suggestion, if it is on a different line than the one you are on now, it will suggest you Tab to Navigate to the corresponding line first. You won't need to manually search for related edits anymore; NES will lead the way!
After you are on the same line as the edit, you can Tab to Accept the suggestion.
Note: You can turn on/off the hint bars by going to Tools → Options → IntelliCode → Advanced → Hide the tip shown with gray text.
In addition to the hint bars, an arrow in the gutter also pops up to indicate that there is an edit suggestion available. You can click on the arrow to explore the edit suggestion menu.
Example Scenarios
Next edit suggestions can be helpful in a variety of scenarios, not only making obvious repetitive changes but also logical changes. Here are some examples:
Refactoring a 2D Point class to 3D Point:
Updating code syntax to modern C++ using STL:
Note that NES is not just making repetitive changes like updating all
printf()tostd::cout, but also updating other syntax such asfgets().
Making logical changes in response to a newly added variable:
NES responds quickly to the new variable, which adds a maximum number of guesses a player can make in a game, and Copilot Completions also jumps in to help.
Important
Activate GitHub Copilot Free and unlock this and other AI features. No trial. No credit card. Just your GitHub account.
Adaptive paste
You can now let Copilot adjust your pasted code to fit the context of your existing code.
When you're pasting code into Visual Studio, there are often additional steps required to make it work seamlessly. Parameters may need to be adjusted to match those already used in your solution, or the syntax and styling may not align with the rest of your document.
Adaptive paste is here to save you time and reduce effort by automatically adjusting the pasted code to fit the context of your existing code, minimizing the need for manual modifications. This feature also supports scenarios such as minor error fixes, code styling, formatting, human and code language translation, and fill-in-the-blank or continue-the-pattern tasks.
For instance, if you have a
Mathclass that implements theIMathinterface, copying and pasting the implementation for theCeilingmethod into the same file will adapt it to implement the not-yet-implemented interface memberFloor.
The Adaptive Paste UI appears when you perform a regular paste {KeyboardShortcut:Edit.Paste}. Press
Tabto request a suggestion, and you'll be shown a diff comparing the original pasted code with the adjusted code.Try it out today by enabling Tools → Options → GitHub → Copilot → Editor → Enable Adaptive Paste.
Important
Activate GitHub Copilot Free and unlock this and other AI features. No trial. No credit card. Just your GitHub account.
Implement with Copilot
You can now let Copilot fully implement your empty C# method.
Today, if you're referencing a method in your C# code that hasn't been implemented yet, you can use a common lightbulb refactoring called Generate Method to immediately create that method in a class. However, this refactoring only creates a method with the correct signature but an empty skeleton and
throw new NotImplementedExceptionline otherwise. This means that while the method technically exists and you have to do less work to create it, you'll still need to implement the method yourself, which can take more time.The Implement with Copilot refactoring aims to make you even more productive in this scenario by allowing you to automatically implement or add the meat to your method with the help of GitHub Copilot. When an empty method only containing a NotImplementedException throw is encountered, you can select the lightbulb (CTRL+.) on that
throwline and select the Implement with Copilot refactoring and Copilot will fill out all the contents of your method based on your existing codebase, method name, etc.
Important
Activate GitHub Copilot Free and unlock this and other AI features. No trial. No credit card. Just your GitHub account.
Debugging & diagnostics
Profiler Copilot Agent
Accelerate Performance Tuning with the New Benchmark project Template and Built-In Profiling support.
We are excited to introduce the Profiler Agent in Visual Studio: a first-of-its-kind AI assistant that helps you understand and fix performance issues without needing to be a profiling expert.
The Profiler Agent works alongside GitHub Copilot to:
- Analyze CPU usage, memory allocations, and runtime behavior
- Surface performance bottlenecks
- Generate BenchmarkDotNet Benchmarks or optimized existing Benchmarks
- Apply suggested optimizations
- Validate improvements all in a guided loop
Getting started is simple. Just ask your question in Copilot Chat (Agent Mode):
Option 1: Tag @profiler
- Example: @profiler Why is my app slow?
Option 2: Ask your question directly without tagging
Example: Why is my frame rate dropping?
(Make sure the Profiler Agent is enabled from the Select Tools menu in Copilot Chat for this option.)
Whether you're new to profiling or a pro, the agentic experience puts powerful, AI-driven diagnostics at your fingertips. No deep knowledge required just real, actionable insights.
Currently supports high CPU usage analysis and .NET object allocations with more scenarios coming soon.
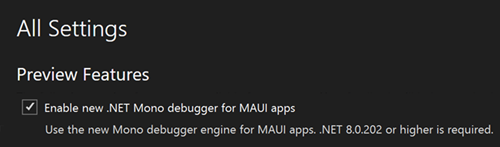
New debugger for .NET MAUI apps
New Mono debug engine for .NET MAUI integrated into the Visual Studio Core debugger.
The new Mono debugger for .NET MAUI apps is an advanced debug engine integrated into the Visual Studio debugger. It offers significant improvements in reliability, performance, and feature parity with the rest of Visual Studio.
Notable enhancements include Just My Code, variables, and expression evaluation.
To use this feature, ensure you have enabled the following Visual Studio Preview option: Enable new .NET Mono debugger for MAUI apps.
Currently, this feature is only available for the Android platform. iOS support is coming soon.
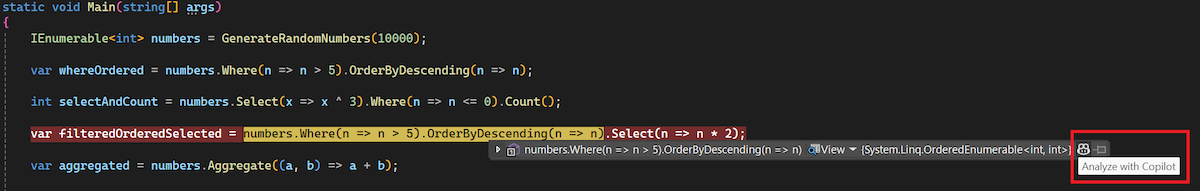
Show datatips for LINQ Expressions 📣
Enhanced LINQ expression debugging experience with clause hovering datatip.
Generating and troubleshooting LINQ queries can be a tedious and intricate process, often requiring precise syntax knowledge and numerous iterations. To alleviate these challenges, Visual Studio 2022 now features a LINQ on-hover DataTip in its debugger.
While you are in a break state during debugging, you can hover over individual clauses or segments of your LINQ query to evaluate the immediate query value at runtime.
Additionally, you can click the GitHub Copilot icon at the end of the DataTip to perform an Analyze with Copilot on the specific query clause you hovered over. Copilot will then explain the clause's syntax and clarify why you are getting the specified result.
This feature can significantly improve efficiency and make your debugging experience smoother and easier, helping you pinpoint issues with LINQ queries faster and streamline your overall development workflow.
📣 See feature ticket to share your feedback and continue the conversation.
Zero-Length Array Allocation Insights
The .NET Allocation Tool now identifies zero-length array allocations, helping optimize memory usage and performance.
The .NET Allocation Tool now provides detailed insights into zero-length array allocations, helping you identify and optimize unnecessary memory usage. While these allocations may seem insignificant individually, they can accumulate quickly and impact performance, especially in high-performance or memory-constrained applications.
With this update, you can investigate zero-length array allocations by clicking the Investigate link, which opens the Allocation View displaying allocation details. Double-clicking reveals code paths where these allocations occur, enabling precise optimizations. To improve efficiency, consider using
Array.Empty<T>(), a statically allocated empty array instance, to eliminate redundant memory allocations.
Git tooling
Better code reviews 📣
Get better GitHub Copilot-powered suggestions for your code changes to help you catch potential issues early and improve your code quality.
Now, with the latest model updates, you can get even better code review comments on your local changes before you even commit!
Same UX with key improvements
Enhanced Comment Quality - newer reasoning models mean more insightful and precise code reviews, catching subtle bugs and performance issues that might be overlooked by traditional methods.
Optimized Comment Generation - by generating comments for the entire change set at once, rather than file-by-file, you get improved performance and a more comprehensive review.
Updated Prompting Techniques - clearer and more direct prompt ensures more accurate and relevant feedback.
Get started
With your Copilot subscription enabled in Visual Studio and the following feature flags enabled, you can see the new sparkle comment button in the Git Changes window. When clicked, Copilot will examine your sets of changes and propose some suggestions inline in your editor.
Ensure you have both of the following feature flags turned on:
- Tools → Options → Preview Features → Pull Request Comments.
- Tools → Options → GitHub → Copilot → Source Control Integration → Enable Git preview features.
📣 See feature ticket to share your feedback and continue the conversation. And take this survey to help make the feature even better.
Note
This feature must be enabled under Tools → Manage Preview Features
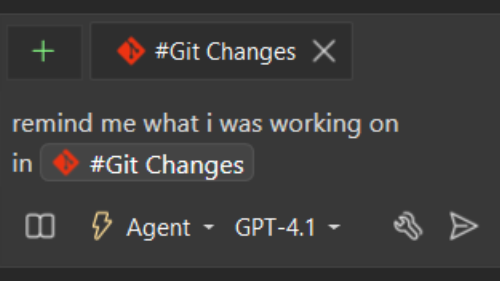
Git context in Copilot Chat
Reference your commits and changes in Copilot chat.
Copilot Chat now supports referencing your commits and changes in the Git Changes window. You can ask Copilot to summarize your changes, explain a specific commit, and more!
Reference your changes
#changeslooks at your uncommitted changes. For example, you can ask Copilot to remind you what you've done so far by referencing your#changes.
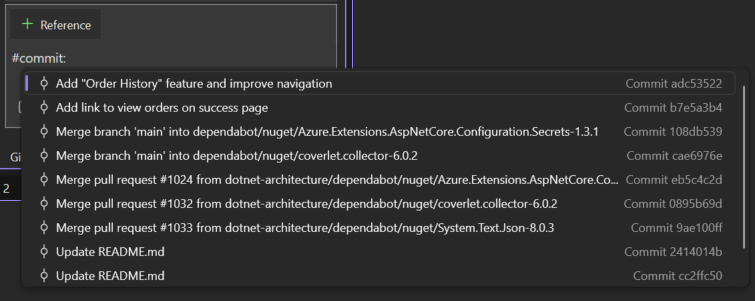
Reference your commits
When you start typing
#commit:, Copilot will show a list of the most recent commits for you to select from. If there's an older commit you want to reference, you can also reference its specific commit ID.
Then ask the chat to use the commit for tasks like write unit tests to cover changes in this commit or find potential issues in this commit.
Try it out
Ensure the following feature flag is turned on to use these references: Tools → Options → GitHub → Copilot → Source Control Integration → Enable Git preview features.
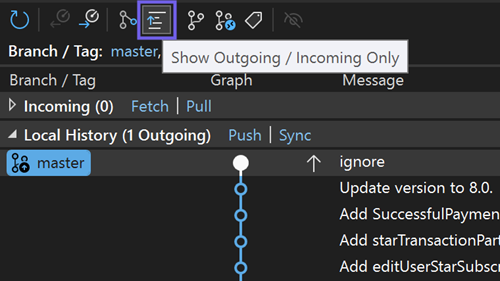
View Outgoing / Incoming Commits 📣
The Git Repository window now provides a filter at its toolbar to show only outgoing / incoming commits.
The Git Repository window is your go-to place to understand your Git history. As you work on a local branch, it may get out of sync with your remote, either because you created new commits (outgoing) or there are new commits to pull (incoming).
With the new outgoing/incoming filter available in the toolbar, you can instantly spot these unsynced commits. Your commits, their commits – scan them with ease and stay perfectly in sync!
📣 See feature ticket to share your feedback and continue the conversation.
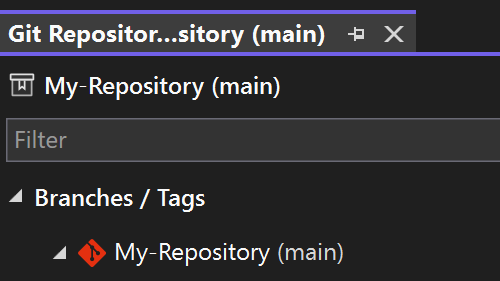
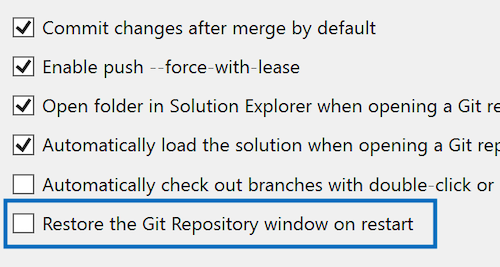
Restore the Git repository window 📣
Keep the Git Repository window open between restarts with this new setting.
As your dedicated environment for branch operations, the Git Repository window is likely at the core of your day-to-day development. If you find yourself frequently reopening it with every Visual Studio session, this update is designed to save you time and effort.
We've added a new setting to Git > Settings that automatically restores the Git Repository window when restarting Visual Studio. Additionally, the window will be included in your saved window layouts, enhancing your customization options.
By default, this feature is off to keep things running smoothly for those who don't need it. But if you like the convenience, this setting is perfect for you.
📣 See feature ticket to share your feedback and continue the conversation.
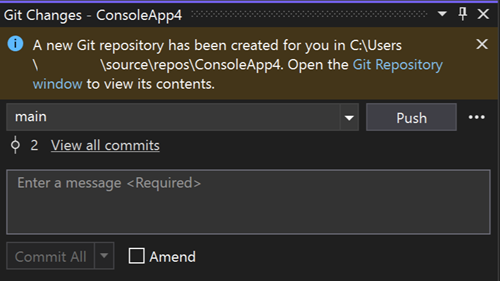
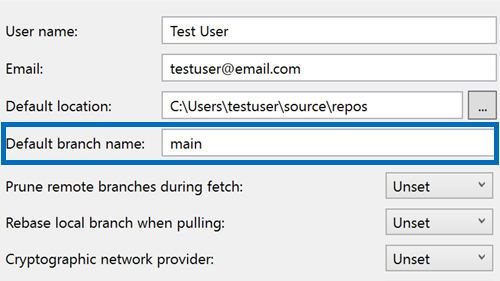
Default branch name 📣
Allow users to customize the initial default branch when a new git repository is created.
You can now set the default branch name for new Git repositories directly through Visual Studio. This new setting integrates smoothly with your Git configuration, making it easier to tailor your workflow to your preferences.
Simply navigate to Git > Settings, and the next time you create a repository, you will see your custom branch name in action.
📣 See feature ticket to share your feedback and continue the conversation.
Desktop
Toolbox support for 32-bit assemblies
Discover your favorite Windows Forms (WinForms) controls present in the Explicit Assembly References automatically added to the Toolbox for .NET Framework projects using the WinForms out-of-process designer.
WinForms out-of-process Designer for .NET Framework projects now supports an enhanced experience by automatically discovering and displaying controls present in standalone assembly references, also known as Explicit Assembly References.
This feature greatly enriches the design time experience for .NET Framework projects referencing legacy 32-bit assemblies. Users can leverage improved tool configurations tailored for better integration with modern development workflows and enhanced productivity. For more details, please read our blog post.
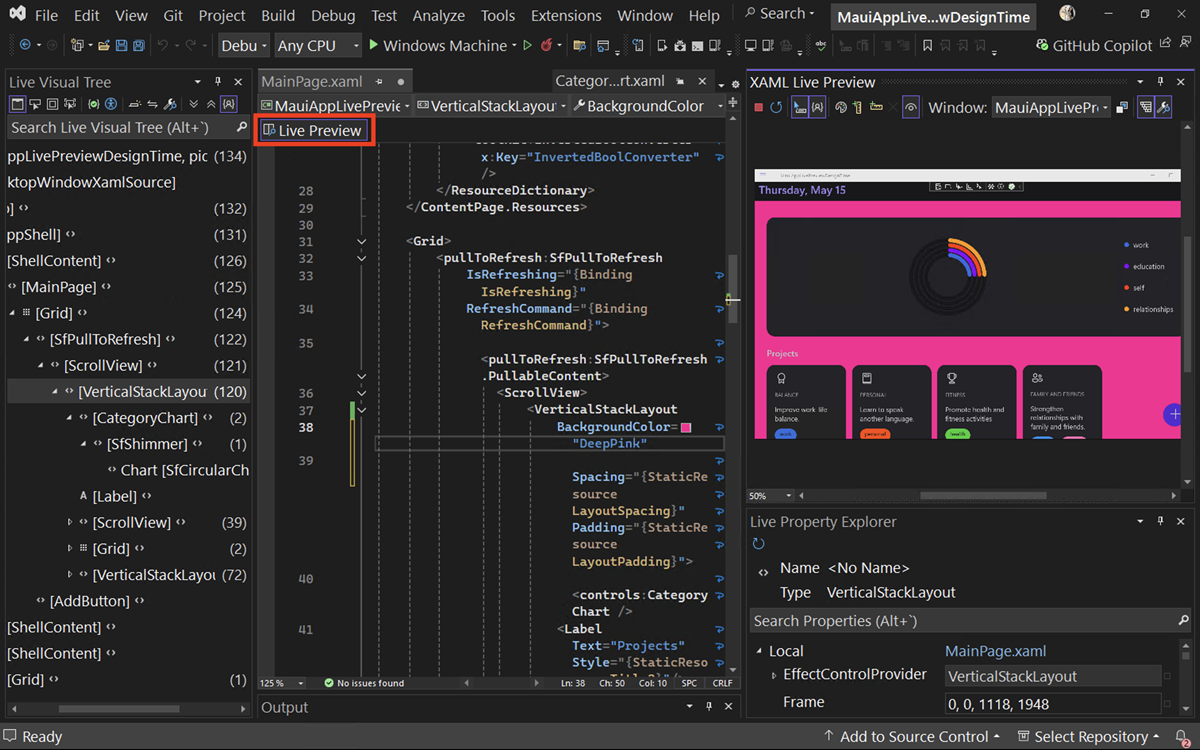
Update your UI, live at design time 📣
Live Preview, Hot Reload, and other UI tools are now available at design time.
Live Preview is now available at design time, allowing you to see changes in your app UI in real-time. You can also use Hot Reload and other live UI tools in this way, ensuring a seamless workflow.
These tools can be used even when detached from the debugger, allowing for uninterrupted experimentation and refinement of your designs.
Click on the new Live Preview indicator to access Live Preview at design time from any XAML file:
Whether you're working on a new .NET MAUI app or refining an existing WPF app, these enhancements will help you deliver high-quality applications faster and with greater confidence.
📣 See feature ticket to share your feedback and continue the conversation.
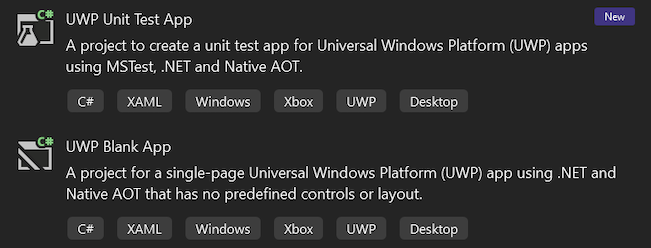
New UWP .NET 9 MSTest project template 📣
Visual Studio now includes an updated UWP MSTest project template targeting .NET 9 and Native AOT.
Visual Studio now includes a new UWP MSTest project template targeting .NET 9 and Native AOT. We worked closely with the MSTest team to add all necessary support for UWP .NET 9 projects to the MSTest libraries, infrastructure, and the Visual Studio test host. This enables UWP test projects to target .NET 9 and leverage all the modern .NET SDK and MSTest tooling while still running in a UWP context as you'd expect.
The previous UWP MSTest project template using .NET Native will still be available. However, we recommend using the new project templates targeting .NET 9 and Native AOT going forward. As in Visual Studio 17.13, we have adjusted the ordering of all UWP templates to prioritize the new .NET 9 project templates in the search results.
📣 See feature ticket to share your feedback and continue the conversation.
.NET
App modernization
GitHub Copilot app modernization now built into Visual Studio.
The GitHub Copilot app modernization agent is an AI-powered tool in Visual Studio that helps you upgrade .NET applications to newer versions and migrate them to Azure.
How to get started
- Open your .NET project or solution in Visual Studio.
- Launch the modernization agent using one of the following methods:
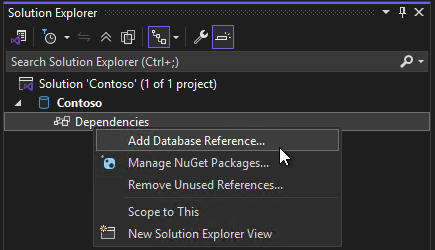
- Right-click the solution or project in Solution Explorer and select Modernize, or
- Open the Copilot Chat window and type
@modernizefollowed by your upgrade request.- Let the
@modernizeagent know what you'd like to upgrade or migrate.With the app modernization agent, it's easier than ever to keep your .NET apps up to date and take advantage of the latest Azure features. Give it a try and see how much time you can save!
C++
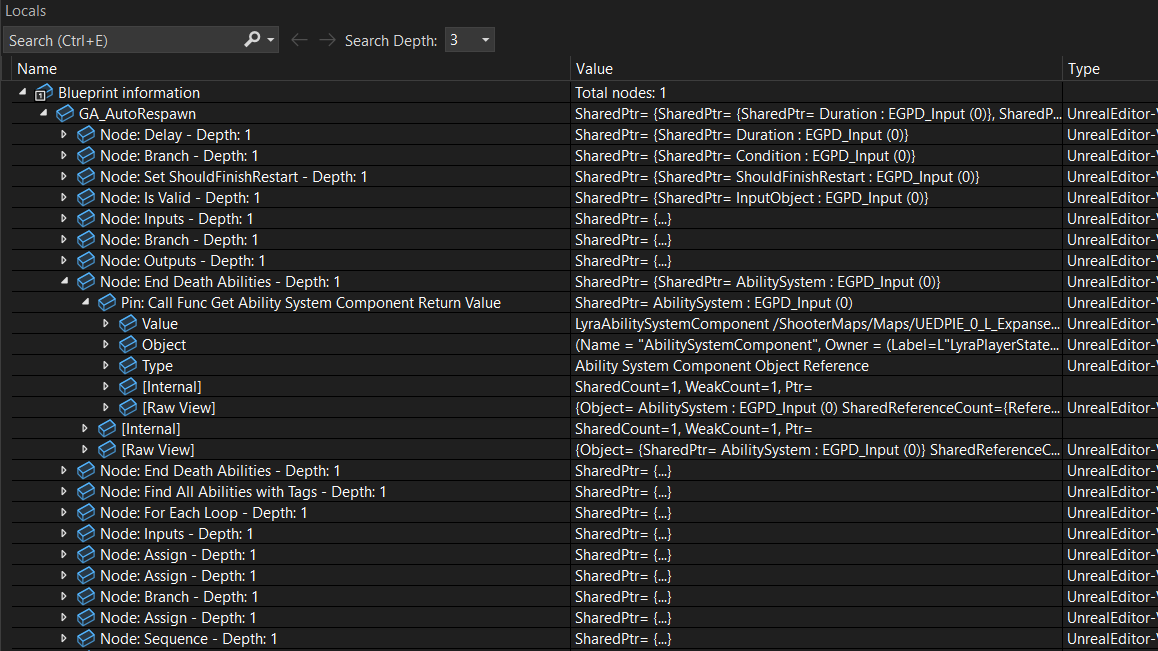
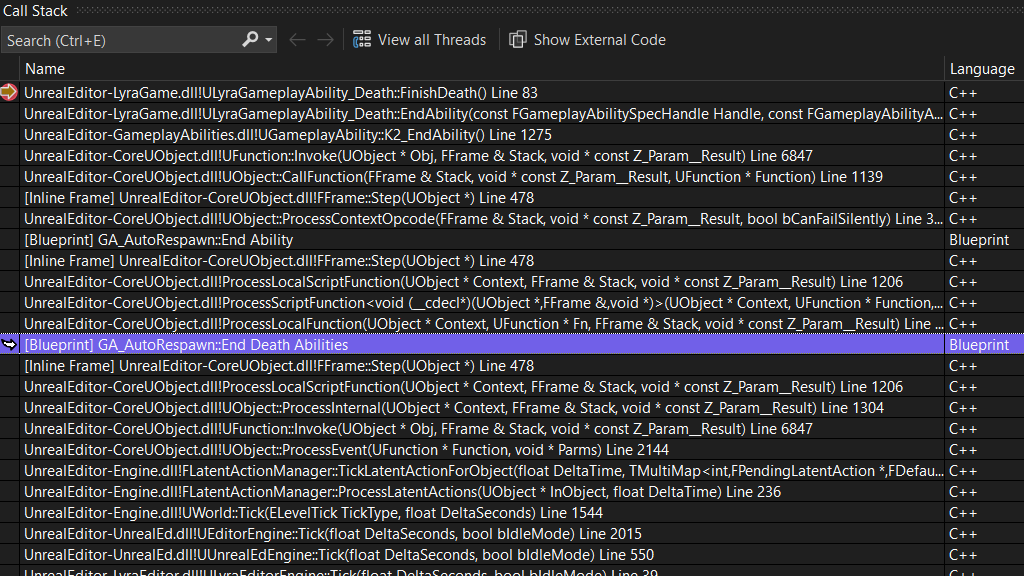
Unreal Engine Blueprint Debugger
Advanced support for debugging Unreal Engine Blueprints.
We are happy to announce enhanced debugging support for Unreal Engine projects. Visual Studio will now display Blueprint information directly in the call stack and local variables windows.
This update allows you to debug Blueprint and C++ code together in a single session, making it easier to trace interactions and identify issues across both scripting layers. In addition, you can now set breakpoints in Blueprint code, providing a more integrated debugging experience.
Hover tooltips for CMake modules
Added support for CMake modules in IntelliSense Quick Info and completions.
We are thrilled to announce that we have added support for IntelliSense-based completions and quick info for CMake modules in Visual Studio. Now, you can view all available CMake modules and learn more about them directly from the Visual Studio editor, making your development process smoother and more efficient.
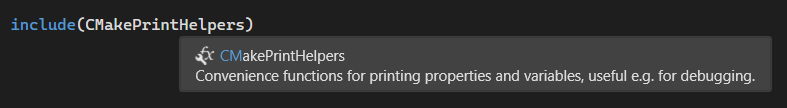
Quick Info
When you hover over a referenced CMake module, IntelliSense provides detailed information about the selected module, helping you understand its usage and functionality at a glance.
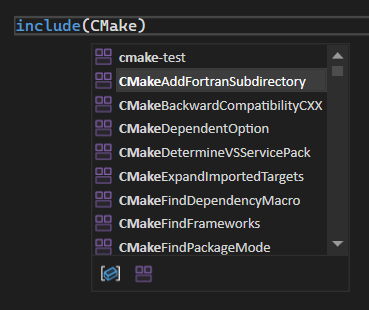
Completion
When you start typing a CMake module in your
CMakeLists.txtor other CMake script files, IntelliSense will provide a list of available modules to choose from.
C++ Dynamic Debugging
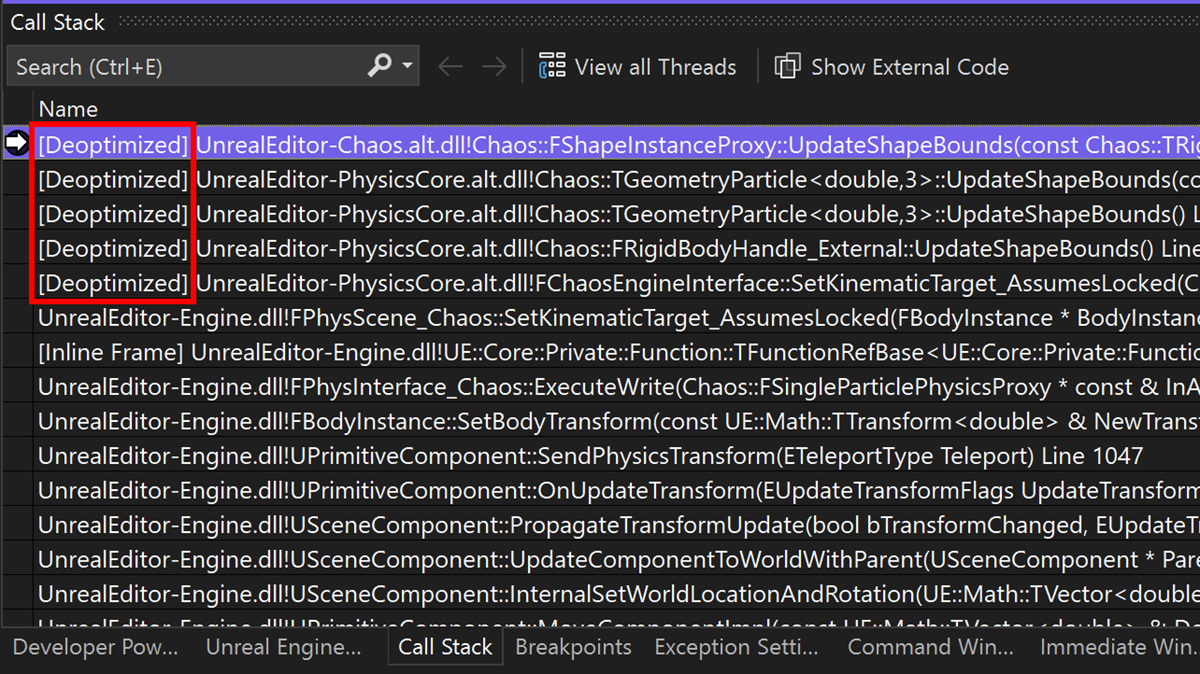
Full debuggability for your optimized C++ code without compromising on performance.
Debugging optimized code is now easier than ever. By activating C++ Dynamic Debugging, you can debug your optimized code as if it were unoptimized. You can view all your local variables, step in anywhere, and set full-fidelity breakpoints on your optimized binaries. For more details, please read our blog post.
Populate template IntelliSense
Template IntelliSense now automatically populates template arguments by using Go To Definition (F12).
You can now automatically populate template arguments in the template bar, which displays and allows editing of template parameters, when using Go To Definition or F12.
For example, pressing F12 on
vectorwill now jump tovectorwith the template bar automatically populated, allowing developers to quickly inspect and modify template parameters.In the example below, using Go To Definition or pressing F12 will populate both the type and allocator in the template bar.
Data
Use SDK-style SQL projects in SSDT 📣
You can now use the SDK-style project file format in your SQL Server Data Tools projects with enhanced SQL debugging and schema comparison capabilities.
The update in Visual Studio 17.14 introduces new item templates and .dacpac database references to SDK-style SQL Server Data Tools (preview). SDK-style SSDT SQL projects are based on the Microsoft.Build.Sql SDK, which provides cross-platform support and improved CI/CD capabilities for SQL Server Data Tools (SSDT) projects.
With less verbose project files and database references to NuGet packages, teams can collaborate more efficiently on large databases within a single project or compile multiple sets of objects from several projects. Database deployments from a Microsoft.Build.Sql project can be automated in both Windows and Linux environments using the Microsoft.SqlPackage dotnet tool to publish the build artifact (.dacpac) from the SQL project. Learn more about SDK-style SQL projects and DevOps for SQL.
In 17.14, database references have been expanded to support project and .dacpac artifact references. Support for database references as package references will be available in a future release. A recent update to the slngen solution file generator also added support for Microsoft.Build.Sql projects, enabling the management of large solutions programmatically.
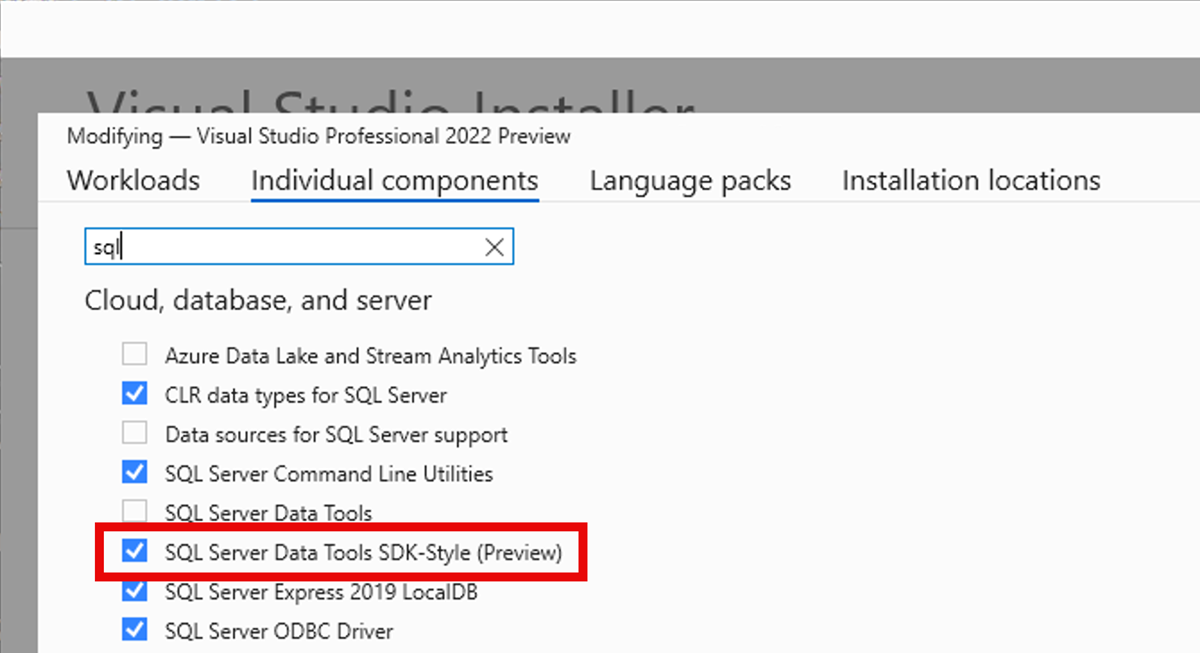
To use SDK-style SQL projects in your solution, make sure to install the latest SSDT preview component in the Visual Studio installer.
📣 See feature ticket to share your feedback and continue the conversation.
Extensibility
Install extension packs
The installer can now handle the installation of extension packs.
The installer now supports Extension Packs, which are bundles of multiple extensions referenced from a single extension.
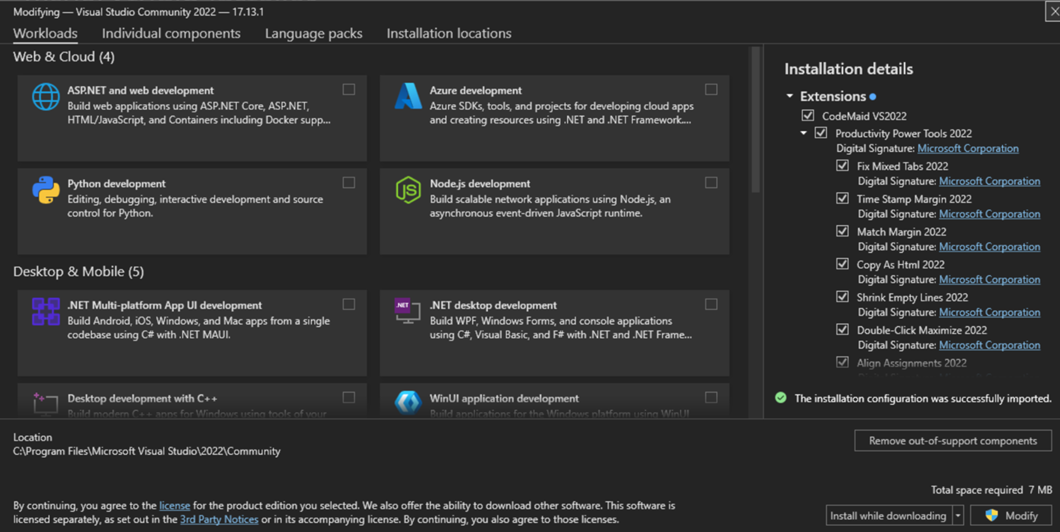
To use Extension Packs in the Installer, first specify the desired extensions in a .vsconfig file. Then, use the Visual Studio Installer's Import Configuration feature to import the .vsconfig file containing your extension details.
For more information on creating or generating .vsconfig files, refer to the installation configurations documentation.
After importing the .vsconfig file, you'll be directed to the modify screen where extensions will be grouped under their own heading in the installation summary pane. Here, you can select or deselect entire Extension Packs or individual extensions within any Packs.
Faster VSIX build times
VSIX projects with one or more project references now use intelligent incremental builds, drastically improving F5 scenarios and developer productivity.
If you're developing Visual Studio extensions with multiple projects, you'll love this performance enhancement! VSIX projects with one or more project references will now only build projects that actually need rebuilding, making your development workflow significantly faster.
How it works
The Fast Up-to-Date Check system has been improved to be smarter about determining which projects in your solution need rebuilding:
- If you modify Project A which depends on Projects B and C, only Project A will be rebuilt
- If you modify Project B, only Projects A and B will be rebuilt
- This intelligence extends throughout your entire project dependency tree
Real-world impact
The performance improvements are substantial in real-world scenarios. For example, the GitHub Copilot extension that ships with Visual Studio (with approximately 30 projects) saw build time improvements of over 50% for incremental changes - reducing build times from around 60 seconds to just 24 seconds!
This enhancement is particularly beneficial for:
- Large VSIX projects with multiple dependencies
- Rapid iteration development workflows
- Frequent F5 debugging sessions
Note that if your solution contains only a single project, you won't see any performance benefits from this enhancement.
Note: This only applies to SDK-Style VSIX projects.
Your extension development just got a whole lot faster - happy coding!

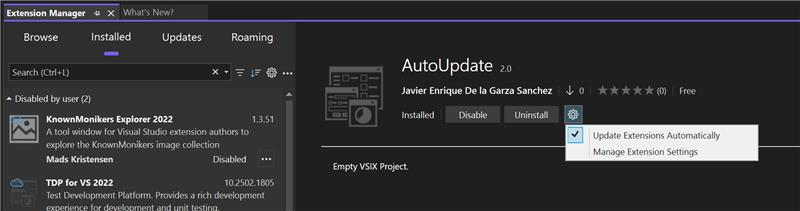
Extension Manager updates 📣
There are several new improvements to the Extension Manager in Visual Studio that will make it easier to manage your extensions.
We're excited to introduce a set of powerful new features in Visual Studio that streamline your workflow and improve the extension management experience. These updates ensure that you stay up to date effortlessly while giving you more control over how and when updates are applied.
What's New?
Seamless auto updates
Visual Studio will now automatically trigger updates when you open the application, ensuring you always have the latest features and fixes without manual intervention.
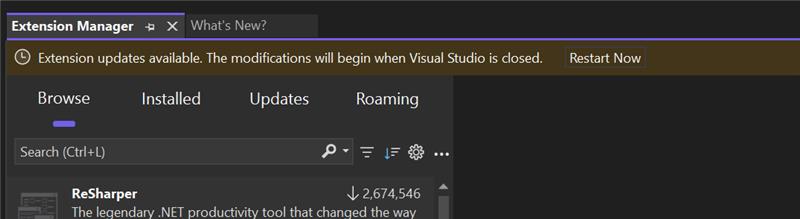
Restart gold bar for applied updates
When updates are applied, a gold bar notification will appear, prompting you to restart Visual Studio for the changes to take effect.
Auto update settings in extension page
We've made auto update settings more accessible by integrating them directly into the extension page, giving you quick access to configuration options.
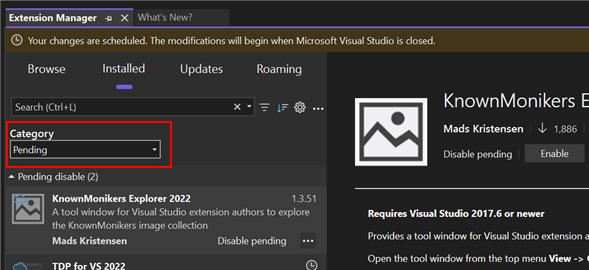
Filter by pending changes
A new Pending category now highlights pending changes, keeping you informed about updates and modifications that require attention.
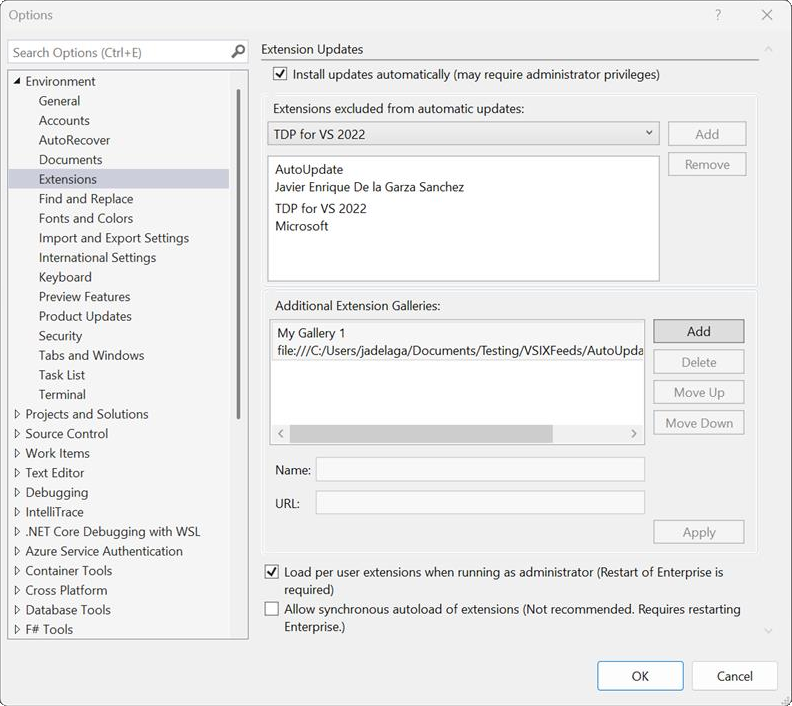
Auto update settings
In addition to the extension page, auto update settings are now available under Tools → Options → Environment → Extensions, allowing for a more intuitive settings management experience.
Simplified settings experience
We've streamlined the settings UI, making it easier to configure auto updates and other related preferences with fewer clicks and clearer options.
Excluded extensions list
Visual Studio now features an Excluded extensions list that auto-populates, helping you manage extensions that should not be updated automatically. This is particularly useful for mission-critical extensions where you prefer to control version updates manually.
These enhancements are designed to improve usability, reduce update friction, and give you greater control over your development environment while ensuring you benefit from the latest improvements.
📣 See feature ticket to share your feedback and continue the conversation.
Important
A breaking change has been made to Domain-Specific Language model serialization. Developers using the default serialization mechanism for their models that contain custom property types will need to add TypeConverters for those custom property types. For an example of how to do this, see Customizing File Storage and XML Serialization.
Version 17.14.31
Released April 21th, 2026
| Top bug fixes | From the community |
|---|---|
| Some applications using ASAN experience long build time | Feedback ticket |
| Github Copilot for Azure extension Query Azure Resource Graph tool fails | Feedback ticket |
Version 17.14.30
Released April 14th, 2026
| Top bug fixes | From the community |
|---|---|
| Update Node.js version for VS2022 | Feedback ticket |
| User stuck in permission waiting state for Copilot session | Feedback ticket; Feedback ticket |
| Copilot Opus 4.6 crashes with assistant message | Feedback ticket |
| Copilot sessions errors out after session pause | Feedback ticket |
| Fix for encoding issues with non-ASCII characters | |
| Support for GitHub Copilot through Azure extension workload |
| Security advisories addressed | CVE | Description |
|---|---|---|
| .NET Denial of Service Vulnerability | CVE-2026-26171 | A vulnerability exists in EncryptedXml class where uncontrolled resource consumption can give an attacker to the ability to perform a Denial of Service attack. |
| .NET Spoofing Vulnerability | CVE-2026-32178 | Improper neutralization of special elements in .NET allows an unauthorized attacker to perform spoofing over a network. |
| SQLite Memory Corruption Vulnerability | CVE-2025-6965 | There exists a vulnerability in SQLite versions before 3.50.2 where the number of aggregate terms could exceed the number of columns available. This could lead to a memory corruption issue. |
| Node.js TLS DoS Vulnerability | CVE-2026-21637 | A flaw in Node.js TLS error handling allows remote attackers to crash or exhaust resources of a TLS server when pskCallback or ALPNCallback are in use. |
| Visual Studio Information Disclosure Vulnerability | CVE-2026-32631 | An information disclosure vulnerability exists in MinGit due to NTLM hash leak to untrusted server. |
Version 17.14.29
Released March 17th, 2026
| Top bug fixes | From the community |
|---|---|
| Copilot hangs in agent mode when using multi-line terminal commands to edit or access files | Feedback ticket |
| Upgrade to VS 17.14 broke IntelliSense for projects built with Clang | Feedback ticket |
| Multi-line commands issues by model hang when Posh is enabled in PowerShell | Feedback ticket |
| Fix AddressSanitizer compatibility issue with Xbox Game OS |
Version 17.14.28
Released March 10th, 2026
| Top bug fixes | From the community |
|---|---|
| Trying to publish to a folder only builds and doesn't actually publish, unless extra optional components are installed | Feedback ticket |
| Bug fix in MSVC optimizer that causes bad assembly code generation |
| Security advisories addressed | CVE | Description |
|---|---|---|
| .NET Denial of Service Vulnerability | CVE-2026-26130 | A denial of service vulnerability exists in ASP.NET Core due to uncontrolled resource consumption. |
| .NET Elevation of Privilege Vulnerability | CVE-2026-26131 | An elevation of privilege vulnerability exists in .NET due to improper authorization. |
| Visual Studio Information Disclosure Vulnerability | CVE-2025-66413 | An information disclosure vulnerability exists in MinGit due to NTLM hash leak to untrusted server. |
Version 17.14.27
Released February 18th, 2026
| Top bug fixes | From the community |
|---|---|
| Analyze with Copilot response stopped abruptly mid stream | Feedback ticket |
| Updating the installer to include the latest servicing release of the 10.0.26100 Windows SDK (10.0.26100.7705) | Feedback ticket |
| Bug fix in MSVC optimizer that causes bad assembly code generation |
Version 17.14.26
Released February 10th, 2026
| Top bug fixes | From the community |
|---|---|
| VS extensions fail to update from private galleries that don't provide proper metadata | Feedback ticket |
| Security advisories addressed | CVE | Description |
|---|---|---|
| Github Copilot and Visual Studio Remote Code Execution Vulnerability | CVE-2026-21256 | This security update addresses a vulnerability where Improper neutralization of special elements used in a command ('command injection') in GitHub Copilot and Visual Studio allows an unauthorized attacker to execute code over a network. |
| Github Copilot and Visual Studio Security Feature Bypass Vulnerability | CVE-2026-21257 | This security update addresses a vulnerability where improper neutralization of special elements used in a command ('command injection') in GitHub Copilot and Visual Studio allows an authorized attacker to elevate privileges over a network. |
| .NET Security Feature Bypass Vulnerability | CVE-2026-21218 | This security update addresses a vulnerability where improper handling of missing special element in .NET and Visual Studio allows an authorized attacker to perform spoofing over a network. |
Version 17.14.25
Released January 20th, 2026
| Top bug fixes | From the community |
|---|---|
| Copilot edit_file fails with DocumentId null error for XAML files. | Feedback ticket |
| Analyzers crashing in 9.0.309 when used in msbuild |
Version 17.14.24
Released January 13th, 2026
| Top bug fixes | From the community |
|---|---|
| Visual Studio 2022 doesn't update through the Extension manager fails for our WPF Extension. | Feedback ticket |
| Cannot change Copilot settings | Feedback ticket |
Version 17.14.23
Released December 16th, 2025
| Top bug fixes | From the community |
|---|---|
| Search is broken in the MCP Registries window | Feedback ticket |
| Updated vcpkg to 2025-11-19 |
Version 17.14.22
Released December 9th, 2025
| Top bug fixes | From the community |
|---|---|
| Address Sanitizer's start address for thread local variables seems incorrect | Feedback ticket |
| x64 Emulator crash when an ARM64EC thread calls an x64 coroutine that calls another ARM64EC coroutine | Feedback ticket |
| The extension is not updating and uninstalling properly through the Visual Studio Marketplace. | Feedback ticket |
| Copilot review/diff fails with "Must be on view's current snapshot" error in Visual Studio | Feedback ticket |
| Fixed a bug seen in the auto-vectorizer where it may look like only part of the loop was faithfully executed. | |
| Updated the Visual Studio Installer to include the latest servicing release of the 10.0.26100 Windows SDK (10.0.26100.7175). |
Version 17.14.21
Released November 19th, 2025
| Top bug fixes | From the community |
|---|---|
| Fix LINK : fatal error LNK1000 when rebuilding project with incremental linking enabled. | Feedback ticket |
| Fixed an incorrect codegen issue with ternary expressions involving expressions with arrays of different types. | Feedback ticket |
| ASAN reorders validation calls leading to false negatives | Feedback ticket |
| Sanitizer Coverage Blocklist Broken | Feedback ticket |
| C4319 not emitted when compiling C code | Feedback ticket |
| C++/CLI - inline namespace does not work | Feedback ticket |
| Embedded and IoT tools component is deprecated in the Visual Studio Installer. | |
| Mobile development with C++ workload, including the C++ Android and C++ iOS development tool components are deprecated in the Visual Studio Installer. | |
| Fixed an issue when installing Visual Studio 2026 alongside Visual Studio 2022, where Visual Studio 2022 would incorrectly enable package pruning for all frameworks. This may result in unexpected NU1510 warnings when building from Visual Studio 2022. | Feedback ticket |
| "Connect To Feed" popup causes Visual Studio to be unable to delete anything until restart | Feedback ticket |
| Visual Studio 2022 remote debug auto connect issue | Feedback ticket |
| Performance Profiler does not load symbols correctly for unmanaged code in C++/CLI | Feedback ticket |
Version 17.14.20
Released November 11th, 2025
| Top bug fixes | From the community |
|---|---|
| GitHub Copilot Chat not showing Chat Text, only Code | Feedback ticket |
| Copilot Language Server recognized as a threat by McAfee antivirus in VS 2026 | Feedback ticket |
| Debug output not Valid, Visual Studio Analyze with Copilot in Debug | Feedback ticket |
| Fixed integer overflow in std::stable_sort and std::ranges::stable_sort when sorting huge inputs (over a billion 1-byte elements) on x86. | |
| Fixed a crash in the vectorized implementations of std::wstring::find_first_of/find_last_of that was specific to searching for certain combinations of characters inside and outside the [0, 255] range. | |
| updated Windows Driver Kit tools to support upcoming 26H1 release. | |
| Updated the Visual Studio Installer to include the latest servicing release of the 10.0.26100 Windows SDK (10.0.26100.6901). |
| Security advisories addressed | CVE | Descritpion |
|---|---|---|
| Visual Studio Remote Code Execution Vulnerability | CVE-2025-62214 | This security update addresses a vulnerability where improper neutralization of special elements used in a command ('command injection') in Visual Studio allows an authorized attacker to execute code locally |
Version 17.14.19
Released October 27th, 2025
| Top bug fixes | From the community |
|---|---|
| Copilot Language Server recognized as a threat by McAfee antivirus | Feedback ticket |
Version 17.14.18
Released October 20th, 2025
| Top bug fixes | From the community |
|---|---|
| The XAML editor will no longer mark nested classes as an error within {x:Static} and {x:Type} markup extensions. For example, {x:Static p:Class+Nested.Value} would be squiggled as an error even when it's valid. | Feedback ticket |
| Spell checker should split words between Lo and Ll/Lu categories | Feedback ticket |
| In Visual Studio 17.14.13, .NET C# error squiggles are not showing in Blend | Feedback ticket |
| New Visual Studio 2022 Updates Include LibCurl Library that Breaks Git | Feedback ticket |
| Visual Studio 2022 Enterprise - Not able to open App Service .diagsession files | Feedback ticket |
| Disabled usage of FP as a general purpose register on ARM64. | Feedback ticket |
| Updated the Visual Studio Installer to include the latest servicing release of the 10.0.26100 Windows SDK (10.0.26100.6584). | |
| Fixed a bad interaction with new pre-vector optimizations and the vectorizer pass (affects any optimized code /O2). | |
| Fixed unresolved external error while building ARM64X DLLs containing forwarded data. | Feedback ticket |
| PGO instrumentation runtime crash on ARM64 | Feedback ticket |
Version 17.14.17
Released October 14th, 2025
| Top bug fixes | From the community |
|---|---|
| .NET Upgrade Assistant extension is no longer compatible with Visual Studio Enterprise 17.14.36518.9 | Feedback ticket |
| Fixed a potential crash when evaluating C++ expressions during debugging. | Feedback ticket |
| Copilot chat window theme conflicts with theme settings | Feedback ticket |
| Using copilot to debug an exception in Android never works | Feedback ticket |
| Fixed a bug with the Copilot Profiler Agent where it failed to create a BenchmarkDotNet benchmark project. | |
| This version of .NET iOS introduces support for Apple iOS 26 and requires the use of Apple Xcode 26. For more details see .NET for iOS/tvOS/macOS/macCatalyst release notes |
| Security advisories addressed | CVE | Descritpion |
|---|---|---|
| Visual Studio Information Disclosure Vulnerabilityl | CVE-2025-54132 | This security update addresses Arbitrary Data Exfiltration Via Markdown Mermaid |
| Visual Studio Remote Code Execution Vulnerability | CVE-2025-55240 | This security update addresses an Untrusted Search Path Remote Code Execution Vulnerability in Gulpfile |
| .NET Security Feature Bypass Vulnerability | CVE-2025-55315 | This security update addresses an HTTP Request Smuggling vulnerability due to incorrect parsing of chunk extension |
| .NET Information Disclosure Vulnerability | CVE-2025-55248 | This security update addresses a vulnerability where SmtpClient may connect without TLS even if UseSsl is true |
Version 17.14.16
Released September 23rd, 2025
| Top bug fixes | From the community |
|---|---|
| Nuget Package Manager for Project -> Connect To Feed Spam | Feedback ticket |
| Using UseDynamicDebugging makes link.exe return error 1422 and forget how to report error details | Feedback ticket |
| Unable to view existing TFVC check in policy | Feedback ticket |
Version 17.14.15
Released September 16th, 2025
| Top bug fixes | From the community |
|---|---|
| Improve GitHub Copilot Resilience to Internet Disruptions in Visual Studio | Feedback ticket |
| ASAN false use-after-scope positive when access happens in exception handler | Feedback ticket |
| C++ dynamic debugging initialises static locals incorrectly | Feedback ticket |
| "LINK : error LNK2001: unresolved external symbol" after upgrading to VS 17.14.5 | Feedback ticket |
| KASAN drivers fail to link referencing wide string functions (wcscat, wcscpy, wcsncpy) | Feedback ticket |
| Visual Studio 2022 Github Copilot Build stalls when using Cmake without linker | Feedback ticket |
| Copilot Agent mode errors - 'get_output_window_logs' failed: Could not derive value of type System.Guid from argument paneId | Feedback ticket |
| We brought the new Copilot Profiler Agent into Visual Studio 2022, allowing users to get help in optimizing their code. |
Version 17.14.14
Released September 9th, 2025
| Top bug fixes | From the community |
|---|---|
| Symbols download no longer working | Feedback ticket |
| Fixed an issue with the value category of member accesses. | Feedback ticket |
| Fixed an issue with the value category of arrays. | Feedback ticket |
| Fixed an ICE related to an incorrectly determined value category of an array. | Feedback ticket |
| Fixed an issue where MSBuild would produce an internal error instead of reporting a build message when glob expansion failed. | |
| .NET runtime is updated to 8.0.20 and 9.0.9, and .NET SDK to 9.0.305 | |
| Extension update in VS 17.14 | Feedback ticket |
| GitHub Copilot Chat window auto-scrolls to latest generated word, preventing reading from top during response generation | Feedback ticket |
| Configure Code Coverage Views fails | Feedback ticket |
| Agent: total changes popup remains in chat window, cannot dismiss | Feedback ticket |
Version 17.14.13
Released August 19th, 2025
| Top bug fixes | From the community |
|---|---|
| VS 2022 v17.14.11 cannot load mcp servers | Feedback ticket |
| Copilot Agent mode breaks and cannot be recovered in this thread: System.ArgumentException: Illegal characters in path EditsFunctionHandler GetErrorsAsync | Feedback ticket |
| Live Visual Tree and Live Property Explorer not working | Feedback ticket |
| Fixed an issue where missing string values were incorrectly written as empty strings in localized RESX files, leading to empty strings being returned for those cultures. With this fix, such values are now written as null, allowing them to be resolved as the default (neutral) value. | Feedback ticket |
| Symbols missing for ucrtbased.dll version 10.0.26100.4188 | Feedback ticket |
| Updated MinGit to v2.50.1 to address an issue where users with repositories located on ReFS volumes and Windows Server 2022 couldn't perform Git operations with VS IDE. | Feedback ticket |
| Fixed an issue where incorrect IntelliSense errors were reported in certain source files encoded as Shift JIS and containing string literals with Japanese characters. | |
| VS now includes MAUI 9.0.82 (SR8.2) | |
| Fixed a stack overflow crash when linking certain MASM-generated debug information. |
Version 17.14.12
Released August 12th, 2025
| Security advisories addressed | CVE | Descritpion |
|---|---|---|
| GitHub Copilot and Visual Studio Remote Code Execution Vulnerability | CVE-2025-53773 | This security update addresses a vulnerability where Copilot changes settings to set chat.tools.autoApprove to true |
Version 17.14.11
Released August 4th, 2025
| Top bug fixes | From the community |
|---|---|
| False positive lifetime code analysis warning C26849: Don't dereference an invalid pointer (lifetime.1). | Feedback ticket |
| Fixed legality checks for SIMD optimization. | Feedback ticket |
| Regression from 19.43: link.exe crashes during PDB generation with long symbols | Feedback ticket |
| Fixed incorrect chkstk calls on ARM64EC with /Gs0. | Feedback ticket |
| Environments in http-client.env.json are not picked up (since update to Visual Studio 17.14.0) | Feedback ticket |
| Copilot Agent mode breaks and cannot be recovered in this thread: System.ArgumentException: Illegal characters in path EditsFunctionHandler GetErrorsAsync | Feedback ticket |
| The following Windows SDK versions have been removed from the Visual Studio 2022 installer: 10.0.18362.0, 10.0.20348.0 and 10.0.22000.0. If you previously installed one of these versions of the SDK using Visual Studio it will be uninstalled when you update. If your project targets any of these SDKs you may encounter a build error such as: The Windows SDK version 10.0.22000.0 was not found. Install the required version of Windows SDK or change the SDK version in the project property pages or by right-clicking the solution and selecting "Retarget solution". To resolve this, we recommend retargeting your project to 10.0.26100.0, or an earlier supported version if necessary. For a complete list of supported SDK versions please visit: https://developer.microsoft.com/windows/downloads/sdk-archive/. If you need to install an unsupported version of the SDK, you can find it here: https://developer.microsoft.com/windows/downloads/sdk-archive/index-legacy/. |
Version 17.14.10
Released July 29th, 2025
| Top bug fixes | From the community |
|---|---|
| After Update to 17.14.8 I'm unable to build iOS-Projects | Feedback ticket |
| Extension update in VS 17.14 | Feedback ticket |
| Agent mode unusable due to model_max_prompt_tokens_exceeded | Feedback ticket |
| Github Copilot hangs in Visual Studio when running dotnet commands | Feedback ticket |
| The GitHub Copilot UI in Visual Studio does not automatically update the MCP server dynamic tool list | Feedback ticket |
| Visual studio debugging option "Always run untrusted source server commands without prompting" not working as expected | Feedback ticket |
| AI, Copilot, Agents and MCP - .mcp.json dotnet run command cannot make use of relative pathing | Feedback ticket |
| .NET 9 MAUI : The .NET runtime 9.0.5 or newer could not be found | Feedback ticket |
| For MAUI apps, there was a Live Preview toolbar and button at the top of the XAML editor. The button has been moved to a menu item under "Debug > Windows" which will allow keyboard accessibility and feature search to work. With the toolbar gone, the XAML editor gets vertical space back. | Feedback ticket |
| Typing "\x" in the editor at the end of a line would cause the IDE to hang indefinitely | Feedback ticket |
| Live Unit Testing fails with 'Could not find file ... .cshtml__virtual.html__virtual.js' | Feedback ticket |
| Fixed an MSBuild hang that could cause Visual Studio solution loads to hang. | |
| Ensure vulnerability data is not queried by the Package Manager UI during NuGet operations (add, update, uninstall) if NuGet Audit has been turned off. | |
| Social login support with Google is now integrated for GitHub Copilot in Visual Studio. |
Version 17.14.9
Released July 15th, 2025
| Top bug fixes | From the community |
|---|---|
| GitHub Copilot Agent Preview can't run terminal commands after running unit tests | Feedback ticket |
| Copilot file changes preview is empty | Feedback ticket |
| Escape key doesn't close the find box in a XAML file | Feedback ticket |
| Fixed listing Android debug targets when there is an invalid Java executable in the PATH. | Feedback ticket |
| Extension update in VS 17.14 | Feedback ticket |
| Removed filtering on C++ #include completions so that full lists are shown when both typing angle brackets and quotes. | Feedback ticket |
| AI, Copilot, Agents and MCP - .mcp.json dotnet run command cannot make use of relative pathing | Feedback ticket |
| Improved user experience when provisioning a Function App using Flex Consumption by removing the option to create a Linux Consumption Function App within Visual Studio. | |
| Fixed issues where customers would need to close StandardCollector.Service.exe during installs and updates. |
Version 17.14.8
Released July 8th, 2025
| Top bug fixes | From the community |
|---|---|
| Can no longer build the net9.0-ios target of my MAUI project | Feedback ticket |
| When setting the properties of a C# or VB.NET project, the "Startup object" dropdown will correctly show the objects you can choose from. | Feedback ticket |
| Docker containers are not showing up in Visual Studio for debugging. | Feedback ticket |
| Updated the Visual Studio Installer to include the latest servicing release of the 10.0.26100 Windows SDK (10.0.26100.4188). |
| Security advisories addressed | CVE | Descritpion |
|---|---|---|
| Visual Studio - Elevation Of Privilege | CVE-2025-49739 | Time-of-check to time-of-use in Standard Collector Service allows Local privilege escalation |
| Gitk Arguments Vulnerability | CVE-2025-27613 | Gitk Arguments Vulnerability |
| Gitk Abitryary Code Execution Vulnerability | CVE-2025-27614 | Gitk Abitryary Code Execution Vulnerability |
| Git Malicious Shell Vulnerability | CVE-2025-46334 | Git Malicious Shell Vulnerability |
| Git File Overwrite Vulnerability | CVE-2025-46835 | Git File Overwrite Vulnerability |
| Git Symlink Vulnerability | CVE-2025-48384 | Git Symlink Vulnerability |
| Git Protocol Injection Vulnerability | CVE-2025-48385 | Git Protocol Injection Vulnerability |
| Git Credential Helper Vulnerability | CVE-2025-48386 | Git Credential Helper Vulnerability |
Version 17.14.7
Released June 23rd, 2025
| Top bug fixes | From the community |
|---|---|
| GitHub Copilot Chat Error: "Could not parse ov" - Persistent Issue | Feedback ticket |
| Fixed an issue when an include path was quoted with whitespace between the compiler option and the path, none of the files in the path would show up in the include completion list. | Feedback ticket |
| Escape not detected in Developer PowerShell in 17.14 | Feedback ticket |
| Updated to VS 17.14 - NCrunch 5.10.0.7 breaks | Feedback ticket |
| Unable to build VB.NET app in VS2022 17.14.0 preview 1.1 | Feedback ticket |
| Implemented several changes to improve the user experience and accessibility for Inline Completions. |
Version 17.14.6
Released June 17th, 2025
| Top bug fixes | From the community |
|---|---|
| VS 17.14 regression: ASAN bad codegen with x64 Release configuration | Feedback ticket |
| Sanitizer Coverage Produces Bad Codegen | Feedback ticket |
| Fixed an issue where Razor formatting would sometimes appear to do nothing for specific syntax patterns or configurations. | Feedback ticket |
| GitHub Copilot Agent Preview can't run terminal commands after running unit tests | Feedback ticket |
| When EventTrigger's routing event is Loaded, the Storyboard cannot find the target element by name. | Feedback ticket |
| Fixed a false-positive syntax error in boost::parser | Feedback ticket |
| Copilot cannot see the difference between .xaml.cs and .xaml | Feedback ticket |
| MSVC AddressSanitizer now supports projects using a dynamically linked Universal C Runtime with a statically linked VCRuntime, frequently used in software like plugins. | Feedback ticket |
| Fixed an issue with complex trait detection code that caused a compiler crash. | Feedback ticket |
| Copilot assistant 'run_build' failed | Feedback ticket |
| Fixed a crash when using the navigate button to edit menu item for Next Edit Suggestions. | |
| Fixed ConcRT (Concurrency Runtime) initialization on multi-socket machines with modified processor affinity. |
Version 17.14.5
Released June 10th, 2025
| Top bug fixes | From the community |
|---|---|
| The remote debugger via SSH hangs before hitting a breakpoint | Feedback ticket |
| Security advisories addressed | CVE | Descritpion |
|---|---|---|
| Visual Studio Remote Code Execution Vulnerability | CVE-2025-47959 | Improper neutralization of special elements used in a command ('command injection') in Visual Studio allows an authorized attacker to execute code over a network. |
| .NET and Visual Studio Remote Code Execution Vulnerability | CVE-2025-30399 | Untrusted search path in .NET and Visual Studio allows an unauthorized attacker to execute code over a network. |
Version 17.14.4
Released June 3rd, 2025
| Top bug fixes | From the community |
|---|---|
| Type or Namespace Can't Be Found Error on the Razor's PageModel | Feedback ticket |
| VS 2022 17.14 p1.1 cannot complete a build. "error D8040: error creating or communicating with child process." | Feedback ticket |
| #include completion no longer suggests files or folders in path | Feedback ticket |
| Visual Studio kept on asking me to re-enter credential [expansion.microsoft.com tenant blocked] | Feedback ticket |
Version 17.14.3
Released May 28th, 2025
| Top bug fixes | From the community |
|---|---|
| Problem storing COleDateTime with RFX_Date | Feedback ticket |
| Android launch options are missing | Feedback ticket |
| When I create a new script in Unity and open VS again for editing, all the previously fixed tabs disappear. | Feedback ticket |
| I have to restart VS each time I change something in code (Xamarin) | Feedback ticket |
| Changing git branches causes open files to be closed | Feedback ticket |
| "Quick Action & Refactoring > Create Definition" not working in 17.14 Update (UE5) | Feedback ticket |
Version 17.14.2
Released May 22nd, 2025
| Top bug fixes | From the community |
|---|---|
| Fixed an issue where VS will crash if opening a Solution containing C++ projects via a UNC path. | Feedback ticket |
Version 17.14.1
Released May 21th, 2025
| Top bug fixes | From the community |
|---|---|
| Feature 'xxx' is currently unavailable due to an internal error. System.NotSupportedException : The given path's format is not supported. | Feedback ticket |
| Fixed an issue that occurs when creating an upload package for the Microsoft Store. | Feedback ticket |
Fixed an issue with the Razor source generator that could cause it to fail to run with a System.ArgumentOutOfRangeException. |
|
| Fixed an issue that addresses a hang that occurred when closing a resource file editor before it completed initialization. |
From our entire team, thank you for choosing Visual Studio! For the latest updates, resources, and news, check out the Visual Studio Hub and stay in touch.
Happy coding!
The Visual Studio team
Note
This update may include new Microsoft or third-party software that is licensed separately, as set out in the 3rd Party Notices or in its accompanying license.