Note
Access to this page requires authorization. You can try signing in or changing directories.
Access to this page requires authorization. You can try changing directories.
This article provides guidance on how to use the extended Apache Spark history server to debug and diagnose completed and running Apache Spark applications.
Access the Apache Spark history server
The Apache Spark history server is the web user interface for completed and running Spark applications. You can open the Apache Spark web user interface (UI) from the progress indicator notebook or the Apache Spark application detail page.
Open the Spark web UI from progress indicator notebook
When an Apache Spark job is triggered, the button to open Spark web UI is inside the More action option in the progress indicator. Select Spark web UI and wait for a few seconds, then the Spark UI page appears.

Open the Spark web UI from Apache Spark application detail page
The Spark web UI can also be opened through the Apache Spark application detail page. Select Monitor on the left side of the page, and then select an Apache Spark application. The detail page of the application appears.

For an Apache Spark application whose status is running, the button shows Spark UI. Select Spark UI and the Spark UI page appears.

For an Apache Spark application whose status is ended, the ended status can be Stopped, Failed, Canceled, or Completed. The button shows Spark history server. Select Spark history server and the Spark UI page appears.

Snapshot-Based Loading for Large Event Logs
A new snapshot-based loading method has been introduced for the Spark History Server, optimized for large event log scenarios.
With this enhancement, the Spark UI progressively reveals available data instead of waiting for the full replay to complete. When the event log size is 6 GB or larger, a loading message is displayed to indicate that additional loading time (typically a few minutes) may be required.
As soon as a partial snapshot is available, the UI renders using that data. A message bar at the top indicates that data is still being processed in the background. Once the full replay completes, the message bar is automatically removed, and the full view is displayed.
With this experience, you can:
- See a clear loading message for large event logs (≥ 6 GB), so you know the system is actively processing rather than unresponsive
- Browse a partial snapshot early through a clearly labeled preview banner, allowing you to investigate jobs and stages without waiting for the full replay
- Refresh the page later to load the complete dataset once processing has finished
When the Spark History data is fully loaded, the partial loading message bar disappears and the full experience is available.

Explore Apache Spark History Server
The Apache Spark History Server provides a web-based user interface (UI) that reconstructs Spark application execution details from event logs. It enables users to analyze completed or running applications beyond their runtime lifecycle.
The History Server UI consists of multiple tabs, each offering a different perspective for understanding application behavior, performance, and resource utilization.
Jobs tab
The Jobs tab provides a high-level overview of all jobs within a Spark application.
You can use this view to:
- Monitor job status (running, succeeded, or failed)
- Compare job durations
- Quickly identify failed or slow-running jobs
Stages tab
The Stages tab shows detailed execution information for each stage.
You can use this view to:
- Analyze stage-level performance
- Review task distribution and shuffle metrics
- Identify bottlenecks such as skewed data or expensive operations

Stage number limit
For performance consideration, by default the graph is only available when the Spark application has fewer than 500 stages. If there are too many stages, it will fail with an error like this:
The number of stages in this application exceeds limit (500), graph page is disabled in this case.
As a workaround, before starting a Spark application, please apply this Spark configuration to increase the limit:
spark.ui.enhancement.maxGraphStages 1000
But please notice that this may cause bad performance of the page and the API, because the content can be too large for browser to fetch and render.
Storage tab
The Storage tab shows information about cached data.
You can use this view to:
- Understand memory and disk usage for cached datasets
- Verify whether caching is effective
Environment tab
The Environment tab lists runtime configuration and environment details.
You can use this view to:
- Inspect Spark configuration settings
- Verify environment variables and dependencies
- Troubleshoot configuration-related issues
Executors tab
The Executors tab displays resource utilization across executors.
You can use this view to:
- Monitor CPU and memory usage
- Analyze task distribution across executors
- Identify executor failures or imbalances
Graph tab
The Graph tab visualizes the execution of a Spark job as a directed acyclic graph (DAG), representing the relationships between stages.
You can use this view to:
- Understand how a job is broken down into stages and their dependencies
- Identify critical paths that determine overall job duration
- Detect failed or retried stages
- Replay job execution to observe how tasks progress over time
This tab is particularly useful for understanding execution flow and identifying high-level performance bottlenecks.

Diagnosis tab
The Diagnosis tab provides advanced analysis capabilities, including:
- Data skew detection
- Time skew analysis
- Executor Usage Analysis
Check the Data Skew, Time Skew, and Executor Usage Analysis by selecting the tabs respectively.

This tab helps identify performance bottlenecks and inefficiencies in job execution.
Data Skew
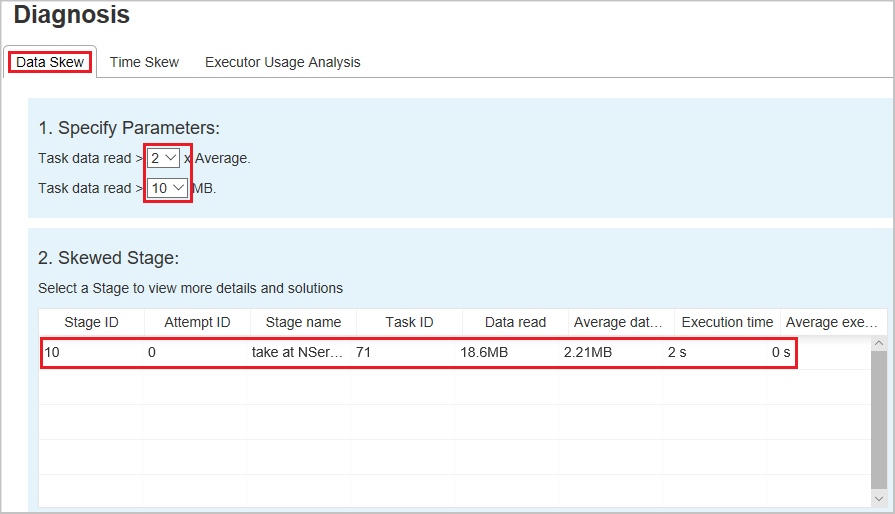
When you select the Data Skew tab, the corresponding skewed tasks are displayed based on the specified parameters.
Specify Parameters - The first section displays the parameters, which are used to detect Data Skew. The default rule is: task data read is greater than three times of the average task data read, and the task data read is more than 10 MB. If you want to define your own rule for skewed tasks, you can choose your parameters. The Skewed Stage and Skew Char sections are refreshed accordingly.
Skewed Stage - The second section displays stages, which have skewed tasks meeting the criteria previously specified. If there's more than one skewed task in a stage, the skewed stage table only displays the most skewed task (for example, the largest data for data skew).
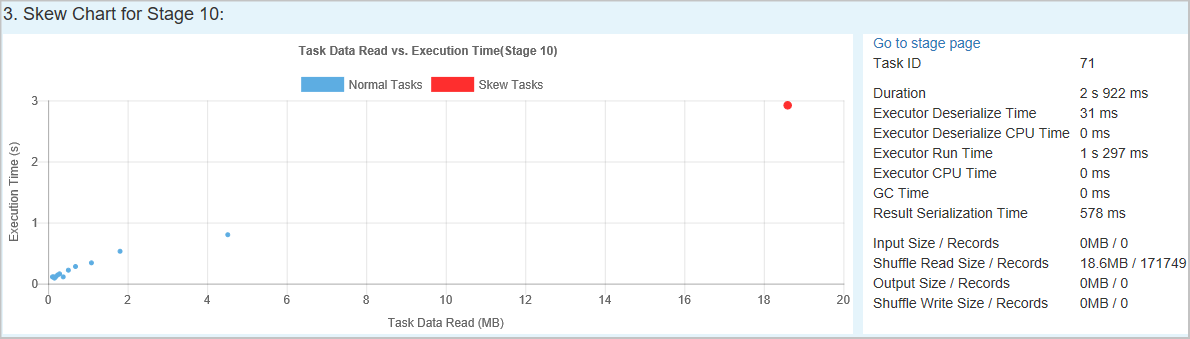
Skew Chart - When a row in the skew stage table is selected, the skew chart displays more task distribution details based on data read and execution time. The skewed tasks are marked in red and the normal tasks are marked in blue. The chart displays up to 100 sample tasks, and the task details are displayed in right bottom panel.


Time Skew
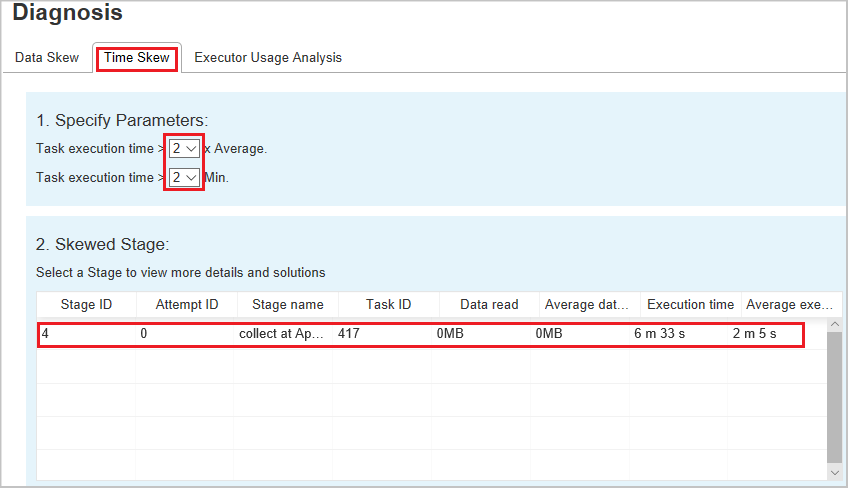
The Time Skew tab displays skewed tasks based on task execution time.
Specify Parameters - The first section displays the parameters, which are used to detect time skew. The default criteria to detect time skew is: task execution time is greater than three times of average execution time and task execution time is greater than 30 seconds. You can change the parameters based on your needs. The Skewed Stage and Skew Chart display the corresponding stages and tasks information just like the Data Skew tab described previously.
Select Time Skew, then filtered result is displayed in Skewed Stage section according to the parameters set in section Specify Parameters. Select one item in Skewed Stage section, then the corresponding chart is drafted in section 3, and the task details are displayed in right bottom panel.

Executor Usage Analysis
This feature has been deprecated in Fabric now. If you still want to use this as a workaround, please access the page by explicitly adding "/executorusage" behind path "/diagnostic" in the URL, like this:

SQL/DataFrame tab
For workloads using Spark SQL, the SQL tab provides query-level insights.
You can use this view to:
- Analyze query execution plans
- Review query duration and performance
Note
The availability of certain tabs depends on the workload type and enabled Spark features.
Spark Executor Rolling Logs: Easier Access for Large and Long Jobs
As Spark applications continue to grow in scale and duration, efficient log management and analysis have become increasingly critical. To address these evolving needs, we’ve introduced enhancements to the Spark History Server (for completed applications) and Spark UI (for running applications), enabling executor rolling logs for Spark 3.4 and above.
With this enhancement, when an executor log exceeds 16MB or the Spark job runs for more than one hour, the system automatically splits logs into hourly segments. This makes it easier to navigate, view, and download logs without dealing with extremely large files.
You can now:
- View logs by hour to quickly pinpoint specific execution windows
- Access the latest active logs while the job is still running.
- Download individual hourly logs or all logs together as needed
This feature empowers users to locate and analyze logs from a particular timepoint with ease, while avoiding the hassle of downloading or opening a massive single log file.
Below is an example of the Executor Rolling Logs view:
